Kay Eady, Community-Based Researcher, Baker County:
Do I go to the doctor or do I buy groceries? You shouldn’t have to make that kind of decision.
Olivia Coley-Pearson, Community-Based Researcher, Coffee County:
Black women are being left out of healthcare infrastructure and resources. African American women are twice as likely to die from cervical cancer, as opposed to white women. To find out these alarming numbers about Black women dying from something that is preventable, is very disturbing.
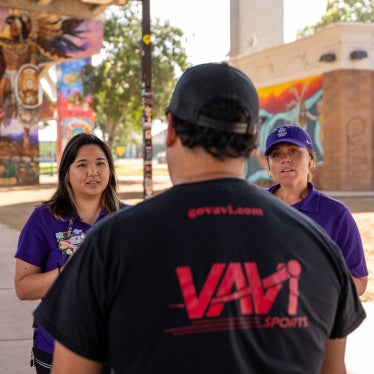
Community-Based Researchers:
Hi. How’s everybody doing?
Kay Eady, Community-Based Researcher, Baker County:
When approached about becoming a community-based researcher, I just knew I was going to be asking questions and surveys to women in the community about cervical cancer issues and health issues.
So, when I heard about the barriers of transportation, health care and finances, I must admit I was a little shocked.
Teretha White, Research Participant, Baker County Resident:
The health insurance I applied for was like over $200 [a month] and that’s just too much.
I can’t afford, how would I live? A lot of times, you know, I don't go to the doctor because then if I did come down with something, I wouldn’t be able to treat it. So, I just don’t go.
Kay Eady, Community-Based Researcher, Baker County:
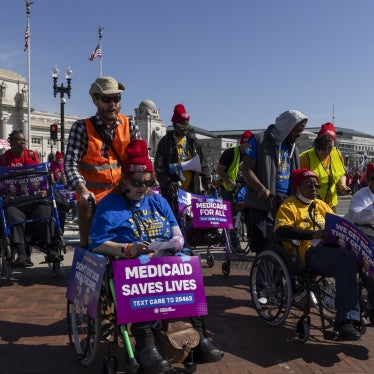
Baker County is located in southwest Georgia, away from Interstate 75. in southwest Georgia, away from Interstate 75. So, there’s not a lot of industry or trade or anything there.
It has a community of individuals that are supportive of each other. Unfortunately, it's an area dominated by poverty. The income is low. There are not really any jobs within Baker County.
Sometimes the health center only has one physician to see all of the patients. There is not a regular OB-GYN in Baker County.
Janet Anderson, Nurse, Baker County Primary Health Care:
When we talk about reproductive cancer, when you reach a certain age, making sure that you get your mammograms, your Paps, all of that should be done.
But if you don’t have health insurance, nobody’s going to do it for you.
If you don't get the health care you need for one problem, it could lead to another problem.
I've seen this happen with a patient. She was turned down for Medicare or Medicaid. She didn't get the health care that she needed. I think she may have lasted maybe two or three years [and] passed away. And that's the kind of stuff that really just bothers me.
Olivia Coley-Pearson, Community-Based Researcher, Coffee County:
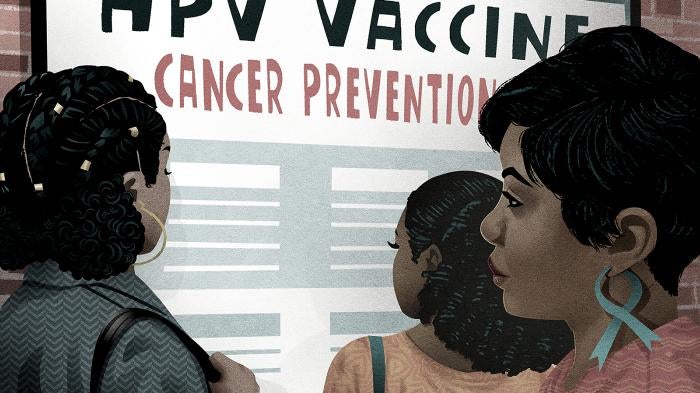
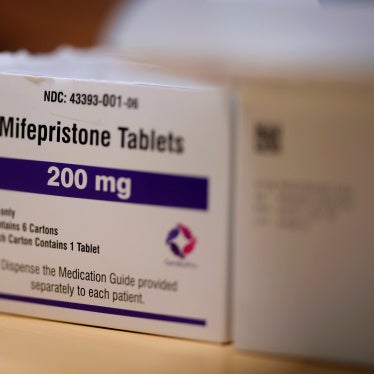
Based upon the research that we conducted, Black women in Georgia are more apt to be diagnosed with cervical cancer in the later stages because they have not received preventive treatment.
And we found out that the majority are not aware that there is the HPV vaccine, which would actually prevent cervical cancer.
Most of them are not informed by their doctors. What do you do if you feel that you're being discriminated against where you feel that you were not given the information you should have been given because you're Black or because you're low-income?
That's a great barrier and it has a traumatic effect on Black women in rural communities.
Kay Eady, Community-Based Researcher, Baker County:
Coming up with resolutions at the grassroot level is key in any community because everybody in that community knows everyone, especially when you're talking about a community as small as Baker.
Grace Miller, Baker County Resident:
We need to have some programs to educate the women about how to take care of their body, how to go to the doctor and get themselves seen about it. Because one thing about it, cancer don’t care who it is.
Kay Eady, Community-Based Researcher:
It doesn’t care.
Grace Miller, Baker County Resident:
You’ve got to keep yourself checked.
Olivia Coley-Pearson, Community-Based Researcher, Coffee County:
On the federal level, we need to have more accountability. So, the government's responsibility is to make sure that all women, regardless of their socioeconomic status, are afforded resources and solutions.
Kay Eady, Community-Based Researcher, Baker County:
Shouldn’t have a high incidence of cervical cancer. It’s one of the few diseases that we have that can be eradicated. I strongly believe in you take care of the people that need it most. We cannot afford to repeat the cycle of cervical cancer.