Summary
Life in prison can challenge anyone, but it can be particularly hard for people whose bodies and minds are being whittled away by age.
Prisons in the United States contain an ever growing number of aging men and women who cannot readily climb stairs, haul themselves to the top bunk, or walk long distances to meals or the pill line; whose old bones suffer from thin mattresses and winter’s cold; who need wheelchairs, walkers, canes, portable oxygen, and hearing aids; who cannot get dressed, go to the bathroom, or bathe without help; and who are incontinent, forgetful, suffering chronic illnesses, extremely ill, and dying.
Using data from the United States Bureau of Justice Statistics (BJS), Human Rights Watch calculates that the number of sentenced federal and state prisoners who are age 65 or older grew an astonishing 94 times faster than the total sentenced prisoner population between 2007 and 2010. The older prison population increased by 63 percent, while the total prison population grew by 0.7 percent during the same period.
Some older men and women in prison today entered when they were young or middle-aged; others committed crimes when they were already along in years. Those who have lengthy sentences, as many do, are not likely to leave prison before they are aged and infirm. Some will die behind bars: between 2001 and 2007, 8,486 prisoners age 55 or older died in prison.
This report is the first of two that Human Rights Watch plans to issue on the topic of elderly prisoners in the US.[1] It presents new data on the number of aging men and women in prison; provides information on the cost of confining them; and based on research conducted in nine states where prisons vary significantly in size, resources, and conditions, offers an overview of some ways that prison systems have responded to them. The report tackles some policy considerations posed by incarcerating elderly inmates, and raises the human rights concerns that must be addressed if sound policies are to be developed for the criminal punishment and incarceration of older prisoners, both those who grow old in prison and those who enter at an advanced age.
Prison officials are hard-pressed to provide conditions of confinement that meet the needs and respect the rights of their elderly prisoners. They are also ill-prepared—lacking the resources, plans, commitment, and support from elected officials—to handle the even greater numbers of older prisoners projected for the future, barring much needed changes to harsh “tough on crime” laws that lengthened sentences and reduced or eliminated opportunities for parole or early release.
Human Rights Watch presents in this report new statistics that testify unequivocally to the aging of the US prison population. Among our findings:
- Between 2007 and 2010, as noted above, the number of sentenced state and federal prisoners age 65 or older increased by 63 percent, while the overall population of sentenced prisoners grew only 0.7 percent in the same period. There are now 26,200 prisoners age 65 or older.
- Between 1995 and 2010, the number of state and federal prisoners age 55 or older nearly quadrupled (increasing 282 percent), while the number of all prisoners grew by less than half (increasing 42 percent). There are now 124,400 prisoners age 55 or older.
- As of 2010, 8 percent of sentenced state and federal prisoners are age 55 or older, more than doubling from 3 percent in 1995.
- One in ten state prisoners is serving a life sentence.
- Eleven percent of federal prisoners age 51 or older are serving sentences ranging from 30 years to life.
It is increasingly costly for correctional systems to respond to the needs of their geriatric populations, including their need for medical and mental health care. According to information gathered by Human Rights Watch, including previously unpublished data, annual medical expenditures are three to nine times greater for older state prisoners than for others. Since federal health insurance programs do not cover medical care for men and women behind bars, states shoulder the entire burden for their inmates. Taxpayers also bear the financial burden of expensive prison security and control measures for those individuals who, due to their age and infirmities, pose a negligible safety risk.
Providing medical care to older prisoners comes with a steep price tag because of their greater medical needs. Older prisoners are more likely than younger ones to develop mobility impairments, hearing and vision loss, and cognitive limitations including dementia. Older prisoners are also more likely to have chronic, disabling, and terminal illnesses. Prisoners who continue to age behind bars will eventually require assisted living and nursing home levels of care while incarcerated. Prison officials look at the projected increase in aging prisoners in their systems and realize in the very near future they will need to operate specialized geriatric facilities; some already do.
Corrections officials must respect the human rights of all prisoners, and what is required to respect those rights can vary according to the needs and vulnerabilities of the individual prisoner.
For an old and frail person, the right to safe conditions of confinement means not having to live in a dorm with younger persons prone to violence and extortion; the right to decent conditions of confinement means receiving extra blankets and clothing in winter because it is harder to stay warm; and the right to rehabilitation means receiving age-appropriate educational, recreational, and vocational opportunities. For an older offender who is mobility-impaired, accommodation of that disability will require assignment to a lower bunk, permission to take shortcuts to walk to the chow hall, or the assignment of someone to help push his wheelchair. For the older offender who breaks prison rules and whose mental capacities are weakening or who has dementia, staff disciplinary responses must be adjusted in recognition of the fact that the inmate is not engaging in willful disobedience. Ensuring older offenders who cannot take care of themselves are treated with respect for their humanity means providing staff or inmate aides who can help change clothes and clean up a cell when there is an “accident” due to incontinence.
Although we did not conduct the investigation that would be necessary to evaluate the extent to which the human rights of older prisoners are respected in any given facility, our research, including visits to 20 prisons, has convinced us that many older prisoners suffer from human rights violations. A significant reduction in the overall prison population, in the number of elderly prisoners, and/or a significant increase in funding are required if prison systems are to be able to house their elderly inmate populations in conditions that respect their rights.
We are also concerned that some elderly inmates are being unnecessarily held in prison despite the fact that their continued incarceration does little to serve the principal purposes of punishment: retribution, incapacitation, deterrence, and rehabilitation. For prisoners who no longer pose a public safety risk because of age and infirmity, and who have already served some portion of their prison sentence, continued incarceration may constitute a violation of their right to a just and proportionate punishment. Alternative forms of punishment should be imposed—for example, conditional release to home confinement under parole supervision—that would serve the legitimate goals of punishment. In our second report on older prisoners, we will examine the policies and procedures that have been enacted to permit the early release of prisoners on medical or compassionate grounds.
The rising tide of older persons in the United States as the “baby boomers” begin to hit age 65 has been called a “silver tsunami.” US corrections systems are also confronting a “silver tsunami” of aging prisoners. But the wave they confront is not the result of uncontrollable natural forces. It is the result of legislation enacted decades ago which is long overdue for reform.
Officials should review their sentencing and release laws and practices to determine which can be adjusted to reduce the elderly prisoner population without risking public safety. Meanwhile, corrections officials should review the conditions of confinement for their elderly prisoners, including the services and programs available to them, and make changes as needed to ensure their human rights are respected.
A burgeoning geriatric prisoner population has important financial, practical, and moral implications for all Americans, not just those incarcerated. The United States should consider whether such a population is something that the country wants or needs. Human Rights Watch believes it is neither.
Recommendations
To State and Federal Governments
- Review sentencing and parole/release policies that drive the burgeoning number of older prisoners to determine what modifications could reduce the population of elderly prisoners without appreciable risk to public safety.
To State and Federal Corrections Officials
- Undertake a comprehensive analysis to determine whether, and to what extent, older prisoners are being provided adequate housing, medical care, and programs that respond to their unique needs and vulnerabilities. Develop comprehensive plans for the current and projected populations of older prisoners based on the needs assessment to protect their fundamental rights.
- Review custody and security rules and their implementation to ascertain which impose unnecessary hardship on older inmates and adopt appropriate modifications to those rules. In conducting the review, consult with older incarcerated men and women directly, through surveys or group meetings.
- Provide training for corrections officers working with older persons, including training in changing physical and mental conditions, and appropriate means of communication.
- Monitor older prisoners to ensure they are not being victimized, and take the potential for victimization into consideration in housing decisions.
- Ensure that a senior official has the specific responsibility for monitoring, assessing, and advocating for improvements in confinement conditions for older prisoners.
Methodology
This report is based in part on research conducted by Human Rights Watch in nine states during 2011. We visited 20 prisons in California, Colorado, Georgia, Mississippi, New York, Ohio, Rhode Island, and Washington, and talked with senior headquarters-based corrections officials as well as prison-based staff ranging from wardens to correctional officers. We also interviewed—mostly but not always in privacy—men and women of various ages who were incarcerated in the facilities we visited. Most, but not all, of the facilities or specific units we visited contained a large percentage of older prisoners. We also visited with senior corrections medical personnel and other state officials in Connecticut. In addition, throughout the year we also consulted with numerous correctional and gerontology experts, as well as conducted extensive research in the academic literature on aging and corrections.
This report also includes statistical data obtained from different sources.
Our data on the number of sentenced state and federal prisoners and the number of prisoners by age was obtained from the US Department of Justice Bureau of Justice Statistics’ “Prisoners Series” for the years 1995 to 2010. Each of the annual reports for those years is available online at the Bureau of Justice Statistics (BJS) website (http://bjs.ojp.usdoj.gov). Using the methodology described in its reports, BJS estimates the number of prisoners in different age categories. Human Rights Watch calculated percentages and trends of state and federal prisoners by age using the BJS data. Unless otherwise indicated, all references to federal and state prisoners by age obtained from BJS reports are sentenced prisoners under the jurisdiction of state and federal correctional authorities. Because of variations in annual state participation in the NCRP program, BJS notes that comparisons of aggregate data from one year to the next should be interpreted with caution. Multiyear trends are more reliable than year to year comparisons.
Our data on the number and age of new court commitments to state prison (almost all of which are admissions into prison of offenders convicted and sentenced by a court, usually to a term of more than one year) from 1995 to 2009 (the most recent year for which such information was available at this writing) was obtained from the annual statistical tables prepared by the Bureau of Justice Statistics as part of its National Corrections Reporting Program Series. The tables are available online (at http://bjs.ojp.usdoj.gov/index.cfm?ty= pbdetail&iid=2174). Human Rights Watch calculated trends over time and percentage increases in new court commitments by age using these tables. See below for a description of the National Corrections Reporting Program.
We obtained data on the age of federal prisoners, their age at entry to prison, and the length of their sentences by accessing information on defendants processed in the federal criminal justice system through the Federal Criminal Case Processing Statistics (FCCPS) of the Bureau of Justice Statistics (available at http://bjs.ojp.usdoj.gov/fjsrc/index.cfm). The FCCPS enables members of the public to generate statistics online, including the construction of tables and trends by frequency and percentage of persons in or entering federal prison in selected years, their age, and sentence lengths. The most recent year for which FCCPS provides data is 2009.
Finally, our report includes a detailed analysis undertaken by Dr. Patrick Vinck, consultant to Human Rights Watch, of the state prison population and admissions data for 2009 compiled under the National Corrections Reporting Program (NCRP) of the United States Department of Justice Bureau of Justice Statistics. The NCRP collects administrative records information on prisoners admitted to prison, released from prison, discharged from parole, or in prison at year-end from participating states. The number of participating states varies by year and by the category of data being provided. Thirty states participating in the NCRP submitted prison admissions data for 2009 and 24 submitted year-end prison population data for 2009, the most recent year for which NCRP data is available.
Dr. Vinck’s analysis was conducted with the software Statistical Package for the Social Sciences (SPSS) under a restricted data use agreement with the Inter-university Consortium for Political and Social Research (distributor of the NCRP data).
Several methodological elements need to be highlighted:
- Age: The NCRP data includes date of birth for each prisoner. We used the date of birth to determine prisoners’ ages as of year-end 2009. We computed the age at admission by comparing the date of admission with the date of birth. When the date of birth or date of admission was incomplete, but the available data clearly indicated that the individual was above or below 55 at admission, the record was categorized accordingly. We were unable to compute the age at admission for 2,742 prisoners (0.52 percent of the total number for whom we had records); we were also unable to compute the age in 2009 of 1,749 individuals (0.2 percent of the total number for whom we had records).
- Offense Categories: For the purpose of the analysis, we categorized offenses in 5 groups according to the offense codes used in the National Corrections Reporting Program. The groups are as follow: (1) violent offense (code 010-180), (2) property offense (190-335), (3) drug offense (340-450), (4) public order offense (460-672), and (5) other/unknown if the offenses were unspecified or missing. In addition, within violent offenses, sexual offenses are distinguished as a sub-category. This includes the following offenses: rape (force), rape (statutory, no force), sexual assault (other), lewd act with children, and forcible sodomy.
- Type of admissions: Persons can be admitted to prison for various reasons. In this report, we include in the category of “new admissions” new court commitments, parole revocations with new sentences, mandatory parole releases with new sentences, and probation revocations with new sentences. We grouped all other admissions, including returns for technical parole violations and admissions where the status of the new sentence was unknown, as “Other Admissions.”
- Limitations: There are a number of limitations associated with the 2009 NCRP data which should be kept in mind. First, we do not know to what extent non-reporting states may differ from reporting states. However, the states reporting in 2009 have three-quarters of all state prisoners and we believe our findings regarding older prisoners based on those states are likely to be representative of state prisoners nationwide. Second, the administrative records include a number of item-specific missing data (for example, gender not recorded, sentence not recorded). For that reason, the number of cases included in each analysis may vary. More generally, the reliability of the data contained in the NCRP database cannot be assessed. The NCRP database is based on a structured questionnaire completed annually on the basis of official prison records of prisoner population movement. After the questionnaires are processed by the Census Bureau, state tallies are sent to state officials for verification and comment. Limitations and information on data processing are provided in the NCRP codebook associated with the data.
I. Older Prisoners
Individual men and women in prison, as in the community, age at different rates and in different ways. In prison, there are prisoners who, at 75 years old, are more active, independent, and healthy than some who are much younger but who struggle with even the simplest of activities because of the burdens of disease and impairment. For purposes of analysis and planning for the current and future needs of their prison populations, however, most corrections systems have set a specific chronological age to serve as a proxy for the physical and mental changes and conditions that correlate with aging. Their definitions of “older” inmates range from 50 years of age (used by 15 states) to 70 years (used by 1).[2]
In the community, age 50 or 55 would not be considered “older.” But incarcerated men and women typically have physiological and mental health conditions that are associated with people at least a decade older in the community. This accelerated aging process is likely due to the high burden of disease common in people from poor backgrounds who comprise the majority of the prison population, coupled with unhealthy lifestyles prior to and during incarceration. These factors are often further exacerbated by substandard medical care either before or during incarceration.[3] The violence, anxiety, and stress of prison life, isolation from family and friends, and the possibility of spending most or all of the rest of one’s life behind bars can also contribute to accelerated aging once incarcerated.
How Many Older Prisoners?
Whatever the age cutoff used, there is no question that there has been a remarkable growth in the absolute number and proportion of older prisoners in the US prison population.[4]
National Data
Perhaps the most dramatic indication of the surging number of older prisoners comes from data on the number of state and federal prisoners who are age 65 or older. In 2007 there were 16,100; by 2010 there were 26,200, an increase of 63 percent. Yet during that same time period, the total number of prisoners grew by 0.7 percent.[5]
Figure 1: Growth in State and Federal Prison Population, by Age, 2007-2010
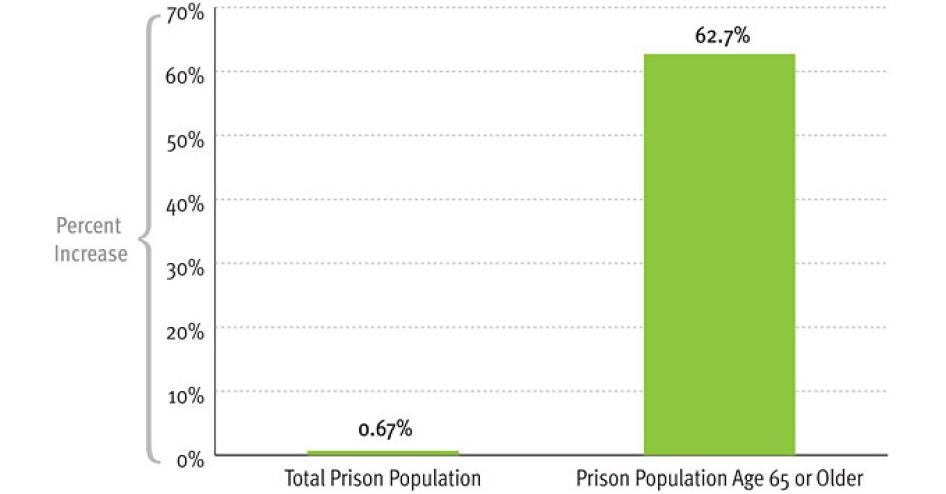
Source: Bureau of Justice Statistics, Prisoner Series, 2007 to 2010. Note: Based on number of sentenced prisoners under jurisdiction of federal and state correctional authorities with sentences of more than one year and estimates for the number of sentenced prisoners by age.
In the last fifteen years, the number of men and women age 55 years or older in US prisons has grown markedly, and at an increasingly rapid pace.[6] In 1995, there were 32,600.[7] By 2010, there were 124,400.[8]
Table 1: Sentenced State and Federal Prisoners by Age, 1995- 2010 [9]
|
Year |
Total |
Percent Change in Total |
Age 55 or older |
Percent Change in 55 or older |
|
1995 |
1,085,369 |
— |
32,600 |
— |
|
1996 |
1,138,984 |
4.9% |
n/a |
n/a |
|
1997 |
1,195,498 |
5.0% |
41,070 |
n/a |
|
1998 |
1,245,402 |
4.2% |
42,966 |
4.6% |
|
1999 |
1,304,074 |
4.7% |
43,300 |
0.8% |
|
2000 |
1,329,367 |
1.9% |
44,200 |
2.1% |
|
2001 |
1,345,217 |
1.2% |
40,200 |
-9.0% |
|
2002 |
1,380,516 |
2.6% |
40,800 |
1.5% |
|
2003 |
1,408,361 |
2.0% |
60,300 |
47.8% |
|
2004 |
1,433,728 |
1.8% |
69,900 |
15.9% |
|
2005 |
1,462,866 |
2.0% |
66,500 |
-4.9% |
|
2006 |
1,504,660 |
2.9% |
80,200 |
20.6% |
|
2007 |
1,532,850 |
1.9% |
76,600 |
-4.5% |
|
2008 |
1,547,742 |
1.0% |
77,800 |
1.6% |
|
2009 |
1,550,196 |
0.2% |
79,100 |
1.7% |
|
2010 |
1,543,206 |
-0.5% |
124,400 |
57.3% |
Source: Bureau of Justice Statistics, Prisoner Series, 1995 - 2010. Note: Based on number of sentenced prisoners under jurisdiction of federal and state correctional authorities with sentences of more than one year and estimates for the number of sentenced prisoners by age.
The number of prisoners age 55 or older grew at a much faster rate than the total prison population, growing by 282 percent compared to a 42.1 percent increase in the prison population.[10]
Figure2: Growth in State and Federal Prison Population, by Age, 1995-2010
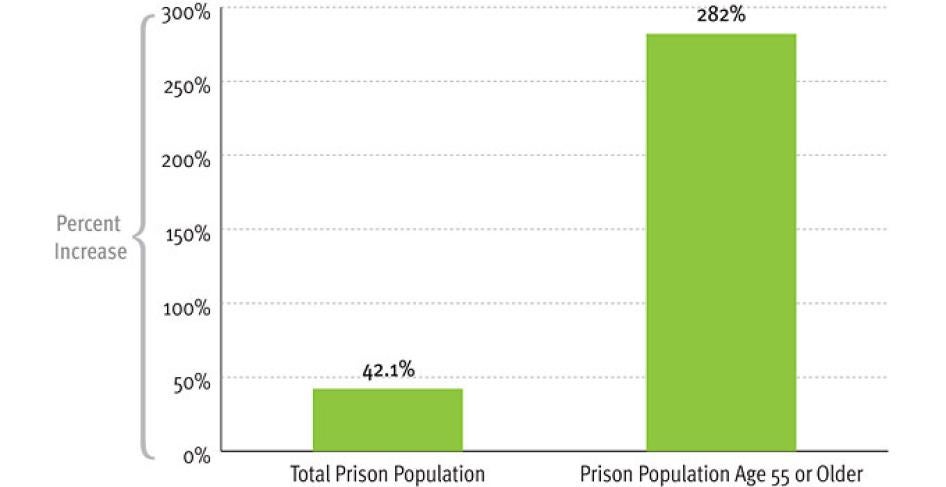
Source: Bureau of Justice Statistics, Prisoner Series, 1995-2010. Note: Based on number of sentenced prisoners under jurisdiction of federal and state correctional authorities with sentences of more than one year and estimates for the number of sentenced prisoners by age.
The proportion of prisoners 55 years or older in the prison population has also soared. In 2010, 8 percent of state and federal prisoners were age 55 or older, whereas in 2000, they had accounted for 3 percent of the total.[11]
The number of older prisoners is growing faster than the number of older persons in the US population, as is evident from the growth in incarceration rates relative to population. For example, between 2007 and 2010, the rate of incarceration for men age 65 and over increased from 95 per 100,000 male US residents of that age to 142 per 100,000.
Indeed, the 2010 rate of incarceration of men 65 and over in the United States exceeds the total rate of incarceration in most countries.[12]
The demographics of older state prisoners differ somewhat from those of the total state population, with greater percentages of men and greater percentages of whites. There were about 21 times more men age 55 and older than women of that age in prisons among the states who reported prison population data to the National Corrections Reporting Program (NCRP) for 2009, although in the total state prison population in 2010 men outnumbered women by 13 to 1.[13] With regard to race, whites accounted for 53.7 percent of prisoners 55 or older and blacks 39.1 percent among the NCRP reporting states in 2009, although in the 2010 total prison population blacks accounted for a greater percentage than whites, 42.7 percent to 38.9 percent.[14]
State by State Data
States vary considerably in the relative size of their population of older inmates. Among states reporting year-end prison population data to the National Corrections Reporting Program, the proportion of prisoners age 55 years or over ranged from 4.2 percent to 9.9 percent, with the highest proportions found in Oregon (9.9 percent), 2 percentage points above the second highest rate (7.9 percent in Pennsylvania). The lowest rate (4.2 percent) was found in Connecticut, followed by North Dakota (5.0 percent).[15]
More detailed data from several states exemplifies the dramatic growth in older prisoners that states have experienced in the last decades:
- In California, the percentage of inmates 55 or older increased by over 500 percent between 1990 and 2009; in comparison, the growth of the total inmate population over the same period was about 85 percent. In June 1990, the population age 55 or older was 2.1 percent of the prison population. As of June 2009 it made up 7.1 percent and is projected to increase to 15 percent by 2019.[16]
- In New York, the proportion of inmates age 55 or older increased more than threefold in 15 years, from 2.3 percent of all inmates in 1995 to 7.2 percent in 2010.[17]
Some states define older prisoners as those age 50 or older.
- In Colorado, inmates age 50 years or older increased by 720 percent between 1991 and 2009, compared to the total inmate population growth of 208 percent in those years.[18]
- In Florida, the prison population age 50 or over increased from 8.6 percent of all inmates in fiscal year 2000/2001 to 16.0 percent in fiscal year 2009/2010.[19]
- In Georgia, the population age 50 or over increased from 10 percent of all inmates in 1990 to 16 percent in 2011.[20]
- In Missouri, the percentage of prisoners age 50 or over doubled in the past ten years, rising to 15.3 percent of all inmates in fiscal year 2010.[21]
- In Ohio, inmates age 50 or over grew from 9.5 percent of the total prison population in 2001 to 14.5 percent in 2010.[22] Between 1997 and 2010, the number of prisoners age 50 or over increased by 126.2 percent.[23]
- In the 16 states that are part of the Southern Legislative Conference, the population of older inmates (as defined by each state) grew by 136 percent between 1997 and 2006, and increased from 5.6 to 10.5 percent of the total prison population. Louisiana had the highest increase in elderly inmates over that period, 199 percent, and Oklahoma had the lowest increase, 85.4 percent; but even in Oklahoma, the growth rate for older inmates was still four times that of the total inmate population.[24]
- In Virginia, 12.2 percent of the prison population in 2008 was age 50 or over, reflecting a six-fold increase since 1990.[25]
II. Why the Aging Prison Population?
As of June 30, 2010 the oldest male inmate in Florida was 90 and was admitted to the Department of Corrections aged 82 with a 15-year sentence. The oldest female inmate was 91 and was admitted at age 87 to serve a 31-year sentence. The ages of the ten oldest male inmates range from 86 to 90 … seven of the ten are serving a sentence of 50 years or more…. The ages of the ten oldest female inmates range from 76 to 91; the average age is 79.2 and three of the ten are serving a sentence of 50 years or more.
—State of Florida Correctional Medical Authority, “2009-2010 Annual Report and Report on Aging Inmates”
The extraordinary size of the US jail and prison population—almost 2.3 million, the world’s largest[26]—reflects the inevitable consequences of more than three decades of “tough on crime” policies. State and federal legislators adopted laws that increased the likelihood and length of prison sentences, including by establishing mandatory minimum sentences and three strikes laws, and by increasing the number of crimes punished with life and life-without-parole sentences. In addition to these “front end” policy changes, the legislators sought to increase the amount of time prisoners would serve in prison before release, for example by establishing truth-in-sentencing conditions that require 85 percent or more of a prison sentence be served before the inmate becomes eligible for release, and by making some crimes ineligible for parole.[27] Harsh parole revocation policies were also adopted that returned high percentages of released offenders to prison for technical parole violations.
|
Samuel Edison, 53 years old, was 35 when imprisoned in Colorado for aggravated robbery. If he has to serve his full 50 year sentence, he will be 85 when released.[28] |
Sheldon Thompson entered prison in Michigan in 1962 with a life without parole sentence, after conviction for a homicide crime he committed when he was 17 years old. He is currently 67 years old, and will die in prison.[29]
These sentencing and release policies help explain why the US prison population has grown six-fold since 1980, despite declining crime rates. They also help explain the rapidly growing number and proportion of older prisoners. Although we cannot pinpoint the precise contribution of different factors to the aging prison population,[30] several factors are clearly involved:
- Long sentences. Prisoners with long sentences are more likely to grow old behind bars than prisoners serving short sentences. A significant percentage of prisoners age 55 or older were incarcerated with long sentences.
- Life sentences. The imposition of life sentences, a particularly extreme form of long sentence, has increased.
- Older age of offenders. More people are entering prison for crimes committed after age 55 than in years past.
- Early release. Correctional and parole officials often have little legal authority to release old and infirm prisoners before their sentence expires and such authority as exists is exercised infrequently. This will be the subject of a separate Human Rights Watch investigation and will not be covered further in this report.
Longer Time in Prison, Especially for Violent Crimes
One reason for the growth in the elderly inmate population is the long time served in prison by a growing number of prisoners, reflecting both lengthy sentences imposed for a large variety of crimes in recent decades and diminished opportunities for release prior to expiration of the sentence.
A considerable number of older prisoners entered in their younger years and have aged behind bars, as shown in Table 2. For example, 15.2 percent of prisoners who were between the ages of 61 to 70 in 2009 had entered prison at or under the age of 40. Of those who were between the ages of 71 and 80, 17.8 percent had entered at or under the age of 50.
Table 2: Age at Admission and Current Age among State Prisoners, 2009
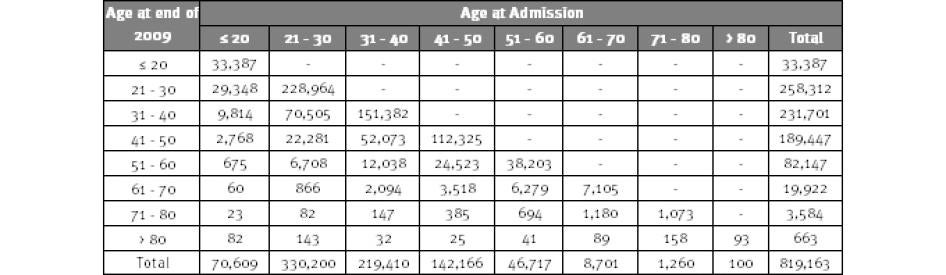
Source: National Corrections Reporting Program. Note: Based on 24 states providing year-end prison population data for 2009. Age at admission based on admission with new sentences; prisoners returned from parole because of technical parole violations are not included.
The long sentences some prisoners are serving are shown in Table 3. Among state prisoners in 2009, 13.5 percent were serving sentences between 10 and 20 years long, another 11.2 percent were serving sentences longer than 20 years, and 9.6 percent were serving some form of a life sentence.[31] Among prisoners who were age 51 or older, 40.6 percent were serving sentences of more than 20 years or life sentences. As prisoners with long sentences “stack up” in the prison population, it is not surprising that the number of older prisoners is growing and that older prisoners are more likely to be serving longer sentences than younger prisoners. As we see in Table 3, 20 percent of prisoners between the ages of 61 and 70 are serving sentences of more than 20 years (not including life sentences), compared to 11.4 percent of prisoners age 31 to 40.
Table 3: State Prisoners by Age and Sentence, 2009
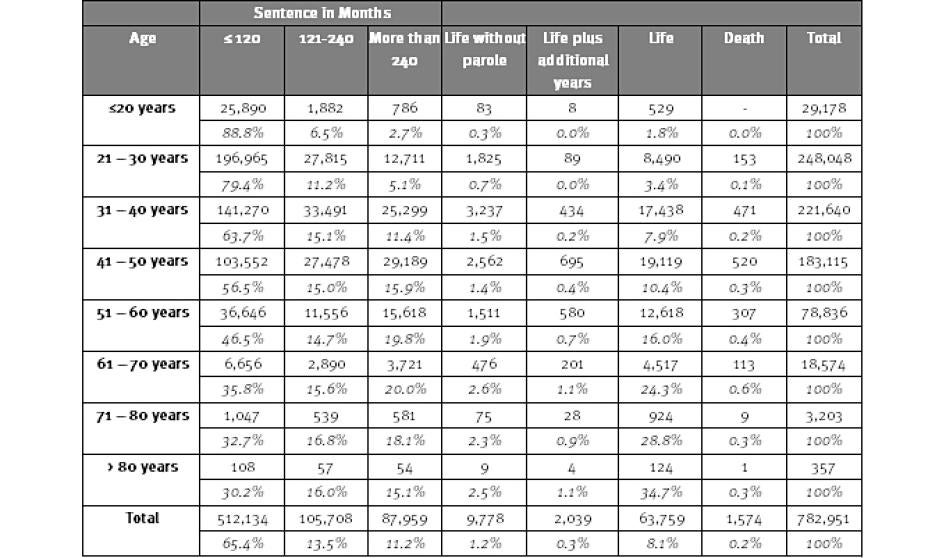
Source: National Corrections Reporting Program. Note: Based on 24 states reporting year-end prison population data for 2009.
We can further appreciate why the number of aging prisoners is growing by looking at the ages of men and women entering prison with new sentences and the length of those sentences. As shown in Table 4, among state prisoners in 2009, 17 percent (7,929) who entered prison when they were age 51 or older have sentences ranging from more than 20 years to life.[32] Of those who entered when they were between the ages of 41 and 50 years, 18.1 percent (21,148) have sentences ranging from longer than 20 years to life. It is safe to assume many of those prisoners will be well into their seventies and older before they are released, if they are released at all.[33]
Table 4: State Prisoners by Age at Admission and Sentence, 2009
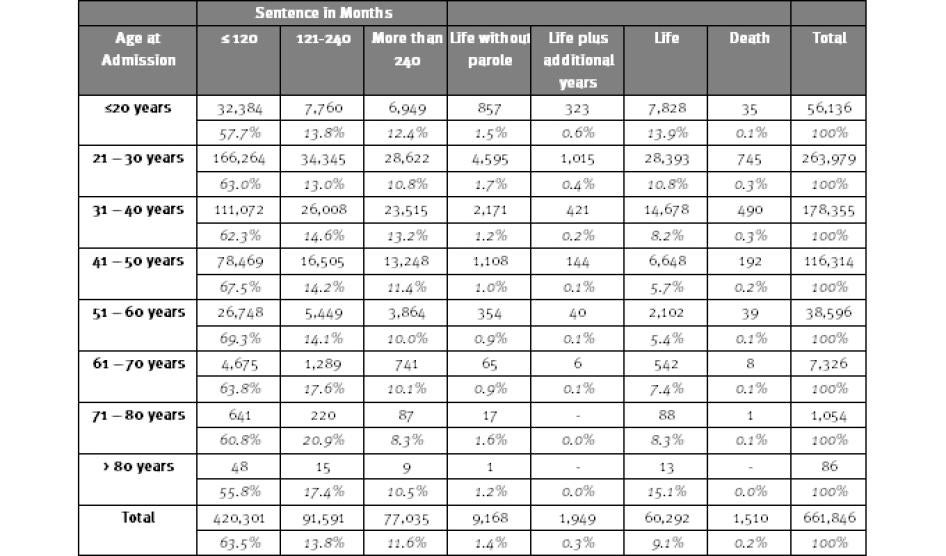
Source: National Corrections Reporting Program. Note: Based on 24 reporting states reporting year-end prison population data for 2009. Numbers based on admissions with new sentences and do not include returns to prison for technical parole violations.
Prison sentences tend to be longest for persons convicted of violent offenses, and many older prisoners were convicted of such crimes (see subsection below). But mandatory minimum sentences for nonviolent offenders can also lead to long prison terms that will increase the aging prison population. For example, Weldon Angelos was sentenced at age 25 to 55 years in federal prison for selling marijuana, money laundering, and possession of a firearm in furtherance of a drug trafficking crime.[34] Barbara Scrivner was 29 when she was sentenced to 30 years in prison for her role as a minor participant in a methamphetamine manufacturing and distribution conspiracy.[35]
Sentences which run consecutively can also add up to lengthy prison stays that will carry the individual into his later years. Atiba Parker, for example, was convicted in Mississippi of two counts of sale of cocaine and one count of possession of cocaine when he was 29. He received a total of three sentences that run consecutively for a total of 42 years. Twenty-nine when he was sentenced, his projected release date is 2048, when he will be 71.[36]
“Three strikes” and other habitual offender laws that create lengthy mandatory sentences for repeat offenders convicted of nonviolent as well as violent offenses also contribute to the number of aging men and women behind bars.[37] In California, the average third-strike offender enters prison at age 36, with a minimum of 25 years to serve before the possibility of release.[38] According to an advocacy group seeking reform of California’s three strikes law, there are approximately 4,431 third-strikers who have received at least 25-years-to-life for nonviolent offenses.[39] Leandro Andrade is one. At 37 he was convicted of stealing $150 worth of videotapes from two different stores. These convictions counted as his “third” strike and he received a sentence of two consecutive 25-years-to-life sentences. The earliest he can be released will be when he is 87 years old.[40]
Sometimes sentences are technically for a term of years, but in practice they will amount to life sentences. For example, Bonnie Frampton, now 76, entered prison when she was 65. Convicted of conspiracy for murder, she has a 120-year sentence.[41] Constance Wooster, age 61, was convicted of child abuse resulting in death. She entered prison when she was 53 with a 48-year sentence.[42]
Sentences for Violent Crimes
Persons convicted of violent crimes, including violent sex offenses, typically receive the longest prison sentences and for that reason they “stack up” in the prison population, compared to persons serving short sentences. They are thus more likely to be growing older behind bars, fueling the aging prison population.
As shown in Table 5, half of all state prisoners at year-end 2009 had been convicted of violent crimes. A higher percentage of prisoners age 55 and older (65.3 percent) were serving sentences for violent crimes than younger offenders (49.6 percent), reflecting the stacking phenomenon.
Table 5: State Prisoners by Offense and Age, 2009
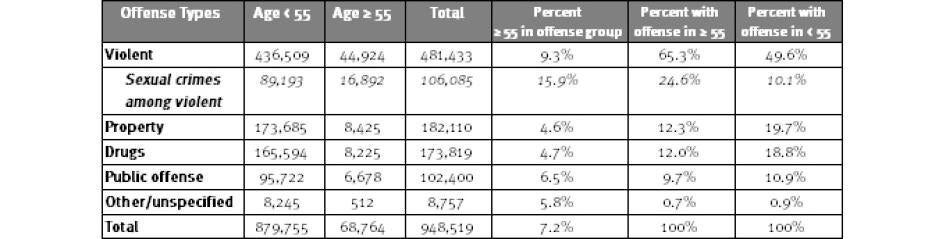
Source: National Corrections Reporting Program. Note: Based on 24 states reporting year-end prison population data for 2009.
The number of men and women who are already 55 years or older when entering prison for violent crimes also augurs continued growth in the number of older prisoners. As shown in Table 6, about one-quarter (26 percent) of persons entering state prison with new sentences in 2009 had been convicted of violent crimes, including 25.8 percent of those entering at age 55 or older.
Table 6: New Admissions to State Prison by Offense and Age, 2009
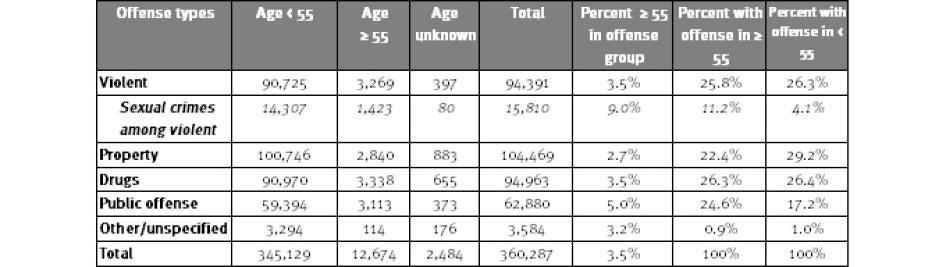
Source: National Corrections Reporting Program. Note: Based on data from 30 states reporting prison admissions for 2009. Numbers based on admissions with new sentences and do not include returns to prison for technical parole violations.
|
Ted Coombs, age 66, entered prison in Washington state when he was 56, convicted of attempted second degree murder. He had been a postman all his life and this is his first time in prison. His sentence runs until 2020, when he will be 75. His spinal cord was severed from a bullet that was shot during the incident that led to his conviction; he is paralyzed below the chest and uses a wheelchair. [43] |
Persons convicted of violent crimes on average spend the longest time in prison both because they receive longer sentences and because they serve a greater portion of their sentence before being released. For example, in 2009, the average maximum sentence for state offenders for all offenses was 60 months, and the average time served before release for all offenses was 29 months; that is, the time served was less than half the maximum sentence.[44] But for murder the average maximum sentence was 232 months and average time served before release was 172 months; the time served was nearly three-quarters of the maximum sentence.[45]
It is notable, too, that the percentage of sentences state inmates convicted of violent offenses serve before release has increased markedly since the 1990s. In 1993 they served an average of 40 percent of the maximum sentence; by 2009 they served an average of 61.7 percent.[46]
More detailed data from individual states also illuminates the number of older prisoners serving lengthy sentences, including for violent offenses:
- In New York, 28 percent of those currently age 60 or over have been in prison continuously for 20 or more years. Among inmates in that age group, 7.1 percent have between 10 and 19 more years to serve before the earliest possible release date and 5.2 percent have 20 or more years to serve. There are 22 prisoners who are currently 70 years or older who have 20 or more years to serve before their earliest possible release date. That is, they will be at least 90 years old before being eligible for release. Of the inmates age 60 or over, 77 percent are incarcerated for violent felonies, compared to 62 percent for inmates under 60.[47]
- In Pennsylvania, an analysis of prisoners in 2002 revealed that those 50 or over were far more likely than younger inmates to have been sent to prison for rape and murder; these crimes account for 36.6 percent of the elderly inmate population but only 13.1 percent of the younger inmate population. Not surprisingly, the older inmates are serving longer sentences on average: 66 percent of older inmates were serving a maximum sentence of 10 years or more while 58 percent of younger inmates were serving maximum sentences of less than 10 years. Twenty-one percent of older inmates were serving life sentences, compared to only 8.2 percent of younger inmates.[48]
- In North Carolina, approximately 56 percent of the inmates age 50 or older are serving sentences for violent or sex crimes. Sixty-two percent of those age 50 or older are serving sentences of 10 years or longer and 28 percent are serving life sentences.[49]
- Among the 16 states in the Southern Legislative Conference, all but one reported that at least 25 percent of their elderly inmates had been convicted of “violent or sex-based crimes.”[50] At least 30 percent of the elderly inmates in each of the states are serving sentences of at least 20 years or more, including life sentences.[51]
Life Sentences
We’re stuck with people who aren’t going to get out.
—Senior official, Colorado Department of Corrections, March 22, 2011
Life sentences are a particularly extreme form of long sentence that almost by definition can carry prisoners into old age, if not beyond. Since the 1980s, the use of life sentences, including life with no possibility of release (life without parole)[52] has increased markedly.
According to The Sentencing Project, the number of offenders serving life sentences in state prisons quadrupled between 1984 and 2008, increasing from 34,000 to 140,610.[53] In the federal system, the growth in the number of prisoners with life sentences grew even more markedly. From 410 federal lifers in 1998, the number grew to 4,222 in 2009, a ten-fold increase.[54]
Barring changes in patterns of parole release and grants of clemency, many of those serving life sentences in state prisons will grow old and die in prison. Those serving life without parole will certainly do so. As shown above in Table 3, 75,576 men and women—almost one in ten (9.6 percent) of the state prison population in 2009—were serving some form of a life sentence.[55] Of these sentences, 63,759 were life sentences and 11,817 were life without parole or life plus additional years (which is the functional equivalent of life without parole). In some states the proportion of prisoners with life sentences is far greater: in Alabama, California, Massachusetts, Nevada, and New York, at least one in six prison inmates is serving a life sentence.[56] Among persons entering state prison in 2009 with new sentences, 3,471 had some form of a life sentence.[57]
For lifers who have the possibility of release, the amount of time that must be served before becoming eligible for release varies by jurisdiction. Nationally, however, the median is 25 years.[58] Eligibility for release is not the same as actual release; many years may intervene between the two and, in some cases, the lifer will never be released. Lifers entering prison in 1997 could expect to serve an average of 29 years before release, time during which they could age considerably.[59] Serving decades in prison can carry a person from middle age to old age. For example, as shown in Table 4 above, 2,102 state prisoners in 2009 were between the ages of 51 and 60 when they entered prison with life sentences (not including life without parole or life plus additional years). They thus entered prison with a slim likelihood that they would be released before their late seventies or eighties.[60]
Regardless of theoretical eligibility, it can be difficult as a practical matter for persons serving a life sentence to be released on parole.[61] Parole boards and governors are heavily influenced by public opinion and the desire to avoid a political backlash from the release of someone convicted, for example, of a notorious violent crime.[62]Parole boards may require violent offenders to remain in prison for years past their parole eligibility date, no matter how remorseful or rehabilitated they are or how impeccable their prison record. In some cases, parole boards will simply never agree to parole, and if they do, their decision may be reversed by the governor.[63]
Although most persons in prison serving life have the possibility of release, a significant number have been sentenced to life without parole (LWOP). As can be seen from data in Table 3 above, as of 2009 at least 11,817 state prisoners were serving sentences of life without parole or life plus additional years; that is, they have been sentenced to life behind bars until they die.[64] They will be spending many years in prison as they pass from youth and middle age to old age, and eventually death.
The frequency of life without parole varies markedly among states:
In Louisiana, a state in which all life sentences lack the possibility of parole, one of every nine (10.9 percent) people in prison is serving an LWOP sentence. Pennsylvania, another LWOP-only state, incarcerates 9.4 percent of its prison population for the rest of their lives. Nationally, there are nine states in which more than 5 percent of persons in prison are serving an LWOP sentence. On the other end of the spectrum, 15 states incarcerate less than 1 percent of person in prison for LWOP.[65]
|
Leonard Hudson entered prison in New York in 2002 at age 68 convicted of murder. He received a 20-years-to-life sentence, which means he will be 88 before he is eligible to be considered for release. He is currently housed in a special prison unit for incarcerated men with dementia and other severe cognitive impairments.[66] William Conrad, 80 years old, entered prison In Mississippi when he was 73 with a life sentence for murder.[67] |
As of 2009, there were 4,222 federal prisoners serving life sentences. Because the federal system does not have parole, federal prisoners with life sentences have no prospect of release in their lifetime.
Among persons serving life without the possibility of parole in the United States are persons sentenced for crimes committed before the age of 18. Human Rights Watch estimates that there are approximately 2,600 of these youth offenders in the United States who will spend the rest of their lives in prison.[68]
Entering Prison at an Older Age
The number of older persons who are arrested has been increasing, perhaps as a natural concomitant of the overall aging of the US population.[69] The increasing number of older arrestees has translated into an increasing number of men and women entering prison as new court commitments at age 55 and older.[70] Persons 55 years of age or older still constitute a small percentage of new court commitments—3.5 percent in 2009—but because a significant proportion come in with long sentences they may have a marked impact on the aging prison population.
As shown in Table 7, the number of persons entering state prison as new court commitments at the age of 55 years or older grew 109 percent between 1995 and 2009. In the same period, the number of all new commitments increased by 9.7 percent. The variations between individual years are significant and suggest caution in interpreting the data, but the overall trend is nonetheless clear. [71]
Table 7: New Court Commitments to State Prison by Age, 1995-2009
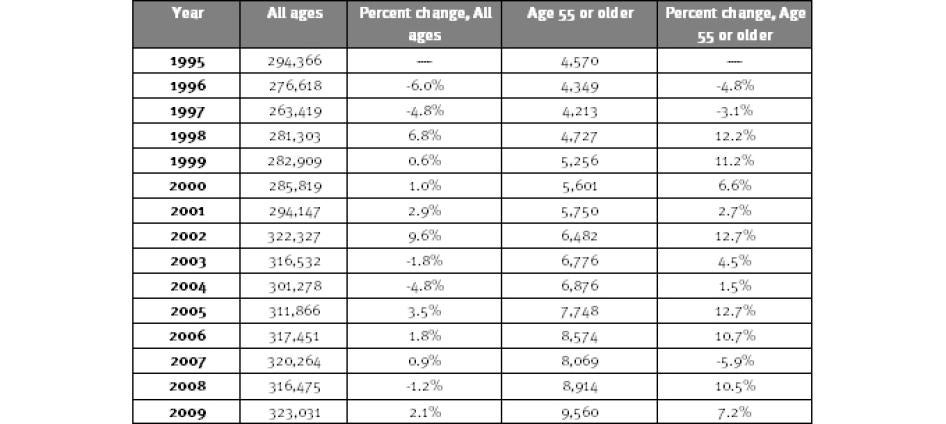
Source: Bureau of Justice Statistics, annual tables from National Corrections Reporting Program Series, 1995-2009
Data from individual states further illustrates the growing proportion of inmates entering prison for crimes committed at age 50 or above:
- In Florida, the proportion of new prison admissions who were age 50 or over rose from 4.7 percent in fiscal year 2000/2001 to 9.3 percent in fiscal year 2009/10.[72]
- In Missouri, prison admissions of offenders age 50 or over increased 214 percent between 1999 and 2009.[73]
- In New York, the proportion of offenders age 55 or older among new court commitments increased from 1.3 percent in 1996 to 3.3 percent in 2010.[74]
- In Ohio, in 2010, 1,815 men and women age 50 or over entered prison (including 41 who were 70 or over); in 2000 the number was only 743. The proportion of new court commitments who were 50 years of age or older increased from 3.7 percent in 2000 to 7.8 percent in 2010.[75]
- In Virginia, offenders 50 or over accounted for 7.8 percent of new court commitments in 2007, rising from 3.6 percent in 1990.[76]
Figure 3: Growth in New Court Commitments to State Prison, by Age, 1995-2009
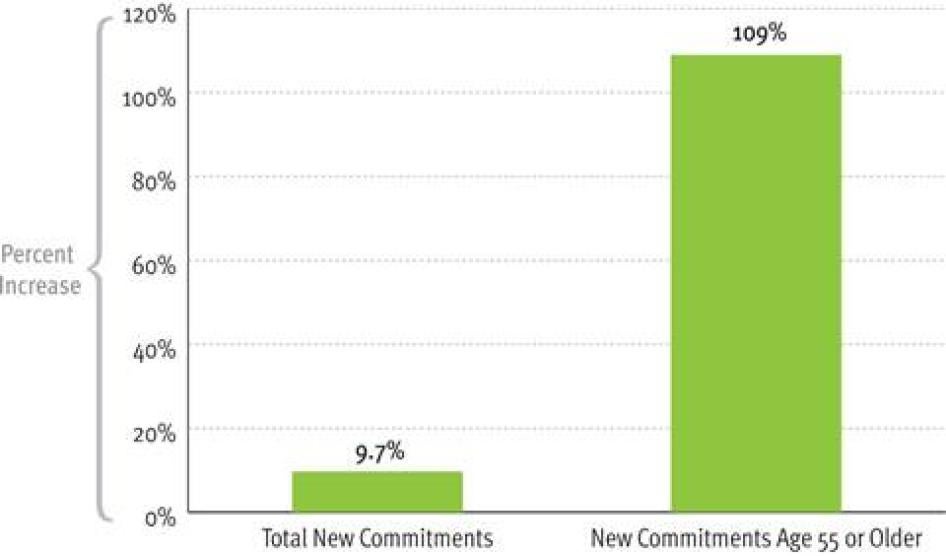
Source: Bureau of Justice Statistics, annual tables from National Corrections Reporting Program, 1995-2009
Federal Prisoners
Like state prisoners, federal prisoners are “graying.”[77] As shown in Table 8, 25,160 federal prisoners—13.6 percent of the federal prison population—at year-end in 2009 consisted of men and women age 51 and older.[78]
The number of older federal prisoners is growing at a faster rate than the total federal prison population. Table 8 shows that between 2000 and 2009, the number of prisoners age 51 and older grew from 14,275 to 25,160, a 76 percent increase. In contrast, during those years the total federal prison population grew from 129,329 to 185,273, an increase of 43.3 percent.[79]
The number of federal prisoners already in their sixties and above when they enter prison has also been increasing at a faster rate than total admissions. Between 2000 and 2009, the annual number of persons entering federal prison at age 61 or over grew by 50 percent, although the total number of new admissions in that period increased by only 14.5 percent.[80]
Table 8: Federal Prisoners by Age, 2000 to 2009
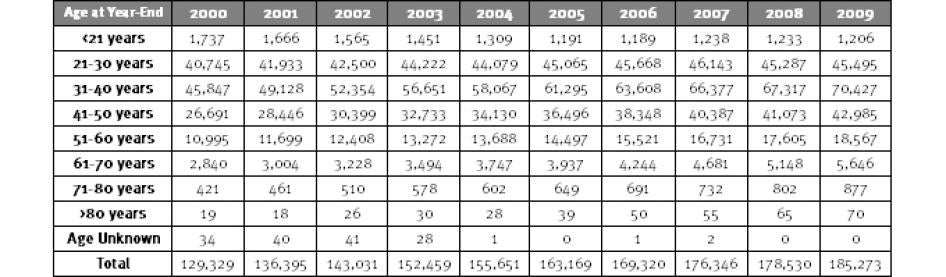
Source: Bureau of Justice Statistics, Federal Justice Statistics Program. Note: Based on year-end numbers. Includes only prisoners committed to federal prison for violations of federal criminal law; commitments from the District of Columbia Superior Court are excluded.
Table 9: Admissions to Federal Prison by Age at Admission and Sentence, 2009
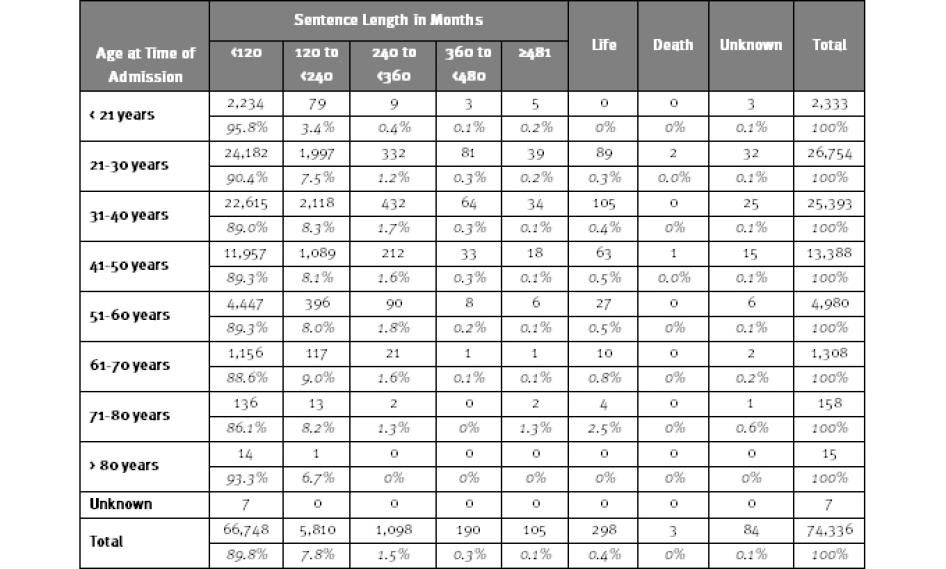
Source: Bureau of Justice Statistics, Federal Justice Statistics Program. Note: Includes only prisoners committed to federal prison in 2009 for violations of federal criminal law; commitments from the District of Columbia Superior Court are excluded.
The long sentences being served by many federal prisoners suggest the number of older federal prisoners will continue growing. Among federal prisoners in 2009, 7,771 are serving sentences ranging from 30 years to life. Another 12,612 have sentences of 20 to 30 years.[81]
The age and sentence lengths of new federal prisoners also illuminates why the federal prison population will continue to age. As shown in Table 9, although the preponderance (89.8 percent) of federal prisoners who entered prison in 2009 had sentences of 10 years or less, 7,203 of the entering prisoners (26.6 percent) had sentences ranging from 10 years to over 40 years and 298 entered with life sentences.[82] Among those who entered federal prison at age 51 or older, 658 (10.3 percent) had sentences ranging from 10 years to over 40 years, not including life sentences. Obviously, many of them will grow much older before released, if they do not die in prison. Others entered federal prison in 2009 before they had reached the age of 50, but because of the length of their sentences will also not leave prison until their sixties, seventies, or beyond.
The federal system eliminated parole in 1987. As noted above, all of the 4,222 federal prisoners with life sentences in 2009 can be expected to age and eventually die in prison.
III. Conditions of Confinement
In general, the older people are, the more barriers they have to an active, independent life, the greater their physical and mental health needs, and the harder it is for them to live and function with dignity. The difficulties can be even greater for those elderly who are in prison. Prisons are primarily designed for the young and able-bodied; it takes additional effort on the part of corrections officials to meet the needs and respect the rights of the old and infirm.
Older prisoners, like all prisoners, have the right to be treated with respect for their humanity and inherent human dignity; to not be subjected to torture or other cruel, inhuman, or degrading treatment or punishment; to receive appropriate medical and mental healthcare; to have reasonable accommodation for their disabilities; and to be provided activities and programs to support their rehabilitation.[83]
While age does not change the rights of people who are incarcerated, it may change what prison officials must do to ensure those rights are respected in particular cases. More precisely, it is not so much age in the abstract that determines how officials should treat individual prisoners, but their physical and mental conditions. A certain decline in general physical and mental capabilities is highly correlated with advancing years. There is also considerable overlap between persons who are aging and those who are chronically, seriously, or terminally ill or incapacitated. As persons age, they are at increasing risk of developing various illnesses and disabilities (see discussion below in Chapter IV).[84] Officials confronting an aging and frail inmate, or one who is old and riddled with disease, cannot treat him the same as they would a healthy 25-year-old.
During our visits to state prison systems, corrections personnel—including high-ranking central office staff, wardens, corrections officers, doctors, and nurses—insisted they were committed to ensuring the older men and women in their charge received the care and treatment they needed, albeit within the limitation of what is possible and permissible in prison. While this report does not evaluate the extent to which the human rights of older prisoners were respected in any given facility, there is no doubt that many older prisoners suffer from violations of their rights. Our conversations with corrections professionals, advocates, and prison experts nationwide leads us to believe the problems in the states we visited are replicated to a greater or lesser degree throughout the country. Limited resources, resistance to changing longstanding rules and policies, lack of support from elected officials, as well as insufficient internal attention to the unique needs and vulnerabilities of older prisoners, all lead to inadequate protection for the rights of the elderly.
As prison professionals themselves acknowledged to Human Rights Watch, individual incidents of neglect, mistreatment, and even cavalier disregard for the well-being of aging and vulnerable inmates occur. Prisons can also be plagued by systemic problems that leave the elderly—and younger prisoners as well —suffering acutely.[85]
US prisons are usually overcrowded warehouses that are hard places to live in, regardless of age.[86] Those who are older in prison, like their younger counterparts, must cope with the lack of privacy, extensive and intrusive controls over every aspect of life, severe limitations on connections with family and community, the paucity of opportunities for education, meaningful work, or other productive, purposeful programs or activities, and threats of violence and exploitation. They have to cope with correctional and even medical staff who not infrequently view them with animosity, anger, and distaste because they are “felons,” attitudes which can influence how such staff exercise their responsibilities.[87] They have to cope with medical staff and treatment facilities that may be insufficient in quantity and inadequate in quality. As corrections medical expert Dr. Robert Greifinger explained to Human Rights Watch, “The quality of medical care and disability accommodation in U.S. prisons varies considerably. Young and old alike suffer from poor quality care just as they benefit similarly from higher quality care.”[88] Older inmates, like younger inmates, struggle to maintain their self-respect and emotional equilibrium in this difficult environment while also confronting the physical, emotional, social, and spiritual challenges that accompany aging.
Older prisoners, even if they are not suffering illness, can find the ordinary rigors of prison particularly difficult because of a general decline in physical and often mental functioning which affects how they live in their environments and what they need to be healthy, safe, and have a sense of well-being. In addition to the memory loss and other ordinary cognitive impairments that can come with aging, older prisoners sooner or later will develop:
[D]ecreased sensory acuity, muscle mass loss, intolerance of adverse environmental conditions, dietary intolerance and general vulnerability [which] precipitate collateral emotional and mental health problems.[89]
As a senior official with the California Prison Health Care Services explained to Human Rights Watch:
Age by itself is not the same as disability, but the end result of an accumulation of diseases and injuries, causing decreased ability to safely interact with our surroundings. In elders, hearing, vision and balance progressively decrease; foot speed slows; and muscle loss occurs. All of which make climbing up stairs or into upper bunks difficult if not dangerous.[90]
Older persons are more likely to develop disabilities that require the use of assistive devices such as glasses, hearing aids, wheelchairs, walkers, and canes. As in the community, the elderly in prison suffer from falls, which contribute to hip fractures and high health costs. One California study found that 51 percent of geriatric women prisoners age 55 or over reported a fall in the past year.[91] In the community, falls are associated with poor lighting, uneven or icy pavement, loose rugs, and lack of handrails. In prison, there are additional potential hazards, including top bunk assignments and crowds of quickly moving young inmates oblivious to the slower, more fragile older inmates among them.[92]
For someone who is old and frail or infirm, the right to safe conditions of confinement means not being required to live in a dorm with younger persons prone to violence and extortion and not being required to sleep on a top bunk. The right to decent conditions of confinement means older persons should be given extra blankets and clothing in the winter because it is harder for them to stay warm and they should not have to stand outside in harsh weather waiting to receive medication. They may need more time to eat. Inmates have a right to activities to promote rehabilitation, and older incarcerated persons should be provided age-appropriate educational, recreational, and vocational opportunities. For the prisoner whose mental capacities are weakening or who may have dementia, disciplinary procedures should be adjusted to reflect the diminished culpability. Ensuring an older offender who cannot care for himself is treated with respect for his humanity means ensuring the availability of staff or inmate aides who can help him change his clothes and clean up his cell when he has had an “accident” and soils himself.
Geriatric incontinence puts unique demands on older prisoners. It puts them at risk of social isolation, depression, diminished independence, and even harassment and physical confrontations from inmates offended when an older person urinates or defecates in her clothes.[93]Prison bathrooms typically lack privacy; individuals who need to change their soiled clothes or diapers must endure the humiliation of doing so in public. Preserving dignity in this context is difficult.
Mobility impairments are common in older populations, and they are particularly problematic in the prison context. Even when provided canes, walkers, and wheelchairs, many of the elderly confront facilities that were not designed with the structural or programmatic needs of mobility-impaired individuals in mind.
Buildings may be scattered throughout the prison complex, requiring inmates to walk a distance to access healthcare, meals, and additional services and activities. Architectural impediments such as steps, narrow doorways, and absence of grab bars and handrails can present problems for inmates needing long term care.[94]
Mobility-impaired older inmates often confront a shortage of wheelchair-accessible bathrooms, including showers with seats, bars, and no shower lip to step over; and too few rooms on a first floor so they are not required to climb stairs. They confront the long distances that exist between housing units and prison services and programs, and may need assistance getting from one place to another. Retrofitting old facilities and construction of new facilities are hampered by budget realities.[95]
Some prisons have changed their rules and created special programs to respond to some of the needs of the elderly. Women age 55 or over who are incarcerated at Central California Women’s Facility (CCWF) benefit from a Silver Fox program which gives them certain privileges, such as being able to take shortcuts when walking from one place to the next, extra pillows and blankets, and extra time for doing laundry. In August 2011, extensive organizing and advocacy efforts by older women at CCWF seeking to improve their conditions of confinement were rewarded with the initiation of a new component of the Silver Fox program, a Senior Living Unit (SLU), to be located in an existing facility designed to “address the emotional and physical needs of the older inmate population” who choose to live in it.[96] The women in the SLU will have privileges otherwise not available to CCWF inmates: additional mattresses upon request, unlimited access to the phone, designated space in the dayroom for small plants, and the ability to purchase a fan and not have it count towards the maximum number of appliances permitted. In addition, plans for the SLU include special age-sensitive programs and support groups. On the other hand, some rules were not modified. Whether or not a prisoner is geriatric, infirm, or has disciplinary violations, she will be put in cuffs and shackles when taken offsite to a medical visit, even though such restraints can be painful for persons with older bones.
Housing for the Elderly
Corrections departments do not typically make housing assignments for inmates solely based on age.[97] When it comes to housing the elderly, prison systems support “mainstreaming,” that is, keeping older inmates in the “general population” as long as possible, consistent with their particular physical and mental needs and vulnerabilities. Housing decisions take into account frailty, disabilities, illness, and the “culture” of particular facilities—some are known to be more violent and dangerous than others—in addition to the security classification of the inmates. Space permitting, aging inmates who have serious physical or mental conditions or limitations on their ability to independently manage the activities of daily living will be placed in a facility that has the capacity to meet those particular needs. As older incarcerated persons develop increased needs for medical services and assistance, officials often place them in facilities in which the aging and/or infirm predominate.[98] For this report, Human Rights Watch conducted many of our site visits in facilities with high proportions of elderly and infirm inmates.
|
Cedric McDonald, age 65, has been in prison in Mississippi since 1998 serving a 20-year sentence for a second degree manslaughter conviction for killing his wife. He was a truck driver all his life and had never been in prison before. He has a transplanted kidney and is on dialysis three times a week. When we interviewed him he was toothless. He told us he had dentures, but could not afford the denture cream so did not use his dentures. “Chews pretty good without them.” he said. Because of his dialysis he cannot get a prison job, and relies on money his sister sends him every so often so he can buy cereal and coke from the commissary. Older people often have a difficult time coping with extremes in temperature, whether heat or cold. There was record-breaking heat when Human Rights Watch visited the prison, and McDonald’s principal complaint was the heat in the un-air conditioned building in which he lived. “It’s so hot in the building. I want to cool off. Fans don’t do much. It cools in the evening. You get one cup of ice after 12, none in the morning, and two cups in the evening.”[99] |
For example, at Ohio’s Hocking Correctional Facility, large dormitories house predominantly older men; the average age is 66, and 84 percent of the population there is over 60. The oldest man is 89 years old. The men can stay at Hocking until they cannot take care of their daily living needs (for example going to the bathroom by themselves) or become so ill they need greater access to specialized medical care.
Some prison systems are developing special housing units that provide higher levels of care than in the general population, but short of assisted living or skilled nursing care. These units are not limited to the elderly but are used for any confined person who needs greater medical care or assistance with daily living activities. As the Missouri Department of Corrections Aging Offenders Management Team noted, aging offenders with mild to moderate levels of need for health services can “do well in a ‘modified’ general population setting where they have reasonable accommodations for their mobility, medical and mental health needs.”[100] The team recommended the development of Enhanced Care Units which would have no top bunks, daily rounds by health services staff, organized activities to keep offenders busy and oriented, assistance from other offenders trained to be helpers, and special assistance with meals.[101] In response to this recommendation, the department has piloted its first Enhanced Care Unit “to keep offenders as functional as possible while providing appropriate health and housing services to accommodate their special needs.”[102]
At Mississippi State Penitentiary, men who, whether due to age or for other reasons, need more support and assistance than is available in regular general population units are housed in Unit 31, a special housing unit.[103] Prisoners can stay there until they deteriorate to the point at which they can no longer care for themselves, even with the help of other inmates. They are then moved to the hospital.
The Texas Department of Criminal Justice has special geriatric units, located in different state prisons, to provide accommodations for offenders who are age 60 or older and who have specific difficulties with daily activities. In these units, the prisoners have longer periods of time to dress, eat, move from place to place, and shower. Texas also provides a higher level geriatric facility for male inmates located at the Estelle Unit next to the Estelle Regional Medical Facility to ensure accessibility to clinical staff. This unit provides “access to multiple special medical services, such as physical, occupational, and respiratory therapy; special wheelchair accommodations; temperature-adjusted environments; dialysis; and services for inmates with hearing and vision impairments.”[104]
Many of the elderly in prison, as in the community, eventually develop a diminished capacity for self-care and require assistance with daily living activities as well as increased medical care. The range of specialized housing for such inmates includes assisted living care units where help with activities of daily living is offered; convalescent care with nursing assistance during the day; skilled care with nursing provided day and night (as in a nursing home); and hospice care for the dying. As of 2008, at least 13 states had responded to the needs of older offenders by creating specialized units, six had dedicated prisons, nine had dedicated medical facilities, five had dedicated secure nursing-home facilities, and eight had dedicated hospice facilities.[105]
Older individuals may end up in long term care in facilities that provide the necessary care and access to medical treatment, but which are not set up to provide non-medical programs for the elderly. For example, in the long term care unit at the Correctional Medical Center (CMC) in Ohio, which has a high proportion of older prisoners, there are no communal spaces or programs. Unlike a nursing home in the community which will have age-appropriate activities, at CMC there is little for the individuals incarcerated there to do to keep them from “simply wasting away” as one staff member told Human Rights Watch.[106]
Meeting the housing needs of the current aging population is an ad hoc process in which officials juggle many factors including the nature and severity of an inmate’s illness or disability, the availability of beds in facilities with requisite levels of medical care, security levels, and risks for victimization or predatory behavior, among others. Housing the elderly is a daily game of musical chairs that can shortchange individual elderly persons while it bedevils corrections officials. Prison officials struggle every day to find enough lower bunks for inmates who cannot climb to the upper ones. They move inmates in and out of hospital beds because they lack sufficient numbers of nursing facility beds. Sometimes the only available housing option is to put those who can no longer take sufficient care of themselves in infirmaries or hospitals, even though those settings provide intensive levels of care in highly restrictive settings that may exceed what the individual requires. In some systems, old and infirm individuals end up in administrative segregation beds—with all the restrictions of segregation—due to the lack of alternative housing options.
Officials in many states acknowledged to Human Rights Watch they are struggling to keep their heads above water with regard to housing the elderly. Their ability to properly house and provide treatment for older inmates is frustrated by lack of resources, inappropriate physical plants, insufficient support from elected officials and the demands of more immediately pressing priorities. They also acknowledged to us they do not see how they can meet the needs of the growing number of older prisoners projected for the future absent new resources, new construction and enhanced staffing. In every state we visited, for example, officials stressed the need to develop additional assisted living care and skilled nursing care capacity to respond to the growing population of the elderly.
Housing for inmates with dementia
We could write her up for verbal abuse but what’s the point.
—Correctional officer
Prison officials were not able to provide us with good data on the number of inmates they confine with age-related dementia, but they told us the numbers are growing.
Prisons do not ordinarily screen for age-related cognitive decline. In the circumscribed world of prisons with limited opportunities for prisoners to make decisions about how to manage their days, or to plan, initiate, or carry out complex behavior, early stages of dementia may not be seen in how a prisoner handles the incidents of daily life. Dementia usually becomes observed by staff or other inmates (who alert staff) when a prisoner exhibits bizarre or erratic conduct, for example, by refusing to bathe or clean up after himself.
Other inmates often contribute to the ability of the aging who are developing dementia (as well as those who have other mental or physical impairments) to stay in general population facilities. Such assistance may be ad hoc—one cellmate helping another because he chooses to—or formalized through offender aide programs in which carefully selected and trained inmates are given the responsibility of assisting inmates who, because of their cognitive decline, need help with daily living activities.
Homer Edmunds was not able to tell Human Rights Watch his age or how long he has been in prison in Mississippi. According to staff, he is 87 years old and has been in prison convicted of homicide since 1984. For the last 21 years he has been in Unit B at Central Mississippi Correctional Facility, a unit for inmates who have special needs, whether due to age or other reasons. He can hardly walk, and was brought to the interview with Human Rights Watch in a wheelchair, but could not explain to Human Rights Watch why he was in it. According to the staff, he needs help with showering, and has severe cognitive issues including little memory, but the staff and other inmates help him get through the days because he does not want to go to the hospital. He has also been diagnosed as a paranoid schizophrenic.[107]
At some point, cognitive problems can grow so severe that remaining in the general population is no longer an option. While many prison systems incorporate offenders with dementia in special medical settings, a few have special units for inmates with dementia, including California, New York, and Ohio.
New York’s Fishkill Correctional Facility has a Unit for the Cognitively Impaired (UCI) within its Regional Medical Unit (RMU). In December 2011, when Human Rights Watch visited it, the UCI housed 25 men with dementia or other progressive cognitive impairments,[108] 17 of whom were age 70 years or older. The UCI provides long term care in an infirmary-type setting. Many of the men in the UCI are likely to die behind bars, as their earliest possible release date will not occur until they are in their eighties; 11 have life sentences.[109] When Fishkill opened the UCI, all of the staff—from janitors to corrections officers to doctors—trained together to understand how the unit would operate and how the nature of the prisoners there would differ from the general population. Senior officials thought it was particularly important for the corrections officers to “buy into the concept that the cognitively impaired have special issues, and you don’t have to get in their face just because they get into yours…. You don’t have to respond to aggression with aggression,” the way an officer might in a regular unit.[110] Security staff have to bid for assignment to the unit and receive 40 hours of special training; security staff are also part of the team, including the medical and psychiatric staff, that periodically review patient conditions and progress. During our visit, we were told that despite the violent histories of some of the men, misconduct is relatively rare in the unit. In addition to psychological and psychiatric treatment, the men in the UCI are offered diverse structured programs that are supposed to be tailored to their particular needs; they can also participate in programs offered to RMU inmates generally. The staff seek to overcome the tendency of UCI residents to isolate themselves in their rooms, encouraging them to participate in group activities, such as bingo.
California Men’s Colony (CMC) contains a special unit which houses inmates with moderate to severe dementia along with those who have developmental disabilities. In the past, CMC did not provide therapeutic interventions tailored to the needs of inmates with serious age-related cognitive decline, but it has recently been testing a special needs program for inmates with dementia that targets their physical environment (for example by providing visual prompts to compensate for memory problems and poor judgment), social environment (by providing training for custody and nursing staff), and the individual inmate himself (through recreational activities and groups to address various needs, like how to manage emotions and compensate for cognitive impairments). The initial results show that prisoners with dementia who participated in the program significantly improved in terms of irritability, social skills, depression, and attention.[111]
Other states are developing plans for special housing for offenders with dementia. In Georgia, for example, the Department of Corrections is working on plans for a geriatric supportive living unit for those with dementia and mild to moderate cognitive impairment. The unit would have treatment teams, including psychiatrists, psychologists, and nurses, and provide therapy groups targeted to the offender’s special needs. It would not, however, be for the more extreme cases; offenders who have major difficulties managing their daily living activities would be moved into a skilled nursing facility.[112]
Whatever the merits of existing or planned facilities for prisoners with dementia and other progressive cognitive impairments, there is one problem that plagues them all: their capacity is too small for predicted need in the near future. Given that one in eight persons age 65 or over develops Alzheimer’s,[113] it is clear that the number of prisoners with progressive cognitive impairment is going to increase markedly in the future.
Segregating the Older from the Younger?
Young guys will do stupid stuff.
—Chad Summers (pseudonym), California Substance Abuse Treatment Facility and State Prison, April 13, 2011
Our research suggests that while older men and women who are in prison have plenty of complaints about younger inmates, they do not want to spend all of their time solely among other old inmates. Corrections officials we interviewed found many advantages in keeping older inmates living with younger inmates as long as possible.[114]
Many of the elderly incarcerated men and women we interviewed expressed the view that younger inmates tended to be rowdy, noisy, and disrespectful. Older incarcerated individuals by and large did not want to have to share cells or dormitories with “gangbangers” and “knuckleheads” who are “still wild.” Older male offenders also told Human Rights Watch that the younger ones tend to be more defiant and engage in misconduct, which prompts a tougher attitude on the part of correctional staff, which can carry over into their treatment of the older inmates.
|
If a guy in a wheelchair stands up to get ready to fight, by the time he’s standing up he’ll have forgotten what he was going to do. |
A 68-year-old man at Hocking explained to Human Rights Watch why he preferred being in a facility with mostly older men:
We don’t have the fights, stealing, getting beat up. We do have arguments, but if a guy in a wheelchair stands up to get ready to fight, by the time he’s standing up he’ll have forgotten what he was going to do.[115]
But older inmates do not want to spend all of their time with people their age. The older men and women we interviewed appreciated the stimulation, activities, and ability to “stay young” that come from interacting with a mixed age group. A recent study of older inmates in Rhode Island found that only 9 percent of interviewed older inmates suggested the aged should be in a separate unit. The older inmates reported that they had quiet places to go to avoid engaging with other inmates when they chose not to, and most did not interact exclusively with similarly aged inmates. “[Like] their counterparts outside of prison, older inmates often did not want to classify themselves as old, seeing themselves as acting younger than their age.”[116]
There are other benefits for aging prisoners in having at least somewhat younger or at least less infirm prisoners about. More capable inmates will help “cover” for increasingly frail or infirm inmates, by helping them with some of their daily activities, so that they will not be moved into an infirmary or hospital. Prisoners of all ages told us the elderly want to avoid such places because the conditions can be more restrictive (for example extremely limited out-of-cell or outside time), because they do not want to be removed from their prison “family,” and because they are seen as places to go to die.
Older offenders also sometimes take on the role of guide or mentor to younger ones, which can be deeply satisfying. Some women told us they liked living with younger inmates because they were able to take on the role of “mother” for the younger ones. As one young man told Human Rights Watch, older guys “taught me how to do my time, so I don’t cause problems.”[117] In his view, younger inmates would be at a disadvantage if older guys were kept away. On the other hand, other inmates told us young inmates resent any efforts by older ones to give them advice. It is important, however, not to lose sight of the fact that older inmates, like younger ones, are a heterogeneous lot. Some may want to offer good counsel and support to those who are younger; some may have no interest in doing so; and some may have little or no tolerance for younger ones.
Correctional staff members we interviewed see advantages to mixed age populations. They pointed out that because the older offenders are more stable and mature, and want to do time as easily as possible, they can be a calming, stabilizing influence on younger ones and can help convince them to “go along with the program.” As William Connelly, the superintendent of Fishkill Correctional Facility in New York, told Human Rights Watch, older prisoners teach younger ones how to behave. Moreover, he strongly believes, “if you rest you rust,” that is, keeping the older inmates active in a mixed age group population promotes their own physical and mental well-being.[118] He insists that in New York, at least, the needs of individual aging offenders can be met on an individual basis, without clustering them by age into designated units. We are not in a position to say whether New York—or other states that take the same position—is in fact able to meet the needs of older offenders on an individual basis. But there is little doubt that ensuring elderly offenders are incarcerated in a manner that respects their human dignity may require transfer from regular general population units at some point during their incarceration. The question will become increasingly urgent as to whether correctional systems have or will be able to develop the capacity to meet the needs of older offenders for different kinds of housing and care.
Victimization
It’s terrible to come here as a 70-year-old. You lose all your family, your home. You’re here with all these kids, noisy, disrespectful, they steal from you, take whatever you got from canteen.
— Lawrence Alexander (pseudonym), California Substance Abuse Treatment Facility and State Prison, April 13, 2011
Corrections officials have the responsibility to protect the safety of those they confine, and people who have been deprived of their liberty have the right to be kept safe. Nevertheless, US prisons can be extremely dangerous places; inmate-on-inmate violence and staff-on-inmate violence jeopardize inmate well-being as well as rehabilitation. Victimization can range in gravity from homicide, severe physical assaults, and vicious rapes to more minor acts of harassment, extortion, theft, or humiliation. Certain types of inmates seem to be more frequently targeted for abuse, especially those who are small, weak, and vulnerable. Older and frail inmates may also be at higher risk of victimization if housed with much younger inmates. For someone who is old and frail, the right to safe conditions of confinement may mean not being required to live in a dorm with younger persons prone to violence and extortion.
Most correctional systems do not track assaults or other forms of victimization by age. Statistics measuring physical or sexual victimization of older inmates—whether by other inmates or by staff—is hard to come by. Data from a quality of life survey of thousands of New Jersey inmates by Dr. Nancy Wolff indicates that both male and female offenders over age 50 report lower rates of victimization by staff and other inmates than do younger offenders. Nevertheless, one in five inmates surveyed who was older than 50 reported some form of physical victimization, primarily inmate-on-inmate.[119]
In a much smaller study of 65 male prisoners age 50 or older, 10.8 percent reported physical attacks and assaults without weapons, 1.5 percent reported physical attacks and assaults with weapons, 6.2 percent reported being robbed, and 1.5 percent reported being raped, with the perpetrators primarily being younger prisoners.[120] California women inmates in mixed-age, general population prisons who responded to a questionnaire expressed concern about the risk of abuse from other women. For example, one woman in her seventies described how her cellmate “[got] right up in my face, and she kept saying she was gonna hit me. She went on that just because I was old and then she went on describing all my wrinkles … She didn’t hit me that day but I expect it will happen sometime. If you start telling the officers what happens they turn right around and go to that person and say, ‘she said such and such’ and ‘what’s this about?’ and you’re in worse shape.”[121] On the other hand, in Rhode Island, a survey of 67 inmates ages 55 to 88 in a medium security prison suggested that older inmates did not see themselves at risk for victimization.[122]
Human Rights Watch did not find a consensus among corrections officials or inmates we interviewed regarding the victimization of older inmates when they are housed with younger inmates. Some officials believe that victimization of the elderly is infrequent, and that when it occurs it typically involves annoyance and harassment or minor theft; serious physical confrontations are rare. Some said that younger inmates protect the elderly ones, insisting that everyone respect them. Others believe that older inmates are at high risk of victimization at the hands of younger inmates. Officials who believe the elderly can be “easy prey” emphasize the importance of placing them in facilities whose inmate population and culture are known to be safer, which in practice can mean facilities with higher proportions of more mature inmates, including those who are elderly, or disabled inmates.
Inmates who are incontinent and urinate or defecate in their clothes—which is not uncommon among the very elderly—may be ostracized and even physically assaulted by other inmates who are offended by the smell. Dr. Joseph Bick, the chief medical officer at California Medical Facility in California, explained to Human Rights Watch that if an old man living in a dormitory with younger offenders has an “accident,” such as a bowel movement in his pants, or if he “smells like pee all the time” because he’s incontinent, he may end up being attacked by annoyed younger inmates.[123]
According to correctional officials and inmates themselves, older inmates generally try to avoid conflict and “do their time” as quietly and easily as possible. This stance may also be a strategy to protect themselves if they are living in dangerous prisons. Whereas younger persons in prison tend to protect themselves by proving their capacity to be aggressive and dangerous, the older inmates tend to use “passive precautionary behaviors such as keeping more to oneself, avoiding certain areas of the prison, spending more time in one’s cell, and avoiding activities.”[124]
Our research suggests that victimization is not a significant problem for the elderly who are confined in “safer” facilities with a high proportion of older or infirm inmates. To the extent the elderly in such facilities were victimized, it tended to be through verbal threats, insults, and being cut in front of by other inmates in food or medical lines. More infrequently, the elderly faced theft or extortion of property or goods from the commissary. The inmates we interviewed also suggested that while the elderly do have things taken from them, this did not happen at a greater rate than that suffered by other inmates.
In terms of safety, there may be a difference between the elderly who have grown old in the prison system and those who arrive old as newcomers to incarceration. Three women we interviewed in a California facility told us they felt relatively safe because as “old timers” they had established relationships and felt protected by other inmates. (Still, they also complained, as did many other inmates both male and female, that younger inmates today have less respect for their elders than inmates did in the past). They thought, however, that older women who were new to prison may be at a higher risk of victimization. Like other inmates and corrections officials suggested to us, people who have been in prison a long time, or who have prior experience with incarceration, tend to “know the ropes,” and can see trouble coming and avoid problems more readily than newcomers.
Prison Rules
I don’t mess with staff. I may be old, but I’m not crazy.
— Gerald Brown (pseudonym), Denver Reception and Diagnostic Center, March 23, 2011
When you’re young you’re willing to jump in the flames; when you’re older you realize the flames are hot.
— Mark Donaldson (pseudonym), California Substance Abuse Treatment Facility and State Prison, April 13, 2011
The likelihood that a person living behind bars will engage in violence, extortion, escape attempts, or other violent or dangerous behavior diminishes with age. Corrections officials and incarcerated men and women we interviewed agreed that the elderly as a group are far less likely to cause trouble than younger inmates. They don’t “mess with staff,” they “just want to be left alone,” and they “get along better with each other than younger guys.”
Nevertheless, older prisoners are a heterogeneous group and prison officials insist on the importance of remaining attentive to the actual conduct and risks posed by each individual. A lieutenant at Ohio’s Correctional Medical Facility told Human Rights Watch: “Don’t let the wheelchairs fool you. They steal, argue, trade, fight, try to kick.”[125]
An 84-year-old offender was in disciplinary segregation at the time of a Human Rights Watch visit to a prison in Washington state because he had engaged in sex with a 72-year-old inmate to pay off a debt he said he owed the younger man. Indeed, staff told us that this particular offender repeatedly engaged in sexual conduct with other inmates, and apparently not always consensually. During our visits to prisons in different states we were told of old inmates swinging at others with their canes, of two old men fighting in their wheelchairs, and of old men who are still active gang members. We heard accounts of elderly who hide and barter medication and other property (like the extra blankets they obtained to protect against the cold). Even the terminally ill can break the rules. We were told of one offender with liver cancer in a prison hospice who arranged for his visitors to bring him contraband; another hospice inmate was allegedly stealing drugs from his fellow hospice mates.
In general, however, it appears that when older inmates do engage in misconduct it typically involves relatively minor rule breaking. The older are far less likely than younger inmates to engage in predatory behavior, be physically aggressive, get into physical fights, keep weapons, or exploit other inmates. We were not able to obtain system-wide data on rule violations by type and by age of offender at any of the facilities we visited. Nevertheless, staff suggested that disrespect to staff and being somewhere without authorization were the most typical rule violations.
|
Wilma Collins (not her real name) is an 82-year-old woman who was incarcerated in a Colorado prison 16 years ago with a three-decade-long sentence for a violent crime. She refused to be interviewed by Human Rights Watch. Because of multiple physical problems, she is housed in a prison infirmary where she essentially receives nursing home patient care, for example, assistance with eating, moving, and bathing. She is widely regarded by other inmates and staff as ornery and difficult. She is also increasingly confused, sometimes insisting, for example, that she has a pet rabbit in her bed. According to a correctional officer, she is “erratic, demented, and sometimes so abusive she puts aides to tears.” Nevertheless, recognizing her condition he asks, rhetorically, “what would be the point of writing her up for verbal abuse?”[126] |
Correctional staff have the responsibility to enforce rules fairly and uniformly, but common sense and basic decency require treating a frail and infirm 80-year-old differently than a boisterous and fit 25-year-old. At least in units or facilities with high proportions of elderly and infirm inmates that we visited, the response of correctional staff to rule-breaking by older inmates tends to be somewhat flexible, accommodating the realities of aging bodies and minds. For example, inmates are supposed to stand for count. Bedridden inmates cannot do that, so they are permitted to satisfy the requirements of count by sitting up in bed, or simply by being awake. Linen is changed on a set schedule, but an offender who wets his bed will be given clean sheets regardless of that schedule. Staff are more likely to try to talk to an elderly offender who is breaking the rules or give him a verbal reprimand rather than to write up a ticket. If an old inmate is having problems getting to chow on time or cleaning his cell, the corrections officer may try to help find a solution or alert medical staff. When they do write up a ticket, unless the offense is quite serious, a disciplinary hearing may never be held. Officials pointed out also that while some rules may have to be “bent” a little to accommodate an offender’s infirmities or disabilities, staff also want to avoid decisions that will leave other offenders thinking they can get away with whatever they want to do. This may be particularly true in facilities with high proportions of younger inmates, who pay close attention to staff behavior and adjust theirs accordingly. Balancing fairness to the elderly with consistency and firmness can be a difficult balance and in any given situation, the older prisoner may end up with his legitimate needs not being satisfied.
|
California corrections officer describing a 70-year-old man: “He forgets his medications, he loses his way to the cell, and he forgets that he is in prison. He gets into fights because he ends up in the wrong cell. He is unsafe and needs more care.” [127] |
Prison Staff and the Elderly
Learning how to identify and meet the needs of the aging population or how to understand geriatric behavior is not part of the training most corrections officers receive.[128] Few if any corrections departments provide training in the academy (before employment begins) or in-service training that addresses the special needs of aging offenders, including how to recognize physical and cognitive deterioration. As one California corrections officer who works in a unit with offenders with dementia and developmental disabilities told us, he came to the unit with no understanding of dementia, or even any training in how to communicate with those have it. He is “just learning it as [he goes] along.”
Trained or not, corrections officers are the eyes and ears of a corrections department, and they are on the front lines of prison geriatric care. Working day in and day out with inmates, they may be the first to know when one of them begins to behave in a strange way, starts having difficulty with regular activities, or develops symptoms that require attention. Mental health and medical staff rely on the corrections officers to notify them of such developments which might otherwise go unobserved until a scheduled medical visit. (Other inmates will also notify staff if one of their fellow inmates seems to be having trouble.) Corrections officers are also sometimes aware of inmate disabilities and impairments that have escaped tracking in the health system.
Even though corrections officers may be aware of limitations that offenders may have in their ability to function in their living environment, assessing functional skills and capabilities of offenders is not one of their formal responsibilities, it is not something they are trained to do, and overcrowding may make it impossible to do it sufficiently in any event. A study in the notoriously overcrowded California prison system found that nearly one-third of geriatric prisoners were unknown to their assigned officers.[129]
Prison facilities have their own cultures which are reflected in staff as well as inmate behavior. Staff and inmates we interviewed agreed that the culture in facilities with large proportions of the elderly and the infirm tend to be more “laid back,” less rigid, and “more peaceable” than in other prisons. The inmates we interviewed in such facilities generally gave good marks to correctional staff and told Human Rights Watch that “with the exception of a few jerks,” most of the staff do not hassle them and seem understanding of the limitations of aging bodies.[130] They said staff were generally helpful to older inmates and informally accommodated behavior from an older inmate that would not be acceptable from a younger inmate. We cannot conclude, however, that these same attitudes toward the elderly prevail when they constitute but a fraction of a facility’s population.
Even in prisons with high proportions of older prisoners, staff do not consistently treat them (or any others) with respect. We were told that sometimes custody staff see the older inmates as a “hassle” and get frustrated, responding with an impatient, “Oh, go take an aspirin,” to an inmate complaint. Some inmates we interviewed told us about particular instances of staff neglect, impatience, or abuse. For example, men in a California prison claimed custody staff mocked an inmate who had both urinary and bowel incontinence, calling him “despicable,” and that staff called another inmate who wore a protective helmet on his head, “helmet head.”[131] A 61-year-old woman in prison in Colorado who is in a wheelchair told Human Rights Watch some nurses are good, but “some are rude” when they give her the help she needs with toileting. “I’m trying to be fair but [I’m not always] treated like a human being.”[132] Women in a California prison pointed out to Human Rights Watch that “there’s always a couple of women in their unit who are incontinent and need help bathing, but there is no one to help them bathe so they don’t.”[133] In every prison we visited, older inmates also expressed views similar to the following from an older prisoner in Colorado: “If you file a grievance, you’ll be treated worse. People young and old are scared to grieve.”[134] We were also told by many inmates in different states that if an elder prisoner is particularly “obnoxious”, then staff may well be as hard on him as if he were younger. We should also note that a number of inmates described to us particular incidents they believed revealed medical neglect or malpractice.[135]
|
Bonnie Frampton entered prison in Colorado when she was 65, sentenced to more than 100 years for conspiracy for murder. She said the first year behind bars was a culture shock, and that she “still doesn’t truly accept it.” She thinks the staff is “OK.” A few are “the sort you’d never want to deal with” but most leave her alone. They “know she’ll stand up for her rights.” She has filed grievances even though that “risks retaliation because staff get even.” She filed a grievance against an officer who she claims then put a razor blade under her desk so she’d get written up when it was found. When she first came to prison, she had to have a mammogram. Because she has very tender breasts, she put her hands up to stop the mammography and the officer said, “If you touch me, it’s assault,” and she was written up. She has various physical problems, including limited mobility (she uses a walker or a cane), is blind in one eye, has arthritis and asthma, and other “old age medical problems.” She believes corrections officials mistreat the elderly by requiring them to stand outside in the pill line even when there is bad weather. She asks, “Why can’t the elderly and handicapped be given preference in line, so [they] can get their medications first?” She also notes that no extra blankets are provided in the winter even though it is cold. Since she wears her coat inside because of the cold, when she goes outside she has no extra protection. [136] |
Many prison officials told Human Rights Watch that working in facilities with sizable populations of elderly prisoners is quite different than working in others.
William Hannah, a sergeant at Hocking Correctional Facility in Ohio, described his experience for Human Rights Watch:
It was a big culture shock for me when I came here in 1994 because of the age of the offenders. Older guys are needier, need help with everyday living. They are lonely, scared, have the disabilities that come with age. Older guys can be stubborn, cranky. How do you handle grumpy men? We give them a little more leeway. We know they’re hard of hearing, can’t see well, can’t perform like younger guys. Staff who come here from tougher prisons have to learn a different culture. You have to slow down, practice your patience. You can’t talk to these guys the way you would with younger ones. The younger offenders are still wild, still trying to prove something. Older guys just live day by day; they just want to do their time. You need to think about your grandparents. It’s a whole different relationship if the offender is 40 or 50 years older than you. You try not to get upset with them but have to be firm. This is an old age home with bars.[137]
Officers who have experience working in prisons with a lot of younger, more violent inmates may also have to adjust when working with a geriatric population. Having become used to thinking that “violence is just around the corner” and that a hard, firm hand is necessary to avert the ever-present potential for danger, it is a big change for them to develop a more “caring” approach for the aged and infirm. Correctional officials also emphasized to Human Rights Watch, however, that it was a challenge for staff to show empathy and compassion for geriatric offenders without crossing the line into doing things that jeopardize security and safety. According to these officials, just because an inmate is getting on in years, for example, does not mean he is not capable of being manipulative, of seeking to entangle staff in a relationship in which favors will be granted (for example contraband) despite the rules.[138] Corrections and medical staff can view requests from older prisoners for additional services or equipment with the same “default” attitude of distrust and wariness they often bring to requests from younger ones. They ask themselves, for example, does this older man really need an extra blanket because he is cold or is he trying to “game” the system and get an extra blanket for bartering purposes (bartering and trading are prohibited in prison).
|
To be an officer in this environment [a prison assisted living unit] you have to have a different attitude…. Staff don’t receive special training, except how to put the handicapped into a van. But officers come to understand that you can’t yell at [older inmates] like you might to a 25-year-old…. Patience, understanding, tolerance [are] needed from the officers…. You can’t and needn’t assume that if someone raises a hand that danger is imminent. They [older inmates] may not know what they’re doing…. [An officer is] not an aide because you still have a security role, but the shape of that role is quite different because of the context.[139] |
Experts strongly urge training for prison staff who will be working with older prisoners on the normal processes of aging.[140] Training should also include “the communication skills needed with older adult inmates as the process of aging can affect the clarity and the speed of speech as well as thought processes.”[141] According to an Oklahoma Department of Corrections report on the aging prison population, a “comprehensive educational program for all corrections personnel should be required. Training should include the knowledge and skills that are required to meet the specialized needs of older offenders as well as an increased sensitivity to their needs and limitations, and the patience to deal with them.”[142] The problem is one of resources: corrections officials lack the budgets to expand academy or in-service training to add geriatric information.
Training aside, some corrections officers will not have the personal qualities and aptitudes for working with geriatric offenders. As one warden told Human Rights Watch, “the academy doesn’t teach patience.”[143] Corrections staff learn rules at the academy and in training, but applying the rules and regulations to old and infirm prisoners is a very different matter. Senior staff also told Human Rights Watch that new officers fresh from the academy may not be comfortable demonstrating any flexibility with regard to the rules; they need some “seasoning” before they realize they have options other than “writing up a ticket” for an elderly inmate who is not following orders or abiding by the rules.
|
I’ve got one guy in a diaper, one who’s frail. I can only give so much extra attention because I have to watch 70 other guys.[144] |
Inmates had views similar to those of correctional officials regarding the difference between new and more seasoned corrections officers. As one California female inmate said, new officers straight from the academy are too strict, zealous, quick to punish, and “like the gestapo.”[145] Another California inmate at a men’s facility agreed, “the newer the officers, the worse they are.”[146] Yet another said that younger corrections officers tend to be “badge heavy.” It takes a while before they get seasoned and learn that respect begets respect.
Programs, Recreation, and Work
Always seen as a privilege or luxury rather than an essential component of corrections, programs have been slashed in US prisons because of budget crises. Aging prisoners have suffered like all others from cuts to programs. Even when programs are available, however, they are rarely designed specifically for the educational, physical, psychological, social, and rehabilitative needs of older persons. Older individuals in prison, for example, rarely have the benefit of programs to address the realities of aging or to help them understand and protect their health in later years. Many of the older prisoners we interviewed have little to do besides read, watch television, or talk to each other.
Ohio was once nationally recognized for the numerous special programs its prisons had for the incarcerated elderly.[147] Many of those programs have fallen by the wayside because of budget-related staff shortages. Thus, for example, Hocking Correctional Facility—in which men over 60 constitute the preponderance of the population—no longer offers programs designed to help offenders understand or cope with numerous physical and mental changes associated with aging. The elderly are also shortchanged because available educational and social programming targets offenders who will be released within three years and most of the older men at Hocking have far more years to go before they near release. Human Rights Watch interviewed Warden Francisco Pineda, who was keenly aware of the lack of programs for the older inmates. In an unpublished paper he wrote that he provided to Human Rights Watch, Pineda expressed his belief that a study is needed to assess the needs of older inmates in Ohio to “help to determine not only programming, but also institution designs or policy recommendations that will address age-specific activities and other types of treatment” that will both help older offenders transition back to the community and enhance staff performance managing them.[148] In Georgia, too, correctional officials acknowledge that they lack the resources to provide much programming for older persons. Because of budget limitations, programming in Georgia prisons is targeted at reentry skills that typically exclude older inmates.
Recreational programs for young and old alike have been slashed because of budgets. Where they exist, physical recreation programs are rarely tailored to older, frailer bodies. Older inmates must also compete with younger ones for access to gym and other recreational equipment. There are exceptions. Colorado Territorial Correctional Facility (CTFC), for example, has a special recreation hour limited to offenders age 50 or over as well as younger offenders with mobility impairments or developmental disabilities. Staff try to provide special activities, like football toss, and tournaments for the less able and active inmates. The effort at CTFC to create recreational opportunities for geriatric and infirm prisoners was not, however, replicated at other prisons we visited.
Older inmates typically are able to work in prison, assuming they are physically and mentally capable. Indeed, they may have to work regardless of whether they want to: there is no retirement age in prison and some prison work is mandatory. While prisons in theory try to match jobs with individual inmates’ capabilities, inmates complain that older inmates are given inappropriate job assignments and required to work under conditions that are dangerous for them. According to a California inmate, “There’s no consideration because of their age that maybe it’s time for them to stop working. You know, they just work till they parole or drop dead.”[149]
Officials say offenders want to work; it helps them stay busy and active, can be a source of pride, and can provide some much needed income. Human Rights Watch visited the license plate manufacturing facility at CTFC, where we saw older men in their wheelchairs next to men in their thirties. Human Rights Watch talked with one man in the factory who was 76 years old and had worked there for 19 years; another inmate, who was 69, had worked there for 13 years, becoming the lead man for embossing; and another, who was 65, who had spent 11 years in the shop. All three expressed pleasure in their work, but the conversations were not private and we have no way of knowing whether different views would have been expressed if they had been.
Planning for the Elderly
Although senior corrections officials know their population of elderly individuals is growing, few corrections systems have undertaken a thorough analysis of their existing and projected elderly populations or have a comprehensive strategy for addressing the needs of the elderly with regard to the built environment and facilities, the programs and activities, healthcare, and preparation for release. Without such studies, it is difficult to make sound policy and programmatic decisions for the future.
North Carolina undertook an Aging Inmate Population Study in 2006 that had the following goals:
- To examine the factors that have accelerated the growth in the elderly inmate population;
- To examine the demographics of the elderly inmates;
- To explore avenues taken by other states in addressing the issues of an aging inmate population;
- To analyze the costs of providing care to an aging inmate population;
- To explore possible resources to help the Division in dealing with the aging inmate population;
- To investigate innovative approaches for dealing with health and mental health issues of aging inmates;
- To recommend possible solutions to the overwhelming expenses of housing and caring for elderly inmates; and
- To increase Division knowledge regarding the needs of aging inmates.[150]
The North Carolina study concluded with a number of recommendations, but we do not know how many were implemented.
Obviously, studies accomplish little if officials do not act on them. In California, for example, despite numerous reports by consultants documenting the needs of a growing population of aging prisoners, the California Department of Corrections and Rehabilitation (CDCR) implemented few of the report’s recommendations.[151] As Clark Kelso, the medical receiver for the California Department of Corrections and Rehabilitation, told Human Rights Watch, “you need to listen to your experts who are projecting population demographics and bed needs and then prepare accordingly.”[152]
Even the best of plans—as well as existing programs—can be wrecked by budget crises. Attention to the rising numbers of elderly behind bars can also be sabotaged by changes in correctional leadership, shifting legislative and executive branch priorities, the daunting effort to manage prison populations that still exceed optimal capacity, and the challenges of day-to-day operations. Another problem lies with the absence of staff specifically tasked with supervising the needs and treatment of older inmates. The needs of older men and women cross multiple departments within corrections systems such as custody, operations, medical, and program departments. We know of no correctional system in which a senior official has been assigned the specific responsibility to assess conditions of confinement for older prisoners from a cross-cutting and integrative perspective and to press for the changes needed to improve those conditions.
IV. Aging Bodies, Soaring Costs
Elderly inmates pose a minimal threat to society, they require special attention and care, and as a group they consume a disproportionate amount of correctional funds.
— Herbert J. Hoelter, “Imprisoning Elderly Offenders”
[O]lder inmates have more health problems, generally consume more health services, and are prescribed more medications than younger inmates…. Regardless of the increased demand these individuals place on the system, their numbers are steadily increasing and they will continue to consume a disproportionate share of the limited resources available for health care and programmatic enhancements within the correctional setting.
— State of Florida Correctional Medical Authority, “2009-2010 Annual Report and Report on Aging Inmates”
Incarcerated men and women have a constitutional right to healthcare.[153] International human rights law also mandates that persons deprived of their liberty receive healthcare.[154] Older prisoners are at least two to three times as expensive to incarcerate as younger prisoners, primarily because of their greater medical needs.[155] Our research shows prison medical expenditures for older inmates range from three to nine times higher than those for the average inmate.[156]
The prevalence of illness and disability increases with age in prison, as in the community. The challenge for correctional systems is not only to provide for current needs, but to ensure projected needs can be met in the future. As the Tennessee Department of Corrections noted:
[E]ven if the rate of growth of the elderly is only moderate, any anticipated growth in this population requires appropriate planning due to the resources required to meet their additional needs (additional medical staff, pharmaceuticals, medical equipment and treatment, etc).[157]
Age and Infirmity
Like their community-dwelling counterparts, older prisoners are susceptible to the chronic diseases and infirmities associated with age, including heart and lung problems, diabetes, hypertension, cancer, ulcers, poor hearing and eyesight, and a range of physical disabilities.[158]
A recent survey found that 46 percent of male inmates 50 years or older and 82 percent of inmates 65 years or older have a chronic physical problem.[159] In Ohio, 32 percent of the older inmates are in chronic care clinics.[160] Data from Florida shows that relative to their share of the total prison population, prisoners age 50 or over are disproportionately enrolled in chronic illness clinics, and account for a disproportionate share of all medical contacts.[161] In California, inmates age 55 or older, who are 7 percent of the prison population, consume 38 percent of prison medical beds.[162] At Georgia’s Augusta State Medical Prison, which provides acute care, specialized medical and mental health services, assisted living, and chronic care, 27 percent of the prison inmates are age 50 or over.[163]
Older inmates not only have more infirmities than younger, but the nature of their diseases and the responses required tend to be different. As David Runnels, of California’s Correctional Health Care Services, explained to Human Rights Watch:
In young people, disease tends to be an acute, single episode to be treated [and which once treated] requires little further care. In older individuals, disease is often a chronic, progressive process. Recovery is slower and the care of these illnesses must be over years or even a lifetime. Surgery, medications, therapy, and multiple types of medical providers and specialists are involved. Hospitalizations, nursing home stays, and procedures are needed. All this must be coordinated to provide good care…. We have seen the elderly population grow from 2% to a projected 10% by 2013. This growth requires that we reconfigure the existing system and make both physical plant and clinical services delivery changes to accommodate the specialized needs of the elderly population.[164]
Meeting the medical needs of older prisoners requires a range of medical staff and facilities offering different levels of care. An example of the need of elderly offenders for nursing care and support is evident in the following data from Connecticut: among inmates age 60 or over, 10.7 percent have no current physical problems requiring nursing attention; 28.5 percent have a sub-acute or chronic disease that requires occasional nursing attention; 50.7 percent need predictable access to nursing care 16 hours a day, seven days a week; 7.4 percent need 24-hour access to nursing care and there is a reasonable likelihood that from time to time they will need 24-hour actual nursing care; and 2.7 percent need 24-hour nursing care, possibly for an extended time.[165]
Medical Expenditures for Older Inmates
Prison medical care accounts for a significant part of correctional budgets. In California, for example, one-third of the annual per capita cost of each inmate is for medical, mental health, and dental care.[166] In Virginia, medical expenditures account for 15 percent of the state’s correctional operating expenses.[167]
Older prisoners are responsible for a disproportionate share of prison medical expenses. As geriatric specialist Dr. Brie Williams summarizes:
[T]he increased burden of illness, disability, and special needs among geriatric prisoners makes them expensive…. As it is in the community, older age is among the strongest predictors of morbidity and medical care utilization. The high cost is due to higher healthcare expenses among geriatric prisoners including hospitalization, medications, diagnostic tests, and skilled nursing care.[168]
A recent effort to assess the impact of age on healthcare costs nationally concluded that the average annual cost per prisoner was $5,482, but that for prisoners age 55 to 59, the amount was $11,000, and the figure steadily increased with age cohorts, reaching $40,000 for prisoners age 80 or over.[169]
Many states do not track per capita medical costs for inmates by age. Nevertheless, data from some of those that do testify to the significantly greater medical costs associated with older prisoners. For example:
- In California, the contract medical services expenditures for inmates 55 years or older is twice that of younger inmates. Inmates 55 and over constitute about 7 percent of the prison population and account for about 38 percent of medical bed resources. “If the utilization rate continues and population projections for the aged do not change, by 2012 over 50 [percent] of the medical bed resources will be used by inmates 55 years and older.”[170]
- In Florida, the 16 percent of the prison population that is age 50 or over accounts for 40.1 percent of all episodes of care and 47.9 percent of all hospital days. Such inmates have twice the number of sick calls as younger inmates, represent 35 percent of chronic clinic contacts and ambulatory surgeries, and have three times as many drug prescriptions as the average inmate. Twenty-four percent of all prescription drugs costs were spent on drugs for them.[171]
- In Georgia, incarcerated individuals age 65 years or older had an average yearly medical cost of $8,565, compared to an average medical cost for those under 65 of $961.[172] Those 50 years of age and older constituted 14 percent of the prison population in 2009, but accounted for 40 percent of outside medical expenditures.[173] In 2011, inmates age 50 or over accounted for half of the 100 “most expensive” inmates in terms of outside medical expenditures.[174]
- In Michigan, the average annual healthcare costs for prison inmates has been estimated at $5,801; the cost for inmates age 34 or under is $4,200 or less, and the cost for inmates age 55 or older ranges from $11,000 to $40,000.[175]
- In Nevada, per capita costs for medical services provided outside the prison averaged $4,000 to $5,000 per year for inmates over 60 compared to an annual per capita average for all prisoners of $1,000.[176]
- In North Carolina, the average per capita cost for healthcare (dental, medical, and mental health, whether provided within the prison system or by outside hospitals and providers) was $5,970 for inmates 50 or older, compared to an average per capita cost of $1,980 for all prisoners. Indeed, the cost for inmates 50 or over is more than twice as much as the cost for inmates age 40 to 49.[177]
- In Oklahoma, healthcare expenses for inmates age 55 to 64 are more than twice as much as those for the 19 to 44 age group.[178] Specialty care and hospitalization costs average $6,231 for inmates over 55 and $4,911 for those who are younger.[179]
- In Texas, although elderly inmates represent only 5.4 percent of the inmate population, they account for more than 25 percent of hospitalization costs. The healthcare cost per day in fiscal year 2005 for an elderly offender was $26, compared to $7 per day for the average offender.[180] In fiscal year 2010, the state paid $4,853 per elderly offender for healthcare compared to $795 for inmates under 55.[181]
- In Virginia, the average inmate under the age of 50 has annual offsite medical costs of almost $800 while the average inmate age 50 or older had annual offsite medical costs of $5,400.[182]
Regardless of costs, states must provide adequate healthcare for all inmates, including those who are older, if they are to uphold their duties under human rights and constitutional law. Unfortunately, some states fall short. One of the most infamous recent examples is California, which is currently under a medical receivership because of decades-long deficiencies in the medical and mental health treatment it provided its inmates, and which is also under a court order (upheld by the US Supreme Court) to reduce prison overcrowding so that the unconstitutionally deficient medical and mental health services can be remedied.[183] Older prisoners have suffered from the grossly deficient medical services that characterized California prisons, and they are benefitting from the improvements that are now being made.
Older inmates also benefit from class actions challenging discrimination against prisoners with disabilities in violation of the Americans with Disabilities Act. Thus, for example, elderly prisoners in Colorado who have mobility and other physical impairments have benefited from the 1997 settlement of Marquiz v. Romer requiring reasonable accommodation of prisoners with disabilities.[184] Similarly, there are two named plaintiffs who are over 55 years of age among the named plaintiffs in Holmes v. Godinez, a federal class action brought by Illinois prisoners who are deaf or hard of hearing.[185] The complaint in the lawsuit alleges, inter alia, violations of the Americans with Disabilities Act because the Illinois Department of Corrections does not provide the assistance hearing-impaired prisoners need to communicate effectively and to participate in prison programs and services.
Reimbursement for Medical Costs
State prison systems and the federal system both face the burden of financing constitutionally required healthcare for an aging prison population. The costs of providing medical treatment to inmates while inside prison are excluded from federal health insurance programs such as Medicare and Medicaid. States must cover the full cost of meeting prisoners’ medical, mental health, and dental needs.
Although under the 1965 law that created Medicaid anyone entering state prison loses Medicaid coverage, in 1997 the federal government said that there would be Medicaid reimbursement available for the bills of prison inmates who stay in private or community hospitals for more than 24 hours. (Technically, those who stay in the hospital for 24 hours or more are no longer considered prison inmates for the duration of their stay.) Pursuant to the 1997 policy, the possibility of reimbursement was limited to otherwise Medicaid-eligible inmates (for example, low income juveniles, pregnant women, adults with disabilities, and certain elderly persons). Only six states to date have taken advantage of the opportunity for such Medicaid coverage. Recent changes in Medicaid will expand the potential of Medicaid coverage for inmates. In 2014, anyone with an income below 133 percent of the federal poverty line will become Medicaid eligible, which probably includes most inmates since they have little or no income. The potential savings for states will be significant, since not only will corrections agencies be able to get federal reimbursement for 50 to 84 percent of outside hospitalization costs for inmates, they will also benefit from the lower fees hospitals can charge for Medicaid patients.[186]
While Medicaid may help states defray some of the costs associated with hospital care provided outside the prison system, it will do nothing to relieve states of the considerable costs of transporting incarcerated men and women to and from outside service providers, nor will it help with the costs of providing officers to guard offenders while they are receiving community-based treatment. One or more corrections officers are posted 24 hours a day to watch inmates who are being treated in community hospitals.
V. Release from Prison, Dying in Prison
Biggest challenge of the elderly is getting them out.
— Commissioner Brian Owens, Georgia Department of Corrections, June 28, 2011
Sooner or later, one of two things will happen to an aging prisoner: she will either be released from prison or she will die behind bars. Both reentry into the community of older prisoners and death in prison are topics that have not yet received the attention they warrant. We note below a few observations and concerns. As indicated above, Human Rights Watch will be covering procedures regarding the early release of geriatric and infirm prisoners in a future report.
Release
Reentry into the community from prison is challenging for many formerly incarcerated men and women, difficulties which may be partially reflected in consistently high recidivism rates nationwide.[187] However, reentry poses special challenges for the elderly. Older men and women released from prison often find it extremely difficult to find work, housing, and transportation, as well as necessary medical and mental healthcare. Some have the assistance and support of family when they are released, but some have lost contact with their families—because of the length of time incarcerated, or the nature of their crime—and have no home to which to go.
Corrections officials consistently told Human Rights Watch that extra attention and effort are required to help older men and women resettle in the community. One of the biggest obstacles they face is finding nursing home care for the former prisoners who need it. Many nursing homes do not want to accept ex-felons, particularly if they were sex offenders, and those that may be willing to do so may not have any beds available at the time an individual who needs such care is released. At least two states, Georgia and Connecticut, are exploring the creation of special nursing homes on state property expressly for the purpose of ensuring housing for ex-offenders whose past crimes make them difficult to place in private nursing homes.
Release and Public Safety
Older people can and do commit crimes, including older people who have been released from prison.[188] Nevertheless, violent crime by older former prisoners is relatively rare. It is often said that “crime is a young person’s game” and the likelihood a person will commit serious crimes declines with age.[189]
Despite the many challenges of reentry, older inmates who are released to the community are far less likely to recidivate—to be rearrested, reconvicted, or returned to prison with or without new sentences—than younger inmates.[190]
A recent study by the Florida Department of Corrections revealed strikingly lower recidivism rates for offenders released when they are 50 years of age or older, and particularly for those released at 65 years or older, compared to younger inmates. The report concludes that age at release may be the single most important factor predicting lower recidivism.[191] In Colorado, offenders released at 50 years or older were also less likely to be returned to prison within three years of release than younger offenders.[192]
Many studies of recidivism do not distinguish between returns to prison for technical parole violations—failure to meet with a parole officer, for example—and returns because of the commission of a new crime. From a public safety perspective, the latter is obviously more important. Data that disaggregates reasons for the return to prison shows older inmates are far less likely to commit new crimes after release from prison than younger inmates.
In New York, data on releases from 2000 to 2006 reveals that inmates who were under 55 at the time of release were at least twice as likely to return to prison within three years of release with a new offense than prisoners released at age 55 and over. For example, in 2006, 10.9 percent of offenders released at an age less than 55 years returned to prison within three years with a new offense compared to 5.4 percent of those released at age 55 or older.[193] In New York, between 1995 and 2008, there were 469 prisoners who had been convicted of violent offenses and who were released from prison at 65 or older. Only one of them was ever returned to prison because of another violent offense; seven returned because of non-violent offenses. Indeed, among the total of 1,511 prisoners--including those convicted of nonviolent as well as violent crimes--released during this period after they were 65, a total of 66 returned to prison.[194] This data suggests a negligible likelihood of new crimes by prisoners released when they are older. Whatever the reasons for keeping older prisoners incarcerated, public safety cannot be a plausible one in the average case.
In a 2010 Ohio study, 26.7 percent of former prisoners commit new crimes within three years of their release from prison. But only 5.6 percent of offenders released between ages 65 and 69 commit new crimes , and only 2.9 percent do who are between age 70 and 74 when released. None of the 19 inmates released at age 75 and over committed new crimes; nor, for that matter, did any of them violate the conditions of their parole.[195]
|
Alan Gage, 82 years old, is in prison in Washington state, convicted of assault of a child with a deadly weapon. He was not sure how long he had been in prison when interviewed by Human Rights Watch, but knew that his sentence goes to 2024, when he will be 95. He spends most of the day sleeping and reading, and rarely goes to the yard. He says he cannot participate in things as much as he used to when he was younger. He knows he is likely to die behind bars. “I don’t like the notion of dying in prison, although I don’t think much about it. Because you’re away from everyone, out of the stream, far from those who care about you, who would come together and mourn you.”[196] |
The low probability that released prisoners well on in years will commit new crimes suggests that their continued incarceration adds little to public safety. The possible risk of crime posed by individual prisoners cannot, of course, be determined solely by age; other factors must be considered as well, including their physical and mental condition and recent conduct behind bars. Nevertheless, available data suggests that as a general matter public safety does not require the continued incarceration of geriatric prisoners, especially if they are infirm or incapacitated.
Death
As the number of older prisoners increases, so too does the number of men and women dying of natural causes behind bars.[197] Some grow old and die in prison. Some enter prison in such poor health they will die before they have completed their sentence. For those who are already elderly at the time of admission, even a short sentence may be a sentence to death in prison.
Correctional systems are providing medical care to ever growing numbers of terminally ill prisoners and are trying to expand their ability to provide palliative care for the dying that is consistent with community standards, including through the creation of hospices. Each death is difficult for other inmates as well as staff.
Not surprisingly, older men and women account for a disproportionate and growing share of prison deaths. Nationwide, in 2001, offenders age 55 and over comprised 33.9 percent of deaths in state prisons nationwide; by 2007 the number had grown to 45.7 percent.[198] In the years 2001-2007, 8,486 men and women age 55 or over died behind bars. Data from individual states further illuminates the relationship between age of prisoners and mortality in prison:
- Although older inmates were 16 percent of the June 30, 2010 Florida prison population, they represented 38 percent of all inmates expected to die in prison. Within the age cohort of all Florida inmates over age 50, almost one-third (4,819 of 16,386) are expected to die in prison, and more than half of all inmates over age 70 (297 of 408) will die in prison.[199]
- In New York, inmates 65 years and older comprise 1 percent of the inmate population, but account for 15 percent of deaths; inmates aged 55 to 64 account for 4 percent of the population and 23 percent of the deaths.[200]
- In Ohio, inmates 55 years and older comprised 6.5 percent of the state’s prison population in 2009, but they accounted for 48.5 percent of deaths in 2008 and 2009.[201]
Many prison systems have created hospices to respond to the emotional as well as physical needs of the dying.[202] Others do not yet have licensed hospices, but are attempting to provide palliative care nonetheless. Normal prison visitation rules are typically relaxed in prison hospices so that family members can sit at the relative’s bedside seven days a week and are permitted to repeatedly hug and touch their loved one, something not usually permitted in prison. Human Rights Watch visited the 17-bed hospice at California Medical Facility, which we were told was the first licensed hospice in the country. Chaplain Keith Knauf, the director of the program, says his goal is to attend to the physical, emotional, and spiritual needs of the inmates to “make sure they can die with dignity and respect.” The average stay in the hospice is six months. Shortly before Human Rights Watch visited the hospice, an 87-year-old inmate who had dementia and heart and lung problems had died there. We visited with a 67-year-old inmate who had been in prison for 30 years, serving a 15-to-life sentence, and who has advanced metastatic throat cancer. While he was pleased with the care he was given in the hospice, he was hopeful nonetheless that he would be able to secure compassionate release so that he would be able to go home to die with his family. In the hospice, inmate volunteers who receive 50 hours of training, as well as ongoing training as the need arises, sit vigil with the dying round-the-clock so they do not have to die alone. The volunteers read to the dying, talk and pray with them, write letters for them, and assist the nursing staff with certain basic tasks such as preparing the bath and changing diapers. Chaplain Knauf is extremely proud of the cadre of over 300 volunteer inmates who have worked at the hospice over the years.
He says that those who have paroled from prison hardly ever return.[203] The redemptive impact for inmates who work in hospices can be extremely powerful.[204]
|
Bernadette Thorton, 66 years old, is serving a three-year sentence in Colorado for vehicular manslaughter. She’s on oxygen because of emphysema and a bad heart. She knows she’s dying, and says she’s struggling to get out of prison so she doesn’t die there. She told Human Rights Watch, “Dying here scares me,” and began to cry. She was offered hospice but did not want to go because that “is where you go to die.” She is in constant pain, but the strongest pain medication she receives is Tylenol 3. The last pill is at 5:30 pm, and she receives nothing until the following morning at 7 am. “That’s a long time between pills,” she told us. She was housed in the infirmary, which she found very restrictive because she had only hour a day out of her room. She goes in a wheelchair to the pill line to get her medicine, even in the cold or when it is raining, and may have to wait outside like everyone else. She had to buy extra blankets for the cold because the department would not give them to her. She says her cell is really hot in summer, cold in winter. In the summer, an officer “let me prop the door open even though it’s against the rules…I have a fan to help, but my oxygen machine generates a lot of heat.” She says, “Some officers treat you with respect. A few don’t.” [205] |
Hospice programs do not resolve concerns about the dignity of dying in the harsh environment of prison. A visitor to the hospice—like an inmate in the hospice—can never ignore the fact that the hospice is within a prison with its security staff and security rules and policies, however relaxed those rules may be to accommodate the dying. Prison hospice staff have unique constraints and pressures that come from being located within a prison; they must answer to officials who have priorities quite different than tending to the physical, mental, and spiritual needs of the dying.
Where a dying person wants to be with family outside prison who are willing to take care of him, permitting him to die with his family shows respect for his basic humanity and dignity. What does society gain by requiring the death to occur behind prison walls?
|
Samuel Edison is 53 years old and has been in Colorado prisons for 18 years of a 50-year sentence for aggravated robbery. While in prison he underwent a four-and-a-half-hour program of intensive training to become a nurse’s aide. “He loved every minute of it.” When interviewed by Human Rights Watch, Edison was working as an aide at Territorial, tending to old and dying men in the hospice. In his view, “it’s not good to die in prison. I wouldn’t want to die in prison. It’s sad to see men die here. They should be home outside prison. I’ve seen guys die here who were so old and comatose for weeks before they die. There should be a system so they could go home. But if they have no family or place to go they should stay here.” Edison says working in hospice has enabled him “to help someone instead of hurting someone. Inmates and staff thank me. It’s rewarding…. Life is fragile. It gives me pleasure to help someone, to look at them for who they are, as a human being…. If they need my help they get it, whether rapist or killer. Some inmates don’t understand. I used to get a lot of comments concerning certain patients because of their crimes. There was a serial rapist. I walked and pushed his chair. He died last year at 86. Inmates would yell out ‘why are you messing with that [S.O.B.]?’ I had to bite my tongue and defend him to a degree.” Edison is pleased with some of the changes in the hospice program. “Before they wouldn’t let hospice patients go outside, now they do. It’s important for them to get some sun and air, not be confined to rooms and day hall. They would get cranky, insult the aides, spending all day shut up and no privacy.”[206] |
VI. When is Imprisonment No Longer Justified?
|
I don’t think they know what to do with us…. Let us go somewhere … we have served enough time here. We’re no longer a threat to society, why are you holding us?[207] Elder prisoners are costly to care for, yet research indicates that many of these older inmates represent a relatively low risk of reoffending and show high rates of parole success.[208] |
While human rights law does not preclude imprisonment of older offenders, the incarceration of the elderly nonetheless raises two major human rights concerns.[209] First, are the conditions of detention, including medical treatment, consistent with human rights requirements? We addressed some of the considerations surrounding conditions of confinement in preceding chapters. Second, does the continued incarceration of the aging and infirm constitute disproportionately severe punishment that violates human rights even assuming acceptable conditions of confinement? It is to this second question that we turn in this chapter.
Accountability for crime is an indispensable component of a just criminal justice system. Extremely serious crimes warrant long prison sentences. Nevertheless, as prisoners grow old and infirm, the justification for continued imprisonment may diminish. Even if ongoing punishment is warranted, the question remains whether the form that punishment takes should change to reflect age and infirmity. For example, conditional release to home confinement under parole officer supervision could be substituted for continued incarceration.
Within a human rights framework, imprisonment is an acceptable sanction for crime assuming it is imposed pursuant to lawful procedures and that its duration is not disproportionately severe relative to the crime and the legitimate purposes to be furthered by punishment. In domestic as well as human rights jurisprudence, the proportionality of a sentence is typically assessed based on the circumstances that existed at the time of the crime. Nevertheless, while a prison term may have been proportionate at the time imposed, increasing age and infirmity may change the calculus against continued incarceration and in favor of some form of conditional release.
Take the following men confined in state prisons: Homer Edmunds (pseudonym), age 87, has been in prison for 27 years, and for the past two decades he has been in a special unit because of his severe cognitive impairments. Louis Sparrow (pseudonym), age 68, has been incarcerated for 10 years and is blind, has diabetes and leukemia, and is completely paralyzed except for one arm. Thomas Viceroy (pseudonym) is a 65-year-old man who has been in prison 25 years and is dying of stage 4 metastasized esophageal cancer. Each of these men was convicted of a violent crime and received lengthy sentences. Each has already been in prison a long time.
It is hard to see how their continued incarceration meaningfully serves any of the purposes for which their sentences were originally imposed. The main purposes of punishment are retribution, deterrence, incapacitation, and rehabilitation. Retribution has been furthered by their time behind bars and could be further served if they were released from prison by restrictions on their liberty in the community and parole supervision. Incapacitation and deterrence are not necessary, given that these prisoners are not likely to endanger public safety if no longer behind bars but again, if there were a possibility of wrongful conduct, it could be prevented by the conditions of their release. Finally, further imprisonment is unlikely to advance rehabilitation. In these circumstances, continued incarceration would seem to be a disproportionately severe punishment.
Disproportionality and the Purposes of Punishment
Disproportionately lengthy prison terms may violate the prohibition on cruel and inhuman punishment.[210] They may also constitute arbitrary deprivations of liberty in violation of the right to liberty.[211] In either case, they are inconsistent with respect for human dignity. As the South African Constitutional Court has noted:
To attempt to justify any period of penal incarceration, let alone imprisonment for life as in the present case, without inquiring into the proportionality between the offence and the period of imprisonment, is to ignore, if not to deny, that which lies at the very heart of human dignity. Human beings are not commodities to which a price can be attached; they are creatures with inherent and infinite worth; they ought to be treated as ends in themselves, never merely as means to an end.[212]
Imprisonment is an extremely severe punishment that should only be used as a last resort when no lesser sanction suffices.[213] Assuming it is warranted, however, the question of proportionality turns then on the length of the sentence.Prison sentences should be no greater than that which would be proportionate to the crime itself, taking into account the seriousness of the offense and the culpability of the offender. Within the boundaries set by proportionality to the crime, the sentence may be shortened if shorter sentences are adequate to further such goals as promoting public safety or rehabilitation.[214] The principle of parsimony is included in the concept of proportionality: the least severe sanction necessary to achieve the purposes of punishment should be the one used.[215]
Retribution
Ensuring that offenders receive their “just deserts” is an important component of criminal justice. Victims, their families, and society at large legitimately want those who commit crimes to be held accountable by punishment that “fits the crime”; punishment that is commensurate with the severity of the crime and the individual’s culpability.[216] On the other hand, under international human rights law, imprisonment should not be purely retributory. Prison systems “should essentially seek the reformation and social rehabilitation of the prisoner.”[217]
It might be argued that since “just deserts” are established at the time of sentencing based on the crime that had already occurred, nothing that happens after sentencing should affect that determination. While this may be a theoretically correct argument, in practice post-sentencing developments affect retributive calculations in the United States. For example, in states where sentences are set between a minimum and maximum range, parole boards are either explicitly required or tacitly permitted to reassess the seriousness of the offense in determining how long the prisoner should serve.[218]
Some victims, criminal justice professionals, and members of the public believe offenders should always serve the maximum possible sentence. If the maximum sentence is life, they argue the offender should remain in prison the rest of his life. They oppose early release regardless of the offender’s age and infirmity. But such opposition would not seem to be grounded solely in retributive principles. Grief, rage, contempt for those who break the law, punitive ideologies, and politics may influence it as well.
In the US and many other western countries, retribution ordinarily comes into play to set the outer boundaries for the punishment for a particular crime. Non-retributive considerations as well as the principle of parsimony then factor into the determination of the actual sentence. The end result may be a sentence which is less severe than what would have been permissible from a purely retributive perspective. If utilitarian concerns such as consideration of what is necessary to protect public safety can be used to lessen a sentence at the outset of its imposition from that otherwise permitted by retribution, it seems reasonable that ongoing utilitarian concerns could justify reducing the actual time being served in prison below that which retribution might otherwise dictate. Parole boards take public safety into consideration in determining whether to release someone who has received an indeterminate sentence before they have served their maximum sentence. In addition, many states and the federal government contain provisions that permit early release before a sentence is fully served, including for purposes of compassionate release or medical parole.[219]
In the case of serious violent crimes committed by older persons, it might be troubling from a retributive, as well as fairness, perspective if offenders were to escape punishment simply by virtue of age and associated frailty. But once retributive values have been acknowledged, for example because a prison sentence has been imposed and part of it served, there seems to be little basis for insisting that retribution should dictate continued incarceration regardless of other considerations.
It is important to underscore a point that opponents of early release often overlook: prison is not the only form of punishment that serves retributive purposes. Retribution can be furthered through punishment short of incarceration: for example, if an offender is conditionally released from prison subject to specific restrictions that limit his freedom and to supervision by a parole officer.
Incapacitation
Incarceration protects public safety by “incapacitating” the inmate, that is, by preventing him from committing crimes in the community. But for older offenders who are declining physically and mentally, incarceration may have little or no added incapacitation value. As noted above, age is inversely correlated with criminal conduct. There are exceptions, of course, and incapacitation may be still be necessary for some older offenders, including those who offend at an older age. But many corrections officials have told us their prisons confine men and women who, by virtue of age, are too feeble or impaired to commit another crime even if they wanted to. Moreover, while there is a theoretical possibility that an old and dying man might commit a crime were he released to his family or a nursing home in the community, such negligible threats as he might pose could be addressed through restrictions on his liberty short of incarceration.
Deterrence
Another utilitarian and crime-prevention goal of punishment is to deter future crime by the individual being sentenced (specific deterrence) as well as by others (general deterrence). With regard to specific deterrence, the same concerns noted above regarding incapacitation apply. Continued incarceration has scant deterrent impact on the older offender who, by virtue of age and infirmity, already poses a negligible threat of reoffending.
Requiring people to remain in prison until the end of their sentence regardless of age and infirmity has no demonstrable general deterrent effect. The theory of general deterrence assumes prospective offenders know the specific sentences for particular crimes, that they engage in a rational cost-benefit analysis of their actions before acting, and that the more severe a sentence is the more likely they are not to commit the crime. It is by no means clear that increasing the length of sentences increases the deterrent effect.[220] But even if the increased severity of the punishment in some situations has increased deterrence value, it does not seem particularly likely that such an effect would come from requiring older offenders to remain in prison into their dotage. It is hard to believe, for example, that a person about to commit murder because of overwhelming rage would desist from the crime because of the possibility that if caught and convicted he might be required to serve not just a long sentence, but one that would keep him in prison even after he has Alzheimer’s disease. In addition, even if there were a deterrent effect from keeping people in prison despite their age and infirmity, there would still be the question of whether the benefits from crime reduction from such deterrence outweigh the costs of incarcerating the old and infirm.[221]
Punishment also promotes crime prevention by communicating society’s condemnation of particular conduct, and thus helps to reinforce (or create) norms of conduct. We are aware of no research that shows that the effective condemnation of crime requires the continued incarceration of prisoners who have become old and infirm.
Rehabilitation
The final commonly cited purpose of criminal punishment is to promote rehabilitation and reintegration into society. The rehabilitation of incarcerated offenders is not just good penal policy that will enhance the ability of former prisoners to lead productive, law-abiding lives.[222] Efforts to rehabilitate prisoners are also required by human rights law. After providing that “All persons deprived of their liberty shall be treated with humanity and with respect for the inherent dignity of the human person,”[223] the International Covenant on Civil and Political Rights (ICCPR), ratified by the United States, further mandates that “The penitentiary system shall comprise treatment of prisoners the essential aim of which shall be their reformation and social rehabilitation.”[224]
Adults can grow and change markedly while incarcerated, especially if rehabilitative programs and opportunities for acquiring new skills and self-knowledge are provided. But it is unlikely that additional rehabilitation is achieved by continuing a prisoner’s incarceration into advanced old age. For an 80-year-old who has been in prison for 25 years and has already participated in whatever educational and skills-building courses were available, more time in prison will not contribute measurably to his reformation. Indeed, what is the rehabilitative potential for a person who has dementia who no longer knows why she is in prison, or even that she is in prison? While there may be exceptions in individual cases, as a general matter it is hard to understand how the goal of rehabilitation is furthered by the continued incarceration of geriatric or dying prisoners.
We note finally that there is a growing view among human rights experts that sentences which by their very terms preclude the possibility of reintegration into society constitute inhuman and degrading treatment.[225] As stated by the dissenting judges in a recent European Court of Human Rights case, “Once it is accepted that the legitimate requirements of the sentence entail reintegration, questions may be asked as to whether a term of imprisonment that jeopardizes that aim is not in itself capable of constituting inhuman and degrading treatment.”[226] These arguments are typically raised in the context of life sentences. But even sentences short of life—for example, those that are measured in decades—can frustrate the goal of reintegration, as can sentences of any length that take offenders to death’s doorstep. If respect for human dignity requires giving each offender the possibility of rejoining society, that may mean releasing the old and infirm into a less restrictive form of punishment before their full prison sentence is served.
Respect for human dignity and human rights is not guaranteed, however, simply by releasing an aging and infirm offender from prison. It is one thing, for example, to release an old and frail woman to a loving family willing to take care of her in her waning days. But men and women who have spent many years behind bars may no longer have family or friends to care for them. They might prefer remaining with the community they have in prison than being released to a nursing home. In addition, abuse and neglect of the elderly in some nursing homes make it clear that the well-being of nursing home residents cannot be taken for granted.[227] Corrections officials must exercise care to ensure that prisoners released to nursing homes will receive appropriate care. They must also ensure that older prisoners are not released to homelessness. Aging persons—even those convicted of serious crimes—have a right to lives free of mistreatment and poor care wherever and however long they live.
Conclusion
Absent significant changes in sentencing and release policies, the number of aging and infirm men and women confined in US prisons will continue to grow.
The rising tide of aging prisoners in the United States makes imperative renewed and careful thinking about how to protect the rights of the elderly while in prison, and about how age and infirmity can render continued incarceration a violation of human rights. Wholly apart from human rights considerations, however, states and the federal government should question whether the continued incarceration of those who are well advanced in age and are infirm is a sensible use of limited financial and human resources.
Acknowledgments
Jamie Fellner, senior advisor in the US Program at Human Rights Watch, researched and wrote this report. Dr. Patrick Vinck, a research scientist currently with the Harvard School of Public Health and associate faculty member at the Harvard Humanitarian Initiative compiled and analyzed the 2009 state prison admissions, population, and sentence length data presented here that was obtained from the National Corrections Reporting Program for 2009 (the exceptions are noted in the text). We are extremely grateful for his contributions to this report, as we have been for his contributions to previous Human Rights Watch reports.
Abigail Marshak, former US Program associate and currently a law student at Georgetown University, provided additional research on prison sentences and time served. Vikram Shah and Elena Vanko, US program associates, and Mitchel Pardes, US Program intern, also provided research assistance on countless issues. Janet Schulze and Jessamyn Tonry, summer interns at HRW, provided additional legal research.
The report was edited by Alison Parker, US program director, and Joe Saunders, deputy program director. Dinah PoKempner provided legal review. Shanta Rau Barriga, researcher/advocate for disability rights, also reviewed the report. Vikram Shah provided editing and production assistance. Anna Lopriore, creative manager, Grace Choi, publications director, and Fitzroy Hepkins, mail manager, ensured the smooth production of the final report.
This report reflects insight and information gleaned from interviews with hundreds of corrections officials, incarcerated persons, medical staff, advocates, academics, consultants, and other prison experts over the course of a year of research. Although there are too many to name individually, each made an important contribution to our work. We are especially grateful to the many incarcerated men and women who were willing to share their experiences with us. We also wish acknowledge with gratitude the following officials for helping arrange Human Rights Watch visits to prisons in their states: Steve Stone and Terry Thornton, California Department of Corrections and Rehabilitation; Alison Morgan, Colorado Department of Corrections; Dr. James Degroot, Georgia Department of Corrections; Dr. Gloria Perry, Mississippi Department of Corrections; Dr. Carl J. Koenigsmann, New York Department of Corrections and Community Supervision; Stuart Hudson, Ohio Department of Rehabilitation and Correction; Roberta Richman, Rhode Island Department of Corrections; and Rowlanda Caython, Washington Department of Corrections. In addition, Mike Lawlor, Connecticut Office of Policy and Management helped secure visits for us with state corrections medical and planning personnel. As is consistent with our practice when reporting on prison conditions, we use pseudonyms for offenders to protect against the possibility of intimidation or retaliation.
We also want to express our gratitude for the guidance provided to us by Dr. Brie Williams, assistant professor of medicine in the Division of Geriatrics at the University of California, San Francisco, and to thank Dr. Robert Greifinger for organizing the inspirational Leadership Symposium in Correctional Health Care focused on elderly inmates.
We wish to thank Peter B. Lewis for his generous support of the US Program that made this report possible.
Appendix: Additional Tables
Table A.1: Gender and Age of State Prisoners, December 31, 2009
|
<55 |
Percent <55 |
≥55 |
Percent ≥55 |
Total |
Percent of total |
Percent ≥55 in gender group |
|
|
Male |
816,997 |
92.9% |
65,672 |
95.5% |
882,669 |
93.1% |
7.4% |
|
Female |
62,756 |
7.1% |
3,092 |
4.5% |
65,848 |
4.5% |
4.7% |
|
Total |
879,753 |
100% |
68,764 |
100% |
948,517 |
100% |
7.2% |
Source: National Corrections Reporting Program. Note: Based on 24 states reporting prison populations for year-end 2009.
Table A.2: Race and Age of State Prisoners, December 31, 2009
|
<55 |
Percent <55 |
≥55 |
Percent ≥55 |
Total |
Percent of total |
Percent ≥55 in racial group |
|
|
White |
324,368 |
39.9% |
34,750 |
53.7% |
359,118 |
40.9% |
9.7% |
|
Black |
391.705 |
48.2% |
25,333 |
39.1% |
417,038 |
47.5% |
6.1% |
|
Other |
96,812 |
11.9% |
4,640 |
7.2% |
101,461 |
11.6% |
4.6% |
|
Total |
812,894 |
100% |
64,723 |
100% |
877,617 |
100% |
7.4% |
Source: National Corrections Reporting Program. >Note: Based on 24 states reporting year-end prison populations for 2009. Hispanics are included among the racial categories.
Table A.3: State Prisoners by Age, 2009
|
<55 |
≥55 |
≥60 |
≥65 |
≥70 |
≥75 |
|
|
Alaska |
92.9% |
7.1% |
3.2% |
1.7% |
0.5% |
0.2% |
|
Arkansas |
93.3% |
6.7% |
3.0% |
1.2% |
0.5% |
0.3% |
|
California |
92.5% |
7.5% |
3.4% |
1.5% |
0.6% |
0.2% |
|
Colorado |
93.4% |
6.6% |
3.2% |
1.3% |
0.5% |
0.2% |
|
Connecticut |
95.8% |
4.2% |
1.8% |
0.8% |
0.3% |
0.1% |
|
Florida |
92.2% |
7.8% |
3.7% |
1.6% |
0.7% |
0.3% |
|
Georgia |
92.6% |
7.4% |
3.6% |
1.8% |
1.1% |
0.7% |
|
Iowa |
93.0% |
7.0% |
3.4% |
1.6% |
0.7% |
0.3% |
|
Louisiana |
92.7% |
7.3% |
3.1% |
1.4% |
0.5% |
0.2% |
|
Maryland |
93.9% |
6.1% |
2.8% |
1.1% |
0.4% |
0.2% |
|
Minnesota |
94.3% |
5.7% |
2.5% |
1.1% |
0.5% |
0.2% |
|
Missouri |
93.5% |
6.5% |
2.9% |
1.3% |
0.5% |
0.2% |
|
New York |
93.2% |
6.8% |
3.2% |
1.4% |
0.6% |
0.2% |
|
North Carolina |
93.8% |
6.2% |
2.8% |
1.1% |
0.4% |
0.1% |
|
North Dakota |
95.0% |
5.0% |
2.1% |
0.9% |
0.3% |
0.2% |
|
Oklahoma |
92.6% |
7.4% |
3.5% |
1.5% |
0.5% |
0.1% |
|
Oregon |
90.1% |
9.9% |
5.2% |
2.8% |
1.2% |
0.5% |
|
Pennsylvania |
92.1% |
7.9% |
3.8% |
1.6% |
0.6% |
0.2% |
|
Rhode Island |
92.6% |
7.4% |
3.5% |
1.6% |
0.8% |
0.3% |
|
South Carolina |
94.0% |
6.0% |
2.7% |
1.0% |
0.3% |
0.1% |
|
Tennessee |
93.4% |
6.6% |
2.9% |
1.2% |
0.4% |
0.2% |
|
Texas |
92.2% |
7.8% |
3.5% |
1.5% |
0.5% |
0.2% |
|
Virginia |
93.0% |
7.0% |
3.1% |
1.3% |
0.5% |
0.2% |
|
Washington |
92.9% |
7.1% |
3.7% |
1.7% |
0.7% |
0.3% |
|
Total |
92.8% |
7.2% |
3.4% |
1.5% |
0.6% |
0.2% |
Source: National Corrections Reporting Program. Note: Data is based on prisoners at year-end.
Table A.4: Number of State Prisoners by Age, 2009
|
< 55 |
≥ 55 |
Total |
Percent ≥ 55 in State |
|
|
Alaska |
3,402 |
260 |
3,662 |
7.1% |
|
Arkansas |
15,420 |
1,110 |
16,530 |
6.7% |
|
California |
157,511 |
12,797 |
170,308 |
7.5% |
|
Colorado |
19,956 |
1,402 |
21,358 |
6.6% |
|
Connecticut |
17,298 |
754 |
18,052 |
4.2% |
|
Florida |
93,526 |
7,911 |
101,437 |
7.8% |
|
Georgia |
50,731 |
4,082 |
54,813 |
7.4% |
|
Iowa |
7,822 |
586 |
8,408 |
7.0% |
|
Louisiana |
36,193 |
2,851 |
39,044 |
7.3% |
|
Maryland |
20,671 |
1,346 |
22,017 |
6.1% |
|
Minnesota |
8,503 |
513 |
9,016 |
5.7% |
|
Missouri |
28,511 |
1,996 |
30,507 |
6.5% |
|
New York |
53,935 |
3,925 |
57,860 |
6.8% |
|
North Carolina |
37,278 |
2,450 |
39,728 |
6.2% |
|
North Dakota |
1,429 |
75 |
1,504 |
5.0% |
|
Oklahoma |
23,606 |
1,875 |
25,481 |
7.4% |
|
Oregon |
13,157 |
1,448 |
14,605 |
9.9% |
|
Pennsylvania |
47,409 |
4,084 |
51,493 |
7.9% |
|
Rhode Island |
1,974 |
157 |
2,131 |
7.4% |
|
South Carolina |
22,624 |
1,446 |
24,070 |
6.0% |
|
Tennessee |
25,665 |
1,808 |
27,473 |
6.6% |
|
Texas |
145,225 |
12,255 |
157,480 |
7.8% |
|
Virginia |
33,055 |
2,505 |
35,560 |
7.0% |
|
Washington |
14,854 |
1,128 |
15,982 |
7.1% |
|
Total |
879,755 |
68,764 |
948,519 |
7.2% |
Source: National Corrections Reporting Program. Note: Reflects population at year-end 2009.
Table A. 5: New Admissions to State Prison by Age and Sentence, 2009
|
Age < 55 |
Age ≥ 55 |
Total |
||||
|
Less than 12 months |
62,487 |
21.2% |
2,204 |
20.1% |
64,691 |
21.1% |
|
12-60 months |
165,408 |
56.0% |
5,882 |
53.8% |
171,290 |
56.0% |
|
61-120 months |
41,853 |
14.2% |
1,546 |
14.1% |
43,399 |
14.2% |
|
121-240 months |
16,296 |
5.5% |
772 |
7.1% |
17,068 |
5.6% |
|
> 240 months |
5,848 |
2.0% |
326 |
3.0% |
6,174 |
2.0% |
|
Life without parole |
290 |
0.1% |
18 |
0.2% |
308 |
0.1% |
|
Life plus additional years |
44 |
0.0% |
5 |
0.0% |
49 |
0.0% |
|
Life |
2,933 |
1.0% |
181 |
1.7% |
3,114 |
1.0% |
|
Death |
39 |
0.0% |
5 |
0.0% |
44 |
0.0% |
|
Total |
295,198 |
100.0% |
10,939 |
100.0% |
306,137 |
100.0% |
Source: National Corrections Reporting Program. Note: Based on 30 states reporting prison admissions data for 2009. Data based on admissions with new sentences and do not include returns to prison for technical parole violations. Table does not include 1,554 persons whose age at admission is unknown.
Figure A.1: Proportion of Sentence Served in State Prison for Violent Offenses, 1993-2009
Source: Bureau of Justice Statistics, annual tables from National Corrections Reporting Program Series, 1993-2009
Table A.6: Types of Admissions to State Prison in 2009 by Age
|
< 55 |
≥ 55 |
Age Unknown |
Total |
|
|
New court commitment |
312,124 |
11,564 |
2,446 |
326,134 |
|
95.7% |
3.5% |
0.7% |
100% |
|
|
Parole revocation—new sentence |
8,134 |
305 |
19 |
8,458 |
|
96.2% |
3.6% |
0.2% |
100% |
|
|
Mandatory parole release—new sentence |
20,065 |
671 |
18 |
20,754 |
|
96.7% |
3.2% |
0.1% |
100% |
|
|
Probation revocation—new sentence |
4,806 |
134 |
1 |
4,941 |
|
97.3% |
2.7% |
0.0% |
100% |
|
|
Other (e.g. return on technical parole violation) |
160,626 |
6,452 |
258 |
167,336 |
|
96.0% |
3.9% |
0.2% |
100% |
|
|
Total |
505,755 |
19,126 |
2,742 |
527,623 |
|
95.9% |
3.6% |
0.5% |
100% |
Source: National Corrections Reporting Program. Note: Based on 30 states reporting prison admissions data for 2009.
Table A.7: Admissions to Federal Prison by Age, 2000-2009
|
Age at Admission |
2000 |
2001 |
2002 |
2003 |
2004 |
2005 |
2006 |
2007 |
2008 |
2009 |
|
< 21 years |
3,190 |
3,247 |
2,885 |
2,796 |
2,639 |
2,474 |
2,589 |
2,342 |
2,396 |
2,333 |
|
21-30 years |
25,515 |
26,553 |
26,106 |
27,837 |
28,542 |
29,510 |
29,545 |
26,461 |
26,495 |
26,754 |
|
31-40 years |
20,609 |
20,823 |
21,850 |
23,542 |
24,519 |
26,082 |
26,058 |
24,043 |
23,991 |
25,393 |
|
41-50 years |
10,806 |
11,081 |
11,777 |
12,779 |
13,275 |
14,299 |
14,633 |
13,077 |
12,570 |
13,388 |
|
51-60 years |
3,784 |
3,920 |
4,115 |
4,505 |
4,561 |
4,784 |
4,954 |
4,634 |
4,815 |
4,980 |
|
61-70 years |
880 |
884 |
992 |
1,038 |
1,106 |
1,108 |
1,257 |
1,209 |
1,211 |
1,308 |
|
71-80 years |
100 |
116 |
124 |
155 |
167 |
146 |
172 |
144 |
158 |
158 |
|
> 80 years |
5 |
7 |
8 |
9 |
8 |
9 |
13 |
8 |
11 |
15 |
|
Unknown |
29 |
23 |
20 |
14 |
34 |
29 |
26 |
15 |
16 |
7 |
|
Total |
64,918 |
66,654 |
67,877 |
72,675 |
74,851 |
78,441 |
79,247 |
71,933 |
71,663 |
74,336 |
Source: Bureau of Justice Statistics, Federal Justice Statistics Program. Note: Includes only commitments to federal prison for violations of federal criminal law as of year-end; commitments from the District of Columbia Superior Court are excluded.
Table A.8: Federal Prisoners, by Age and Sentence Length, 2009
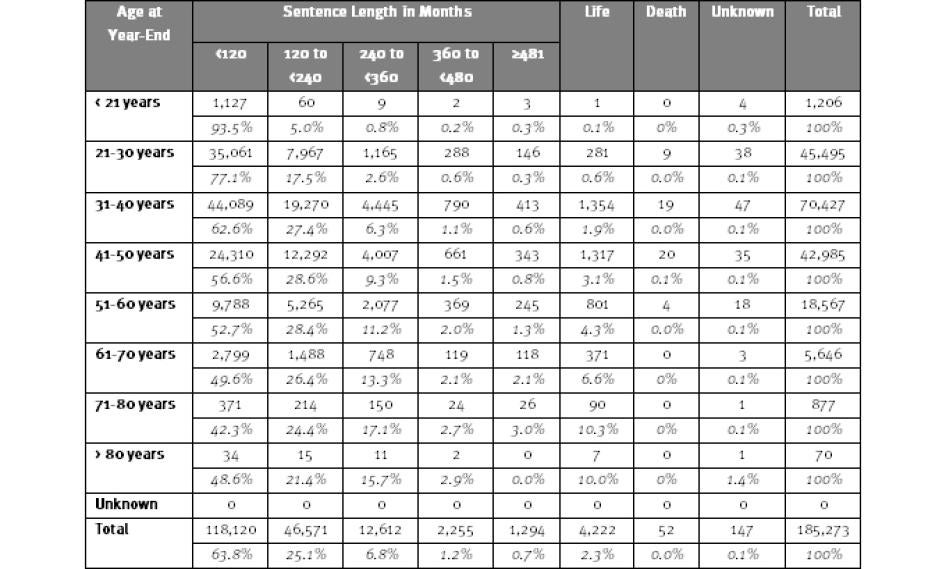
Source: Bureau of Justice Statistics, Federal Justice Statistics Program. Note: Includes only commitments to federal prison for violations of federal criminal law; commitments from the District of Columbia Superior Court are excluded.
[1] In this report we use the terms old, older, elderly, aging, and geriatric interchangeably to refer to people whose physical capabilities and mental acuity are markedly diminished by advancing age, wholly apart from any diseases which may have limited their physical or mental abilities. Nevertheless, because age, illness, and physical and mental disabilities so often overlap, we also use the former terms interchangeably with such terms as “old and infirm.” Similarly, we use the terms incarcerated persons, prisoners, offenders, and inmates interchangeably.
[2] Vera institute of Justice, “It’s About Time: Aging Prisoners, Increasing Costs and Geriatric Release,” 2010, http://www.vera.org/content/its-about-time-aging-prisoners-increasing-costs-and-geriatric-release (accessed November 29, 2011); Jeremy L. Williams, Southern Legislative Conference, “The Aging Inmate Population: Southern States Outlook,” December 2006, http://www.slcatlanta.org/Publications/HSPS/aging_inmates_2006_lo.pdf (accessed November 29, 2011), p. 1. Some states do not have a chronological age cutoff for defining elderly, but rely on degree of disability. B. Jaye Anno et al., US Department of Justice, National Institute of Corrections, “Correctional Health Care: Addressing the Needs of Elderly, Chronically Ill, and Terminally Ill Inmates,” February 2004, http://nicic.gov/library/018735 (accessed December 12, 2011), p. 9, referring to results of a 2001 survey by the Criminal Justice Institute.
[3] Brie Williams and Rita Abraldes, “Growing Older: Challenges of Prison and Reentry for the Aging Population,” in Robert Greifinger, ed., Public Health Behind Bars: From Prisons to Communities (New York: Springer, 2007), p. 56 (internal citations omitted). See also generally, Anno et al., “Correctional Healthcare,” pp. 8-9; and Ronald H. Aday, Aging Prisoners: Crisis in American Corrections (Westport: Praeger, 2003).
[4] In this report, unless otherwise indicated, we use age 55 or above to define prisoners considered “older.”
[5] Calculated from data in Heather C. West and William J. Sabol, Bureau of Justice Statistics, “Prisoners in 2007,” December 2008, http://bjs.ojp.usdoj.gov/content/pub/pdf/p07.pdf (accessed November 29, 2011), Appendix Table 7; Paul Guerino, Paige M. Harrison, and William J. Sabol, Bureau of Justice Statistics, “Prisoners in 2010,” December 2011, http://bjs.ojp.usdoj.gov/index.cfm?ty=pbdetail&iid=2230 (accessed January 12, 2012), Appendix Table 13. The federal Bureau of Justice Statistics annually publishes data on the estimated number of state and federal prisoners by age. The numbers are based on sentenced prisoners under the jurisdiction of state or federal correctional authorities with a sentence of more than one year. 2007 was the first year BJS began breaking out age categories to include prisoners 65 and older. Unless otherwise indicated, all references to federal and state prisoners obtained from BJS annual prisoner reports refer to sentenced prisoners.
[6] In 1979, there were approximately 6,500 state and federal prisoners in the United States age 55 years or older. Herbert J. Hoelter, National Center on Institutions and Alternatives, “Imprisoning Elderly Offenders: Public Safety or Maximum Security Nursing Homes, Executive Summary,” December 1998, p. 2.
[7] Allen J. Beck and Paige M. Harrison, Bureau of Justice Statistics, “Prisoners in 2003,” November 2004, http://bjs.ojp.usdoj.gov/content/pub/pdf/po3.pdf (accessed December 14, 2011), Table 10 (for 1995 figures).
[8] Guerino, Paige, and Sabol, “Prisoners in 2010,” Appendix Table 13.
[9] The number of prisoners age 55 or older in 1996 not available from Bureau of Justice Statistics. The number of prisoners 55 or older is in Beck and Harrison, “Prisoners in 2003,” Table 10, November 2004.
[10] The growth in older prisoners appears to be accelerating. In the five years between 1995 and 2000, the number of state and federal prisoners age 55 or older grew by 35.6 percent. But in the ten years between 2000 and 2010, the number of state and federal prisoners age 55 or older almost tripled, growing by 180 percent. The total prison population increased only 15 percent during that latter period.
[11] Calculated from data in Allen J. Beck and Paige M. Harrison, Bureau of Justice Statistics, “Prisoners in 2000,” August 2001, http://bjs.ojp.usdoj.gov/index.cfm?ty=pbdetail&iid=927 (accessed December 12, 2011), Table 14; Guerino, Paige, and Sabol, “Prisoners in 2010,” Appendix Table 13.
[12] West and Sabol, “Prisoners in 2007,” Appendix Table 8; Guerino, Harrison, Sabol, “Prisoners in 2010,” Table 15. International rates of incarceration can be found in Roy Walmsley, International Centre for Prison Studies, King’s College London, “World Prison Population List (eighth edition),” January 2009, http://www.kcl.ac.uk/depsta/law/research/icps/downloads/wppl-8th_41.pdf (accessed July 22, 2011).
[13] Table A.1, “Gender and Age of State Prisoners, December 31, 2009,” in Appendix: Additional Tables below. We calculated state prisoners by age and gender from data obtained from the National Corrections Reporting Program (NCRP) for 2009. See Methodology section above. The gender of state prisoners in 2010 comes from estimates in Guerino, Harrison, and Sabol, “Prisoners in 2010,” Appendix Table 16A. The differences in the gender demographics for older state prisoners compared to the total state prison population may be a result of the smaller number of states included in the NCRP data than that used by the BJS, as well as the methodology used by BJS to calculate its population estimates.
[14] Table A.2, “Race and Age of State Prisoners, December 31, 2009” in Appendix: Additional Tables, below. We calculated state prisoner populations by age and race using data obtained from National Corrections Reporting Program for 2009. See Methodology section, above. The race of state prisoners in 2010 comes from Guerino, Harrison and Sabol “Prisoners in 2010,” Appendix Table 16A. The differences in the racial demographics for older state prisoners compared to the total state prison population may be a result of the smaller number of states included in the NCRP data than that used by BJS as well as the methodology used by BJS to calculate its population estimates.
[15] See Table A.3, in Appendix: Additional Tables, below. Table A.4 in Appendix: Additional Tables provides the number of prisoners by age at year-end 2009 in each of the states reporting data to the NCRP.
[16] Data provided to Human Rights Watch in email correspondence with David Runnels, California Correctional Health Care Services, May 6, 2011.
[17] Unpublished data obtained through Freedom of Information Act request by Human Rights Watch in email correspondence with New York Department of Corrections and Community Supervision, June 13, 2011.
[18] Data provided to Human Rights Watch by Maureen O’Keefe, Colorado Department of Corrections, March 25, 2011.
[19] State of Florida Correctional Medical Authority, “2009-2010 Annual Report and Report on Aging Inmates,” December 2010, http://www.doh.state.fl.us/cma/reports/AnnualRpt2009-10FINAL.pdf (accessed November 29, 2011).
[20] Tim Carr, Georgia Department of Corrections, “Age and mental health trends in the Georgia prison system, 1980-2011,” dated June 24, 2011, unpublished internal analysis on file with Human Rights Watch.
[21] Missouri Department of Corrections, “Annual Report 2010,” http://doc.mo.gov/documents/publications/AR2010.pdf (accessed November 29, 2011), p. 3. See also, Missouri Department of Corrections, “A Profile of the Institutional and Supervised Offender Population on June 30, 2010,” December 30, 2010, http://doc.mo.gov/documents/publications/Offender%20Profile%20FY10.pdf (accessed November 29, 2011); Jessica Pupovac, “Missouri’s aging inmate population straining state budget,” Columbia Missourian, January 27, 2011, http://www.columbiamissourian.com/stories/2011/01/27/caring-old-cons-missouris-aging-inmate-population-straining-state-budget/ (accessed December 29, 2011).
[22] Data provided to Human Rights Watch by Francisco Pineda, warden, Hocking Correctional Facility, Nelsonville, Ohio, during Human Rights Watch visit, May 1, 2011.
[23] Gregory T. Geisler, “The Cost of Correctional Health Care: A Correctional Institution Inspection Committee Summary of Ohio’s Prison Health Care System,” 2010, http://www.ciic.state.oh.us/download-document/222-cost-of-correctional-health-care-2010.html (accessed January 12, 2012), p.9.
[24] Williams, “The Aging Inmate Population,” p. 9.
[25] Virginia Department of Corrections and Parole Board, “A Balanced Approach: Report on Geriatric Offenders,” 2008, http://sfc.virginia.gov/pdf/Public%20Safety/September%2024%20mtg/Final%20Geriatric% 20Report%20for%20Item%20387-B%20incl.%20Ex.pdf (accessed December 12, 2011), p. 3.
[26] Lauren E. Glaze, Bureau of Justice Statistics, “Correctional Population in the United States, 2010,” December 2011, http://bjs.ojp.usdoj.gov/content/pub/pdf/cpus10.pdf (accessed January 9, 2012), Table 1.
[27] As a result of such changes, the percentage of a sentence actually served behind bars today is considerably greater than it was previously. For example, in 1993, only 25 percent of the median sentence for all offenses was served before release; in 2009, 44 percent of the median sentence was served before release. Bureau of Justice Statistics, “First releases from State prison, 1993” and “First releases from State prison, 2009,” part of the National Corrections Reporting Program series, http://bjs.ojp.usdoj.gov/index.cfm?ty=pbdetail&iid=2056 (accessed November 4, 2011).
[28] Human Rights Watch interview with Samuel Edison (pseudonym), Colorado Territorial Correctional Facility, Cañon City, Colorado, March 22, 2011.
[29] Data regarding Sheldon Thompson (pseudonym) provided to Human Rights Watch by Michigan Department of Corrections in 2004, and cross-checked against Michigan’s inmate locator on December 8, 2011.
[30] The Bureau of Justice Statistics of the US Department of Justice is in the midst of a project to answer that question; its report will be published sometime during 2012.
[31] Percentages are based on 24 states reporting year-end population data to the NCRP for 2009. The states provided sentence lengths for 82.5 percent of all reported prisoners. In the calculations by Human Rights Watch using the NCRP data, when prisoners were sentenced to a range of years, the maximum sentence is used. Where prisoners were serving multiple sentences for different charges, the longest of the sentences was used.
[32] Data on admissions with new sentences (excluding technical parole revocations) and length of sentence based on 24 states reporting year-end population data to the National Corrections Reporting Program for 2009. Where prisoners were sentenced to a range of years, the maximum sentence is used. Where prisoners were serving multiple sentences for different charges, the longest of the sentences was used. States participating in the National Corrections Reporting Program in 2009 provided sentence lengths for 85.4 percent of state prisoners they reported for 2009.
[33] Table A.5 in Appendix: Additional Tables below provides data on the length of sentences received by persons entering state prison in 2009 with new sentences (excluding technical parole revocations).
[34] Families Against Mandatory Minimums, “Federal Profiles: Weldon Angelos,” http://www.famm.org/ProfilesofInjustice/FederalProfiles/WeldonAngelos.aspx (accessed November 29, 2011). FAMM’s website provides profiles of many other cases.
[35] Families Against Mandatory Minimums, “Federal Profiles: Barbara Scrivner,” http://www.famm.org/ProfilesofInjustice/FederalProfiles/BarbaraScrivner.aspx (accessed November 29, 2011).
[36] Families against Mandatory Minimums, “Federal Profiles: Atiba Parker,” http://www.famm.org/ProfilesofInjustice/StateProfiles/AtibaParker.aspx (accessed November 29, 2011).
[37] About half of states have some form of “three strikes” legislation. None have used them as extensively as California, which also has the most punitive of the strikes laws. Under California’s three strikes law, if the offender had two prior serious or violent felony convictions, the mandatory sentence for a third conviction, even for a nonviolent felony, is 25 years to life.
[38] Ryan S. King and Marc Mauer, The Sentencing Project, “Aging Behind Bars: ‘Three Strikes’ Seven Years Later,” August 2001, http://www.sentencingproject.org/detail/publication.cfm?publication_id=73 (accessed November 29, 2011).
[39] Families to Amend California's Three Strikes, “About 3 Strikes,” http://facts1.live.radicaldesigns.org/section.php?id=55 (accessed November 29, 2011).
[40] Lockyer v. Andrade, United States Supreme Court, 538 U.S. 63 (2003).
[41] Human Rights Watch interview with Bonnie Frampton (pseudonym), Denver Women’s Correctional Facility, Denver, Colorado, March 21, 2011.
[42] Human Rights Watch interview with Constance Wooster (pseudonym), Denver Women’s Correctional Facility, Denver, Colorado, March 21, 2011.
[43] Human Rights Watch interview with Ted Coombs (pseudonym), Coyote Ridge Corrections Center, Connell, Washington, August 8, 2011.
[44] Figures on release reflect time to first release. Prisoners may be released initially, then returned to prison for violating parole and then released again after serving more time in prison. Sentence length based on the maximum sentence imposed; if offender received multiple sentences, the longest sentence is used. Data excludes sentences to life without parole, life with additional years, life, or death. The data was calculated using numbers from Table 9 in the 1993 through 2009 reports of the Bureau of Justice Statistics, “Time served in state prison, by offense, release type, sex, and race, 1993-2009” National Corrections Reporting Program, http://bjs.ojp.usdoj.gov/content/dtdata.cfm (accessed November 1, 2011).
[45] Ibid.
[46] For some crimes the increase was even greater. For example, the percentage of sentences served for murder has increased from 42 percent in 1993 to 75 percent in 2009. See Figure A.1 in Appendix: Additional Tables. Time until release reflects time to first release. Prisoners may be released initially, then returned to prison for violating parole and then released again after serving more time in prison. Sentence length is based on the maximum sentence imposed; if an offender received multiple sentences, the longest sentence is used. Data excludes sentences to life without parole, life with additional years, life, or death. The data was calculated using numbers from Table 9 in the 1993 through 2009 reports of the Bureau of Justice Statistics, “Time served in state prison, by offense, release type, sex, and race, 1993-2009” National Corrections Reporting Program, http://bjs.ojp.usdoj.gov/content/dtdata.cfm (accessed November 1, 2011).
[47] Data provided to Human Rights Watch during interview with Brian Fisher, commissioner, New York Department of Corrections and Community Supervision, Albany, New York, August 31, 2011.
[48] Pennsylvania Department of Corrections, “Elderly Inmate Profile,” December 10, 2003, http://www.portal.state.pa.us/portal/server.pt/document/916134/elderlyinmateprofile_pdf?qid=84214885&rank=1 (accessed November 29, 2011).
[49] Charlotte Price, North Carolina Department of Correction, “Aging Inmate Population Study,” May 2006, http://www.doc.state.nc.us/dop/Aging%20Study%20Report.pdf (accessed November 29, 2011), p. 4.
[50] Williams, “The Aging Inmate Population,” p. 28.
[51] Ibid.
[52] “Life without parole” is the most common terminology for sentences of life without possibility of release, but other terms include “natural life,” “true life,” or “whole life.”
[53] Ashley Nellis and Ryan S. King, The Sentencing Project, “No Exit: The Expanding Use of Life Sentences in America,” July 2009, http://www.sentencingproject.org/doc/publications/publications/inc_noexitseptember2009.pdf (accessed November 29, 2011), p. 7.
[54] Data regarding federal prisoners comes from the Bureau of Justice Statistics Federal Justice Statistics Program, http://bjs.ojp.usdoj.fjsrc (accessed July 7, 2011). This online statistical tool provides public access to data regarding federal prisoners sorted according to a number of variables, including year, age, and offense. The data here includes only persons committed to federal prison upon conviction of violating federal law (not including persons committed from the District of Columbia Superior Court). It does not include persons held for immigration law violations pending deportation.
[55] Based on the 24 states who reported year-end population data for 2009 to the National Corrections Reporting Program.
[56] Nellis and King, “No Exit,” p. 7.
[57] Table A.5 in Appendix: Additional Tables . Data comes from 30 states reporting 2009 admissions data to the National Corrections Reporting Program.
[58] Nellis and King, “No Exit,” p. 6. The range of time before eligibility for release varies from 10 years in Utah to 40 and 50 years in Colorado and Kansas, respectively.
[59] Marc Mauer, Ryan D. King, and Malcolm C. Young, The Sentencing Project, “The Meaning of ‘Life’: Long Prisons Sentences in Context,” May 2004, http://www.sentencingproject.org/doc/publications/inc_meaningoflife.pdf (accessed November 29, 2011), p. 12. This is an increase from the estimated 21.2-year time to be served by lifers who entered prison in 1991.
[60] Numbers on prisoners by age at admission and sentence length based on prison population data provided by 24 reporting states to the NCRP in 2009. See Methodology section, above.
[61] See for example, Nellis and King, “No Exit”; and Mauer, King, and Young, “The Meaning of ‘Life’.”
[62] See for example, Adam Liptak, “To More Inmates, Life Term Means Dying Behind Bars,” The New York Times, October 2, 2005, http://www.nytimes.com/2005/10/02/national/02life.web.html (accessed December 29, 2011). See The American Law Institute, “Model Penal Code: Sentencing, Tentative Draft No. 2,” March 25, 2011, for a severe criticism of the exercise by parole boards of their release discretion.
[63] In four states, governors may review the decision-making by the parole board. A study of parole decision-making in California found that the likelihood of a lifer convicted of murder being granted parole by the parole board and not having the decision reversed by the Governor was slim: about a 6 percent probability. Robert Weisberg, Debbie A. Mukamal, and Jordan D. Segall, Stanford Criminal Justice Center, “Life in Limbo: An Examination of Parole Release for Prisoners Serving Life Sentences with the Possibility of Parole in California,” September 2011, http://blogs.law.stanford.edu/newsfeed/files/2011/09/SCJC_report_Parole_Release_for_Lifers.pdf (accessed November 29, 2011), p.4.
[64] Data based on population and sentences by 24 states to the National Corrections Reporting Program for 2009. The total number of prisoners serving life sentences among all 50 states would be higher.
[65] Nellis and King, “No Exit,” p. 10.
[66] Information provided to Human Rights Watch in email correspondence with Paula Butler, deputy superintendent health services, Fishkill Correctional Facility, New York Department of Corrections and Community Supervision, November 2, 2011.
[67] Human Rights Watch interview with William Conrad (pseudonym), Mississippi State Penitentiary, Parchman, Mississippi, June 15, 2011.
[68] Human Rights Watch, World Report 2012 (New York: Human Rights Watch, 2012), United States chapter, http://www.hrw.org/world-report-2012-united-states; Human Rights Watch, “State Distribution of Youth Offenders Serving Juvenile Life Without Parole (JLWOP),” October 2, 2009, http://www.hrw.org/news/2009/10/02/state-distribution-juvenileoffenders-serving-juvenile-life-without-parole.
[69] In 2010, for example, 426,680 persons age 55 or older were arrested, accounting for 4.2 percent of all arrests; a decade earlier 360,350 people that age were arrested, accounting for 2.6 percent of all arrests. Howard Snyder and Joseph Mulako-Wangota, Bureau of Justice Statistics, “Arrests by Age in the U.S., 2009 and 2000,” and “Arrests by Age in the U.S., 1993,” Arrest Data Analysis Tool, http://bjs.ojp.usdoj.gov/index.cfm?ty=datool&surl=/arrests/index.cfm (accessed November 4, 2011). In 1993, people 55 and over accounted for 2.4 percent of arrests.
[70] People are admitted to prison for various reasons. Persons who enter as “new court commitments” have been convicted and sentenced by a court, usually to a term of more than one year. The category also includes probation violators and persons with a split sentence to incarceration followed by court-ordered probation or parole. People can also enter prison when they are being returned there for violating the conditions of parole (technical parole violators) or for new crimes committed while on conditional release. States are not consistent in how they classify admissions. According to our analysis of NCRP admissions data for 2009, about 61 percent of admissions to prison are new court commitments. See Table A.6 in Appendix: Additional Tables, below.
[71] Data in Table 7 calculated from Bureau of Justice Statistics, National Corrections Reporting Program Series, “Most serious offense of state prisoners, by offense, admission type, age, sex, race, and Hispanic origin, Table 1, (1993-2009),” http://bjs.ojp.usdoj.gov/index.cfm?ty=pbdetail&iid=2174 (accessed January 2, 2012).
[72] State of Florida Correctional Medical Authority, “2009-2010 Annual Report and Report on Aging Inmates,” December 2010, http://www.doh.state.fl.us/cma/reports/AnnualRpt2009-10FINAL.pdf (accessed December 13, 2011), p. 51.
[73] Missouri Department of Corrections, “Aging Offenders Management Team Report,” September 2009, p. 5.
[74] Unpublished data obtained through Freedom of Information Act request by Human Rights Watch in email correspondence with New York Department of Corrections and Community Supervision, June 13, 2011.
[75] Ohio Department of Rehabilitation and Correction, “Calendar Year 2010 Commitment Report,” and “Calendar Year 2000 Commitment Report,” http://www.drc.ohio.gov/web/Reports/reports12.asp (accessed July 12, 2011).
[76] Virginia Department of Corrections and Parole Board, “A Balanced Approach: Report on Geriatric Offenders,” 2008, p. 3.
[77] In 2010, there were 209, 771 prisoners under the jurisdiction of federal authorities, more than in California and Texas, which are the largest state prison systems. Guerino, Harrison, and Sabol, “Prisoners in 2010, Appendix Table 2.
[78] The percentage of the federal prison population that was age 51 or older increased from 11 percent in 2000 to 13.6 percent in 2009. Data regarding federal prisoners was obtained from the Bureau of Justice Statistics Federal Justice Statistics Program, http://bjs.ojp.usdoj.gov/fjsrc (accessed July 7, 2011). This online statistical tool provides public access to data regarding federal prisoners sorted according to a number of variables, including year, age, sentence, and offense. The data here includes only persons committed to federal prison upon conviction of violating federal law (not including persons committed from the District of Columbia Superior Court). It does not include persons held for immigration law violations pending deportation.
[79] Data regarding federal prisoners come from the BJS Federal Justice Statistics Program, http://bjs.ojp.usdoj.fjsrc.
[80] See Table A.7 in Appendix: Additional Tables below.
[81] See Table A.8 in Appendix: Additional Tables below.
[82] Data regarding federal prisoners was obtained from the Bureau of Justice Statistics Federal Justice Statistics Program, http://bjs.ojp.usdoj.gov/fjsrc.
[83] International Covenant on Civil and Political Rights (ICCPR), adopted December 16, 1966, G.A. Res. 2200A (XXI), 21 U.N. GAOR Supp. (No. 16) at 52, U.N. Doc. A/6316 (1966), 999 U.N.T.S. 171, entered into force March 23, 1976, arts. 7 and 10; International Covenant on Economic, Social and Cultural Rights (ICESCR), adopted December 16, 1966, G.A. Res. 2200A (XXI), 21 U.N. GAOR Supp. (No. 16) at 49, U.N. Doc. A/6316 (1966), 993 U.N.T.S. 3, entered into force January 3, 1976, art. 12; Convention against Torture and Other Cruel, Inhuman or Degrading Treatment or Punishment (Convention against Torture), adopted December 10, 1984, G.A. res. 39/46, annex, 39 U.N. GAOR Supp. (No. 51) at 197, U.N. Doc. A/39/51 (1984), entered into force June 26, 1987, art. 16; Convention on the Rights of Persons with Disabilities (CRPD), adopted December 13, 2006, G.A. Res. 61/106, Annex I, U.N. GAOR, 61st Sess., Supp. (No. 49) at 65, U.N. Doc. A/61/49 (2006), entered into force May 3, 2008.
[84] On the other hand, many chronically and terminally ill inmates are not elderly. Regardless of age, any prisoner who has serious medical conditions requires different conditions of confinement than those provided a healthy prisoner.
[85] In the course of research for this report, Human Rights Watch did not visit any prisons that, for example, approximated the “deplorable” conditions of overcrowding and substandard medical care alleged to have occurred at Alabama’s Hamilton Aged and Infirm Correctional Facility. According to the class action complaint filed by the Southern Center for Human Rights, the Hamilton facility was severely overcrowded and lacked appropriate medical staff to care for a population of elderly, disabled, and severely ill men. The facility lacked adequate emergency or acute medical care; prisoners experienced lengthy delays in receiving medical care for serious medical conditions; and prisoners with disabilities, “including those suffering from Alzheimer’s, dementia, or blindness” as well as mobility impairments were denied the necessary accommodations and assisted living. Aris v. Campbell, First Amended Complaint, Civil Action No. 05-PWG-396-e, June 2005. In February 2007, the court ruled plaintiffs had failed to establish violations of their constitutional rights. The First Amended Complaint and judgment are on file at Human Rights Watch.
[86] The United States does not have an official set of specific principles or rules for prison operations. The principles and outlines for such a regime are more fully developed—in theory at least—in Europe. See, Dirk van Zyl Smit and Sonja Snacken, Principles of European Prison Law and Policy: Penology and Human Rights (New York: Oxford University Press, 2009). See also United Nations Standard Minimum Rules for the Treatment of Prisoners (Standard Minimum Rules), adopted by the First United Nations Congress on the Prevention of Crime and the Treatment of Offenders, held at Geneva in 1955, and approved by the Economic and Social Council by its resolution 663 C (XXIV) of July 31, 1957, and 2076 (LXII) of May 13, 1977; European Committee for the Prevention of Torture and Inhuman or Degrading Treatment or Punishment, “The CPT Standards, ‘Substantive’ sections of the CPT’s General Reports,” CPT/Inf/E (2002) 1, Strasbourg, October 2006.
[87] Medical staff can have negative attitudes towards incarcerated persons as well as security staff. In a well-documented example, 40 or so nurses signed a document protesting the care a quadriplegic inmate was receiving in a California prison. The nurses objected to what they felt were inappropriate special care and treatments the prisoner, Steven Martinez, received, and insisted he did not deserve them because of his offense as well as his hostility to them. They noted, “His offense was against women, and he continues to offend, only now it’s psychological rape and the staff is victims. As management continues to support the special and extra treatments demands by this inmate, it sustains a hostile work environment…. It’s time that all special and unnecessary treatment be stopped immediately. It is unethical and irresponsible to have allowed the many special and far-reaching treatments to have gone on for so many years … No prisoner in the state, county or world should ever receive the special treatment this inmate receives….” quoted by Presiding Commissioner Peck, Board of Parole Hearings, California State Prison, “Medical Parole Consideration Hearing of Steven Martinez,” May 24, 2011, pp. 58-60.
[88] Human Rights Watch email correspondence with Robert Greifinger, MD, December 20, 2011. Dr. Greifinger is a medical expert with extensive experience in complex community and correctional health care systems.
[89] Anno et al., “Correctional Healthcare,” p. 10.
[90] Information provided in “Response to Questions from Human Rights Watch Program,” Human Right Watch email correspondence with David Runnels, California Correctional Health Care Services, May 6, 2011, p.3.
[91] Williams and Abraldes, “Growing Older.”
[92] Ibid.
[93] Williams and Abraldes, “Growing Older,” p. 62.
[94] Cynthia Massie Mara, “Expansion of Long-Term Care in the Prison System: an Aging Inmate Population Poses Policy and Programmatic Questions,” Journal of Aging & Social Policy, vol. 14(2), 2002, pp. 54-55. The Americans with Disabilities Act does not require retrofitting of prisons architecturally, although physical access for people with disabilities must be provided so that inmates are not denied access to activities or services because of a disability.
[95] The Disability Rights Section of the Civil Rights Division of the US Department of Justice has conducted numerous investigations into the failure of prisons to comply with the requirements of the Americans with Disabilities Act; most of the prisons they have investigated have high proportions of geriatric prisoners, a high percentage of whom have mobility, visual, or hearing disabilities. For example, the section is currently working with the Alabama Department of Corrections to eliminate architectural barriers to movement for inmates with mobility impairments at the Hamilton Aged and Infirm Correctional Facility. Human Rights Watch interview (name withheld at request), US Department of Justice, November 29, 2011.
[96] Criteria for inclusion in the Senior Living Unit include: individual must be 55 years or older, have no history of elder abuse or victimization, and no in-custody history of predatory behavior. Central California Women’s Facility Housing Division, “Operational Procedure P-054,” August 2011, on file at Human Rights Watch.
[97] A survey by the Criminal Justice Institute in 2001 asked correctional systems if they designated special housing areas or facilities for elderly inmates. While many answered “yes,” the question did not ask if age was the sole criteria for the facilities. Indeed, we know that some states answered “yes” to the questions even though age by itself would not suffice to place an elderly inmate in the specialized facility. For example, in Texas, there is a special facility for geriatric prisoners over 60 but if they are fit and healthy, they will not be housed there. See Anno et al., “Correctional Healthcare,” Appendix A: Criminal Justice Institute Survey, pp. 66-69. A list of facilities for inmates who are old and infirm developed in 2005 is available at http://answers.google.com/answers/threadview/id/536333.html.
[98] R.V. Thivierge-Rikard and Maxine S. Thompson, “The Association between Aging Inmate Housing Management Models and Non-Geriatric Health Services in State Correctional Institutions,” Journal of Aging & Social Policy, vol. 19(4), 2007; John J. Kerbs and Jennifer M. Jolley, “A Commentary on Age Segregation for Older Prisoners: Philosophical and Pragmatic Considerations for Correctional Systems,” Criminal Justice Review, vol. 34(1), March 2009.
[99] Human Rights Watch interview with Cedric McDonald (pseudonym), Central Mississippi Correctional Facility, Rankin county, Mississippi, June 14, 2011.
[100] Missouri Department of Corrections, “Aging Offenders Management Team Report,” p. 5.
[101] Ibid.
[102] Missouri Department of Corrections, “Annual Report 2010.”
[103] Human Rights Watch visited Mississippi State Penitentiary, including Unit 31, on June 15, 2011.
[104] Ibid.
[105] Anthony A. Sterns et al., “The Growing Wave of Older Prisoners: A National Survey of Older Prisoner Health, Mental Health and Programming,” Corrections Today, October 2008, http://www.aca.org/fileupload/177/ahaidar/Stern_Keohame.pdf (accessed December 13, 2011). While older prisoners may predominate in these facilities, they also house younger inmates with certain medical conditions.
[106] Human Rights Watch visited Ohio’s Correctional Medical Center on May 17, 2011.
[107] Human Rights Watch interview with Homer Edmunds (pseudonym) and nursing staff, Mississippi State Penitentiary, Parchman, Mississippi, June 15, 2011.
[108] Ten of the men in the UCI have diagnoses of dementia; nine have diagnoses of “cognitive impairment-NOS,” a diagnosis used internally at the UCI “to convey the sense that the patients with that diagnosis are not afflicted with dementia as understood medically and/or psychiatrically, but have a significant level of impairment of social/intellectual/physical functioning which impedes/impairs their ability to remain in general population. This does not include those patients with pre-existing uncontrolled psychiatric disorders, mental impairment (mental retardation with/without developmental disability) although we have been called to assess these types of patients for suitability for our unit.” Human Rights Watch email correspondence with Dr. Joseph Avanzato, Fishkill Correctional Center, New York Department of Corrections and Supervision, December 5, 2011.
[109] Information provided to Human Rights Watch in email correspondence with Paula Butler, deputy superintendent health services, Fishkill Correctional Facility, New York Department of Corrections and Community Supervision, November 2, 2011.
[110] Human Rights Watch interview with William Connelly, superintendent, Fishkill Correctional Facility, Beacon, New York, December 2, 2011.
[111] Bettina Hodel and Heriberto G. Sanchez, “A Psycho-Social Intervention Program Provided in the Prison System for Inmate-Patients with Serious Cognitive Problems,” PowerPoint presentation of February 27, 2009, provided to Human Rights Watch by David Runnels, CDCR, May 17, 2011.
[112] Human Rights Watch interview with Dennis Brown, warden, Augusta State Medical Prison, Grovetown, Georgia, June 28, 2011.
[113] See for example, Alzheimer’s Association, “2011 Alzheimer’s Disease Facts and Figures,” http://www.alz.org/alzheimers_disease_facts_and_figures (accessed January 6 2011).
[114] Some academics disagree. See for example, Kerbs and Jolley, “A Commentary on Age Segregation for Older Prisoners,” pp. 119-139. Kerbs and Jolley believe the benefits of age-segregated living arrangements for older inmates include the promotion of rehabilitation and increased safety.
[115] Human Rights Watch interview with Roger Storey (pseudonym), Hocking Correctional Facility, Nelsonville, Ohio, May 16, 2011.
[116] Rachel Filinson, “Survey of inmates aged 55+, Rhode Island Adult Correctional Institution (Medium Security) Overview of Findings,” spring 2011, unpublished document on file at Human Rights Watch.
[117] Human Rights Watch interview with John Burke (pseudonym), California Men’s Colony, San Luis Obispo, California, April 14, 2011.
[118] Human Rights Watch interview with William Connelly, superintendent, Fishkill Correctional Facility, Beacon, New York, December 2, 2011.
[119] Data provided to Human Rights Watch in email correspondence with Dr. Nancy Wolff, June 27, 2011, based on survey of 7,113 male and 562 female inmates. Men were far more likely to report staff-on-inmate victimization than women (10.6 versus 2.5 percent).
[120] Kerbs and Jolley, “A Commentary on Age Segregation for Older Prisoners,” pp. 124-127.
[121] Quoted in Heidi Strupp and Donna Willmott, Legal Services for Prisoners with Children, “Dignity Denied: The Price of Imprisoning Older Women in California,” http://www.prisonerswithchildren.org/publications/reports (accessed January 6, 2011), p.36.
[122] Filinson, “Survey of inmates aged 55+,” unpublished document on file at Human Rights Watch.
[123] Human Rights Watch interview with Dr. Joseph Bick, chief medical executive, California Medical Facility, Vacaville, California, April 11, 2011. Bick also pointed out that no one will acknowledge the incident, neither the victim nor observers. The inmate will claim his black eye was from slipping in his cell, or some such excuse.
[124] Kerbs and Jolley, “A Commentary on Age Segregation for Older Prisoners,” p. 129.
[125] Human Rights Watch interview with correctional officer (name withheld), Correctional Medical Center, Columbus, Ohio, May 17, 2011.
[126] Human Rights Watch interviews with various inmates and correctional officer, Denver Reception and Diagnostic Center, Denver, Colorado, March 23, 2011.
[127] Brie A. Williams et al., “Caregiving Behind Bars: Correctional Officer Reports of Disability I Geriatric Prisoners,” Journal of the American Geriatric Society, vol. 57 no. 7, July 2009.
[128] As a consequence of litigation under the Americans with Disabilities Act (ADA), some prison systems, including Colorado’s, provide training in disability at the academy and in annual refreshers.
[129] Ibid.
[130] Human Rights Watch
[131] Human Rights Watch interviews with inmates, California Substance Abuse Treatment Facility and State Prison, Corcoran, California, April 13, 2011.
[132] Human Rights Watch interview with Constance Wooster, Denver Women’s Correctional Facility, Denver Colorado, March 23, 2011.
[133] Human Rights Watch interview with Joanne Brown (pseudonym) and Sarah James (pseudonym), Central California Women’s Facility, Chowchilla, California, April 12, 2011.
[134] Human Rights Watch interview with Hannah Bonner (pseudonym), Denver Reception and Diagnostic Center, Denver, Colorado, March 23, 2011.
[135] Because we did not set out to assess medical care, these incidents are not included in this report, and we have no basis, in any event, for assessing whether the medical treatment provided to elderly inmates is any better or worse than that provided to inmates of different ages.
[136] Interview with Bonnie Frampton (pseudonym), Denver Women’s Correctional Facility, Denver, Colorado, March 23, 2011.
[137] Human Rights Watch interview with William Hannah, Hocking Correctional Facility, Nelsonville, Ohio, May 16, 2011.
[138] Human Rights Watch interview with Dr. Joseph Bick, chief medical executive, California Medical Facility, Vacaville, California, April 11, 2011.
[139] Quotes compiled from Human Rights Watch group interview with staff, Coyote Ridge Corrections Center, Connell, Washington, August 8, 2011.
[140] Williams et al., “Caregiving Behind Bars.”
[141] Cindy Snyder et al., “Older Adult Inmates: The Challenge for Social Work,” Social Work, vol. 54 no. 2, April 2009, p. 121.
[142] Oklahoma Department of Corrections, “Managing Increasing Aging Inmate Populations,” October 2008, http://www.doc.state.ok.us/adminservices/ea/aging%20white%20paper.pdf (accessed November 29, 2011).
[143] Human Rights Watch interview with Vimal Singh, warden, California Medical Facility, Vacaville, California, April 4, 2011.
[144] Human Rights Watch interview with corrections officer (name withheld), John J. Moran Medium Security Facility, Cranston, Rhode Island, July 15, 2011.
[145] Human Rights Watch interview Joanne Brown (pseudonym), Central California Women’s Facility, Chowchilla, California, April 12, 2011.
[146] Human Rights Watch interview with Carols Ruiz (pseudonym), California Substance Abuse Treatment Facility and State Prison, Corcoran, California, April 13, 2011.
[147] Anno et al., “Correctional Healthcare.”
[148] Human Rights Watch interview with Francisco Pineda, warden, Hocking Correctional Facility, Nelsonville, Ohio, May 16, 2011. Warden Pineda provided Human Rights Watch with an unpublished paper he authored titled “The Older Offender in DRC,” on file at Human Rights Watch.
[149] Quoted in Strupp and Willmott, “Dignity Denied,” p. 27.
[150] Price, “Aging Inmate Population Study.”
[151] Admittedly, the grotesquely overcrowded California prison system was unable to meet the medical and mental health needs of its prisoners regardless of age. The deadly dysfunction finally resulted in a May 2011 Supreme Court decision ordering state officials to reduce the prison population. Brown v. Plata, United States Supreme Court, 131 S. Ct. 1910 (2011).
[152] Human Rights Watch interview with J. Clark Kelso, receiver, California Correctional Health Care Services, Sacramento, California, April 19, 2011.
[153] Prisons that exhibit “deliberate indifference to serious medical needs” may be liable for violations of the 8th Amendment prohibition of cruel and unusual punishment. Estelle v. Gamble, 429 US 97 (1976).
[154] The International Covenant on Economic, Social and Cultural Rights recognizes the “right of everyone to the highest attainable standards of health.” ICESCR, art. 11. As the US has not ratified the ICESCR it is not legally binding in total on the US, however as a signatory the US does undertake a number of legal obligations including, at a minimum, to take no action that would undermine the intent and purpose of the treaty. Vienna Convention on the Law of Treaties, adopted May 23, 1969, entered into force January 27, 1980, article 18. The United States is a party to the International Covenant on Civil and Political Rights (ICCPR), which guarantees to all persons the right to life, to be free from cruel, inhuman or degrading treatment; and if deprived of their liberty to be treated with humanity and with respect for the inherent dignity of the human person. ICCPR, arts. 6, 7, 10(1). Under the ICCPR, governments must provide “adequate medical care during detention.” Pinto v. Trinidad and Tobago (Communication No. 232/1987) Report of the Human Rights Committee, vol. 2, UN Doc A/45/40, p. 69. The United States is also a party to the Convention Against Torture and other Cruel, Inhuman or Degrading Treatment or Punishment. CAT. Failure to provide adequate medical care can violate article 16 of CAT which prohibits cruel, inhuman or degrading treatment. United Nations Committee against Torture (CAT), “Concluding Observations: New Zealand,” (1998) UN Doc. A/53/44, para. 175.
[155] Anno et al., “Correctional Healthcare.”
[156] In 1998 the National Center on Institutions and Alternatives estimated that the cost of incarcerating an elderly offender was $69,000 a year, more than three times the cost for the average inmate of $22,000. Hoelter, “Imprisoning Elderly Offenders,” p.4.
[157] Tennessee Department of Correction, “Future Felon Population of the State of Tennessee FY 2007-2008,” March 2008, http://www.tn.gov/correction/pdf/pop-proj08.pdf (accessed July 10, 2011), p. 30.
[158] For an overview of prisoners’ health conditions, see Williams and Abraldes, “Growing Older,” p. 56; Anno et al., “Correctional Healthcare”; and Aday, “Aging Prisoners.”
[159] Anthony A. Sterns et al., “The Growing Wave of Older Prisoners: A National Survey of Older Prisoner Health, Mental Health and Programming,” Corrections Today, October 2008, http://www.aca.org/fileupload/177/ahaidar/Stern_Keohame.pdf (accessed December 13, 2011).
[160] Data provided to Human Rights Watch by Francisco Pineda, warden, Hocking Correctional Facility, Nelsonville, Ohio, May 16, 2011.
[161] State of Florida Correctional Medical Authority, “Report on Elderly and Aging Inmates in the Florida Department of Corrections,” December 2005, p. 8.
[162] According to the California Department of Corrections and Rehabilitation (CDCR) “to the extent that the use of medical beds reflects the overall use of medical healthcare resources, by 2012 CDCR can expect that over 50 percent of all medical care expenditures will be associated with inmates over the age of 55.”California Department of Corrections and Rehabilitation, “Aging of the Inmate Population and Potential Impact on Healthcare Resources,” undated memorandum provided to Human Rights Watch.
[163] Data provided to Human Rights Watch by Dennis Brown, warden, Augusta State Medical Prison, Grovetown, Georgia, on June 28, 2011.
[164] Information provided in “Response to Questions from Human Rights Watch Program,” Human Right Watch email correspondence with David Runnels, California Correctional Health Care Services, May 6, 2011, p.3.
[165] Data provided to Human Rights Watch by Dr. Robert Trestman, executive director, Correctional Managed Health Care, July 19, 2011.
[166] Of the average annual cost per inmate of $48,536, approximately $16,000 goes to healthcare costs. California Department of Corrections and Rehabilitation, “Corrections: Moving Forward, Annual Report 2009,” http://www.cdcr.ca.gov/News/Press_Release_Archive/2009_Press_Releases/docs/CDCR_Annual_Report.pdf (accessed November 29, 2011), p. 8.
[167] David Sherfinski, “Older, sicker inmates add to costs in Virginia jails,” The Washington Times, October 17, 2011.
[168] Williams and Abraldes, “Growing Older,” p. 58.
[169] Steve Angelotti and Sara Wycoff, Michigan Senate Fiscal Agency, “Michigan’s Prison Health Care: Costs in Context,” November 2010, p. 16.
[170] Human Rights Watch email correspondence with David Runnels, California Correctional Health Care Services, May 6, 2011.
[171] State of Florida Correctional Medical Authority, “2009-2010 Annual Report and Report on Aging Inmates,” pp. 16, 59-61.
[172] Data on medical costs from “Conference on Aging,” May 3, 2010, PowerPoint presentation provided to Human Rights Watch by Sharon R. Lewis, statewide medical director, Georgia Department of Corrections, June 28, 2011, on file at Human Rights Watch.
[173] Ibid.
[174] Data provided to Human Rights Watch by James Degroot, Georgia Department of Corrections, July 8, 2011, on file at Human Rights Watch.
[175] Angelotti and Wycoff, “Michigan’s Prison Health Care,” p. 15.
[176] Human Rights Watch telephone interview with Chuck Schardin, Medical Administration, Nevada Department of Corrections, August 30, 2011.
[177] Data provided to Human Rights Watch in email correspondence with Keith Acree, North Carolina Department of Corrections, July 28, 2011.
[178] Oklahoma Department of Corrections, “Managing Increasing Aging Inmate Populations,” http://www.doc.state.ok.us/adminservices/ea/aging%20white%20paper.pdf, p. 7.
[179] Williams, “The Aging Inmate Population,” p. 21.
[180] Ibid., p. 24.
[181] Renee C. Lee, “A growing burden: as more elderly prisoners serve time, state officials struggle to pay their medical costs,” Houston Chronicle, May 15, 2011.
[182] Sherfinski, “Older, sicker inmates add to costs in Virginia jails.” In 2008, according to the Virginia Department of Corrections, the average inmate age 50 or older had annual offsite medical costs of $3,350. Virginia Department of Corrections, “A Balanced Approach.”
[183] Brown v. Plata, United States Supreme Court, 131 S. Ct 1910 (2011).
[184] Marquiz v. Romer, 92-k-1470 (D. Colorado), unreported.
[185] Holmes v. Godinez, Case 1:11-cv-02961, class action complaint filed in federal district court in the northern district of Illinois on May 4, 2011. Human Rights Watch email correspondence with Alan Mills, attorney, Uptown People’s Law Center, December 13 and 14, 2011.
[186] Christine Vestal, “Medicaid Expansion Seen Covering Nearly all State Prisoners,” Governing, October 18, 2011, www.governing.com/blogs/politics/Meddicaid-Expansion-covering-Nearly-All-State-Prisoners.html (accessed November 29, 2011).
[187] A recent analysis of state recidivism found that four out of ten offenders returned to prison within three years of release either for committing new crimes or for violating the conditions governing their release. Pew Center on the States, “State of Recidivism: The Revolving Door of America’s Prisons” (Washington, DC: The Pew Charitable Trusts, April 2011).
[188] In a rather unusual example , a 69-year-old man tried to rob a bank using a knife the day after he was released from prison. James Barron, “Ex-Convict Is Shot After Failed Holdup,” The New York Times, October 15, 2011, http://www.nytimes.com/2010/10/15/nyregion/15penn.html (accessed November 29, 2011).
[189] Hoelter, “Imprisoning Elderly Offenders,” citing Michael Gottredson and Travis Hischi, “The True Value of Lamba Would Appear to be Zero: An Essay on Criminal Careers, Selective Incapacitation, Cohort Studies, and Related Topics,” Criminology, vol. 24 issue 2, 1986, pp. 223-233.
[190] Patrick A. Langan and David J. Levin, Bureau of Justice Statistics, “Recidivism of Prisoners Released in 1994,” June 2002, http://bjs.ojp.usdoj.gov/index.cfm?ty=pbdetail&iid=1134 (accessed November 29, 2011), Table 8. The Bureau of Justice Statistics study lumps all offenders 45 or over together as do some more recent studies, for example, Kyung Yon Jhi and Hee-Jong Joo, “Predictors of Recidivism Among Major Age Groups of Parolees in Texas,” Justice Policy Journal, Spring 2009, www.cjcj.org/files/predictors_of.pdf (accessed November 29, 2011). Other studies identify age as a strong, significant predictor of recidivism, but do not provide data breaking the released inmates into discrete age groups. See, for example, Beth M. Huebner and Mark T. Berg, “Examining the Sources of Variation in Risk for Recidivism,” Justice Quarterly, vol. 28 no. 1, February 2011, pp. 146-173.
[191] Florida Department of Corrections, “2009 Florida Prison Recidivism Study: Releases from 2001 to 2008,” March 2010, www.dc.state.fl.us/secretary/press/2010/RecidivismStudy.pdf (accessed July 11, 2011), p. 16.
[192] Data provided to Human Rights Watch by Maureen O’Keefe, Colorado Department of Corrections, March 23, 2011.
[193] Unpublished data obtained through Freedom of Information Act request by Human Rights Watch in email correspondence with New York Department of Corrections and Community Supervision, July 11, 2011. Older prisoners were also significantly less likely to be returned to prison for violating the conditions of release. For example, 31.2 percent of the offenders who were younger than 55 when released in 2006 were returned to prison within three years for parole violations compared to 17.4 percent of those released at age 55 and older
[194] Data provided to Human Rights Watch by the New York State Department of Corrections and Community Services by email, April 30, 2012.
[195] Data provided to Human Rights Watch in email correspondence with Steve Vandine, Ohio Department of Corrections, July 14, 2011. See also, Matthew Makarios, Benjamin Steiner, and Lawrence F. Travis, III et al., “Examining the Predictors of Recidivism among Men and Women Released from Prison in Ohio,” Criminal Justice and Behavior, vol. 37 no. 12, December 2010, (age is a significant predictor of recidivism).
[196] Human Rights Watch interview with Alan Gage (pseudonym), Coyote Ridge Corrections Center, Connell, Washington, August 8, 2011.
[197] Nellis and King, “No Exit.”
[198] Margaret Noonan, Bureau of Justice Statistics, “Deaths in Custody: State Prison Deaths 2001-2007 - Statistical Tables,” Oct. 28, 2010, http://bjs.ojp.usdoj.gov/index.cfm?ty=pbdetail&iid=2093 (accessed January 12, 2012), Table 5. Illness and AIDS consistently account for almost all prisoner deaths, including those of inmates aged 55 and over.
[199] State of Florida Correctional Medical Authority, “2009-2010 Annual Report and Report on Aging Inmates,” p. 54.
[200] New York Department of Correctional Services (now New York State Department of Corrections and Community Supervision), “Inmate Mortality Report: 2005-2008,” http://www.docs.state.ny.us/Research/Reports/2010/Inmate_Mortality_Report_2005-2008.pdf (accessed November 29, 2011), pp. 8-9.
[201] Data on deaths provided to Human Rights Watch in email correspondence with Steve Vandine, Ohio Department of Corrections, July 20, 2011. Percentage of prison population by age in 2009 from Ohio Department of Rehabilitation and Correction, “Institution Census 2009,” January 2009, http://www.drc.ohio.gov/web/Reports/InstitutionCensus/Institution%20Census%202009.pdf
(accessed December 13, 2011).
[202] See generally, John F. Linder and Frederick J. Meyers, “Palliative and End-of-Life Care in Correctional Settings,” Journal of Social Work in End-of-Life & Palliative Care, vol. 5 issue 1-2, 2009, pp. 7-33; National Hospice and Palliative Care Organization, “Quality Guidelines for Hospice and End-of-Life Care in Correctional Settings,” 2009, http://www.nhpco.org/files/public/access/corrections/CorrectionsQualityGuidelines.pdf (accessed December 13, 2011). Extensive information about prison hospices can be found on the website of the National Prison Hospice Association, http://npha.org. The hospice at Angola Prison has received considerable national attention. Descriptions of Angola’s hospice and a video about it can be found at the National Prison Hospice Association website. See also, Carol Evans et al., “The Louisiana State Penitentiary: Angola Prison Hospice,” Journal of Palliative Medicine, vol. 5 no. 4, 2002, pp. 553-558.
[203] One study has suggested that hospices not only have a powerful positive influence on inmates who work in them but also enhance respect, dignity, and compassion among prison staff and prisoners more generally. Kevin N. Wright and Laura Bronstein, “Creating Decent Prisons: A Serendipitous Finding about Prison Hospice,” Journal of Offender Rehabilitation, vol. 44 no. 4, 2007, pp. 1-16. See also, Art Beeler, “Palliative Care volunteers: A Program of Compassion,” Corrections Today, July 2006, p. 38.
[204] Kurt Streeter, “Amid ill and dying inmates, a search for redemption,” Los Angeles Times, November 20, 2011, http://www.latimes.com/news/local/la-me-1120-prison-hospice-html,0,6904576.htmlstory (accessed November 22, 2011).
[205] Human Rights Watch interview with Bernadette Thornton (pseudonym), Denver Women’s Correctional Facility, Denver, Colorado, March 23, 2011.
[206] Human Rights Watch interview with Samuel Edison (pseudonym), Colorado Territorial Correctional Facility, Cañon City, Colorado, March 24, 2011.
[207] Gloria Donehy, quoted in Strupp and Willmott, “Dignity Denied,” p. 47.
[208] California Legislative Analyst’s Office, “Analysis of the 2003-4 Budget Bill,” February 2003, quoted in Strupp and Willmott, “Dignity Denied,” p.53.
[209] Many of the concerns we raise regarding the old and infirm could also be raised with regard to the incarceration of young people whose physical and mental capabilities have been profoundly limited by injury or disease.
[210] The prohibition of what are variously described as cruel, unusual, inhuman, or degrading punishments found in many national constitutions as well as in international and regional human rights treaties is the primary basis for prohibitions of grossly disproportionate sentences. Dirk van Zyl Smit and Andrew Ashworth, “Disproportionate Sentences as Human Right Violations,” The Modern Law Review, vol. 67 no. 4, July 2004, p. 543. Article 7 of the International Covenant on Civil and Political Rights provides that “No one shall be subjected to torture or to cruel, inhuman or degrading treatment or punishment.” The European Court of Human Rights has recognized that disproportionately severe sentences can be incompatible with the prohibition on inhuman punishment in Article 3 of the European Convention on Human Rights. For a discussion of proportionality in US constitutional jurisprudence addressing the length of sentences, see Richard S. Frase, “Excessive Prison Sentences, Punishment Goals, and the Eighth Amendment: ‘Proportionality’ Relative to What?” Minnesota Law Review, vol. 89, February 2005, p. 571.
[211] ICCPR, art. 9. Article 9 protects individuals against undue or arbitrary deprivations of liberty, which can include unjust sentences of imprisonment. In a number of cases challenging discretionary life sentences, the European Court of Human Rights has recognized that sentences which are arbitrary or disproportionately lengthy can violate Article 5 of the European Convention on Human Rights, although it did not find violations in the cases before it. See for example, Weeks v. United Kingdom, (1987) 10 EHRR 293, March 2, 1987; V v. United Kingdom, App. No 24888/94, European Court of Human Rights (1999), December 16, 1999.
[212] S. v. Dodo, 2001 (3) SA 382 (CC) 303, opinion of Ackerman J writing for unanimous Constitutional Court of South Africa, quoted in van Zyl Smit and Ashworth, “Disproportionate Sentences as Human Right Violations,” p. 541.
[213] See, for example, van Zyl Smit and Snacken, Principles of European Prison Law and Policy, chapter 2 (principle that deprivation of liberty should only be used as a last resort increasingly prominent in European penal policies and human rights standards). For discussion of European human rights jurisprudence on lengthy sentences, see van Zyl Smit and Snacken, Principles of European Prison Law and Policy, pp. 91-97. See also, Dirk van Zyl Smit, “Outlawing Irreducible Life Sentences: Europe on the Brink?” Federal Sentencing Review, vol. 23, October 2010, p. 39. As discussed in van Zyl Smit, there is growing trend in Europe to consider life sentences without the possibility of release to be inherently inhuman.
[214] The American Law Institute, “Model Penal Code: Sentencing, Tentative Draft No. 1,” April 19, 2007, sec. 1.02(2).
[215] See Frase, “Excessive Prison Sentences”; van Zyl Smit, “Outlawing Irreducible Life Sentences.”
[216] See, for example, section 1.02 of the revised “Model Penal Code” (proportionality assessed in terms of “the gravity of the offenses, the harms done to crime victims, and the blameworthiness of the offenders”). The American Law Institute, “Model Penal Code: Sentencing, Tentative Draft No. 1,” sec. 1.022(2)(a)(i). The concept of just deserts can also set the upper limits on sentencing severity, constraining the severity of punishment that might otherwise be imposed to serve other “non-desert” sentencing purposes such as deterrence and rehabilitation. According to criminologist Richard Frase, there is considerable support in US as well as European sentencing regimes for what he termed “limiting retributivism.” See Richard S. Frase, “Limiting Retributivism,” in Michael Tonry, ed., The Future of Imprisonment, pp. 83-119. See, for example, the Supreme Court of South Africa’s decision S. v. Dodo: “Where the length of the sentence, which has been imposed because of its general deterrent effect on others, bears no relation to the gravity of the offense, the offender is being used essentially offender is being used essentially as a means to another end and the offender’s dignity is assailed. So too where the reformative effect of the punishment is predominant and the offender sentenced to lengthy imprisonment, principally because he cannot be reformed in a shorter period, but the length of imprisonment bears no relationship to what the committed offence merits.” S. v. Dodo, 2001 (3) SA 382 (CC) 303, opinion of J. Ackerman J writing for unanimous Constitutional Court of South Africa, quoted in van Zyl Smit and Ashworth, “Disproportionate Sentences as Human Right Violations,” p. 542.
[217] 7Office of the High Commissioner for Human Rights, CCPR General Comment 21, Humane Treatment of Persons Deprived of Liberty, U.N. Doc. 04/10/1992 (1992).7
[218] Kevin R. Reitz, “Reporter’s Study: The Question of Parole-Release Authority,” March 16, 2011, Appendix B to The American Law Institute, “Model Penal Code: Sentencing, Tentative Draft No. 2,” March 25, 2011.
[219] Vera institute of Justice, “It’s About Time.”
[220] See The American Law Institute, “Model Penal Code: Sentencing,” p. 22 (“The overwhelming weight of criminological research suggests that the law’s deterrent effects can rarely be enhanced through marginal increases in the punishment severity.”) See also Appendix A, p. 129, n. 27: “Most criminologists agree that there is little or no evidence in support of this belief [that general deterrence can be effected through variations in penalty severity – although many caution that the absence of evidence is the same thing as affirmative proof that severity-based deterrence does not occur.… there is wide agreement across disciplines that general deterrence is better reflected through increases in the certainty of punishment following criminal conduct than through increases in the severity of threatened sanctions.” See generally Apel and Nagin, "General Deterrence," in Wilson and Petersilia, eds., Crime and Public Policy.
[221] See generally Apel and Nagin, "General Deterrence," in Wilson and Petersilia, eds., Crime and Public Policy.
[222] Rehabilitation may be seen as the flip side of incapacitation. “The flip side of releasing prisoners when we think they have been rehabilitated is continuing their confinement when we think they remain crime-prone.” Reitz, “Reporter’s Study,” Appendix B, The American Law Institute, “Model Penal Code: Sentencing, Tentative Draft No. 2.”
[223] ICCPR, art. 10(1).
[224] ICCPR, art. 10(3).
[225] The question arises most clearly in the case of sentences to life without parole, that is, sentences which by their terms require the offender to spend the rest of his life in prison. But other sentences without the possibility of parole may, depending on their length and the age of the sentenced individual, de facto constitute a sentence to death in prison. European jurisprudence on life without parole sentences is reviewed in van Zyl Smit, “Outlawing Irreducible Life Sentences.” In the context of juvenile offenders receiving life without parole sentences, the international consensus against the practice is even more pronounced: There are currently about 2,600 persons in the United States serving life without parole sentences for crimes they committed before age 18; to our knowledge, not a single youth offender is serving this sentence anywhere else in the world. See for example Connie de la Vega and Michelle Leighton, “Sentencing our Children to Die in Prison: Global Law and Practice,” University of San Francisco Law Review, vol. 42, 2008, p. 983. Human Rights Watch has described elsewhere how the sentence of life without parole for juveniles violates human rights law and the practice of governments around the globe. Human Rights Watch, When I Die, They’ll Send Me Home: Youth Sentenced to Life without Parole in California, October, 2008, http://www.hrw.org/reports/2008/10/17/when-i-die-they-ll-send-me-home; Human Rights Watch and Amnesty International, The Rest of Their Lives: Life Without Parole for Child Offenders in the United States, (New York: Human Rights Watch, October 2005), http://hrw.org/reports/2005/US1005/index.htm. Indeed, the United States’ practice of sentencing youth offenders to life without parole has prompted three human rights treaty oversight bodies in the past six years to find the United States out of compliance with its treaty obligations. The Human Rights Committee (the oversight and enforcement body for the International Covenant on Civil and Political Rights, ratified by the United States in 1992) has said that "[t]he Committee is of the view that sentencing children to life sentences without parole is of itself not in compliance with…the Covenant." UN Human Rights Committee, Concluding Observations of the Human Rights Committee: The United States of America, U.N. Doc. CCPR/C/USA/CO/ 3/Rev.1, (Dec. 18, 2006), para. 35. Moreover, the Committee Against Torture (the oversight and enforcement body for the Convention Against Torture and Other Cruel, Inhuman or Degrading Treatment or Punishment, ratified by the United States in 1994) has stated that life without parole sentences for youth “could constitute cruel, inhuman or degrading treatment or punishment” in violation of the treaty. UN Committee Against Torture, Conclusions and Recommendations of the Committee Against Torture: United States of America, U.N. Doc. CAT/USA/CO/2 (July 25, 2006), para. 34. Finally, the Committee on the Elimination of Racial Discrimination (the oversight and enforcement body for the International Convention on the Elimination of All Forms of Racial Discrimination, a treaty ratified by the United States in 1994) concluded that, in light of the racial disparities in the sentencing of youth to life without parole, "the persistence of such sentencing is incompatible with … the Convention." Committee on the Elimination of Racial Discrimination, Concluding Observations of the United States, U.N. Doc. CERD/C/USA/CO/6 (Feb. 6, 2008), para. 21.
[226] Kafkaris v. Cyprus , ECHR 21906/04, February 12, 2008 (dissenting opinion), p. 5. The majority concluded the life sentence at issue was not “irreducible,” because there was a possibility of release (however slim) and because of that possibility, the sentence did not violate article 3 of the European Convention on Human Rights.
[227] Rob Barry, Michael Sallah, and Carol Marbin Miller, "Neglected to Death," Miami Herald, April 30, 2011, http://www.miamiherald.com/2011/04/30/2194842/once-pride-of-florida-now-scenes.html (accessed November 29, 2011); Cy Ryan, "State closes Las Vegas nursing home after reports of abuse, theft," Las Vegas Sun, August 26, 2011, http://www.lasvegassun.com/news/2011/aug/26/state-closes-las-vegas-nursing-home-after-reports-/ (accessed November 29, 2011).