GLOSSARIES
The Concession Holders:
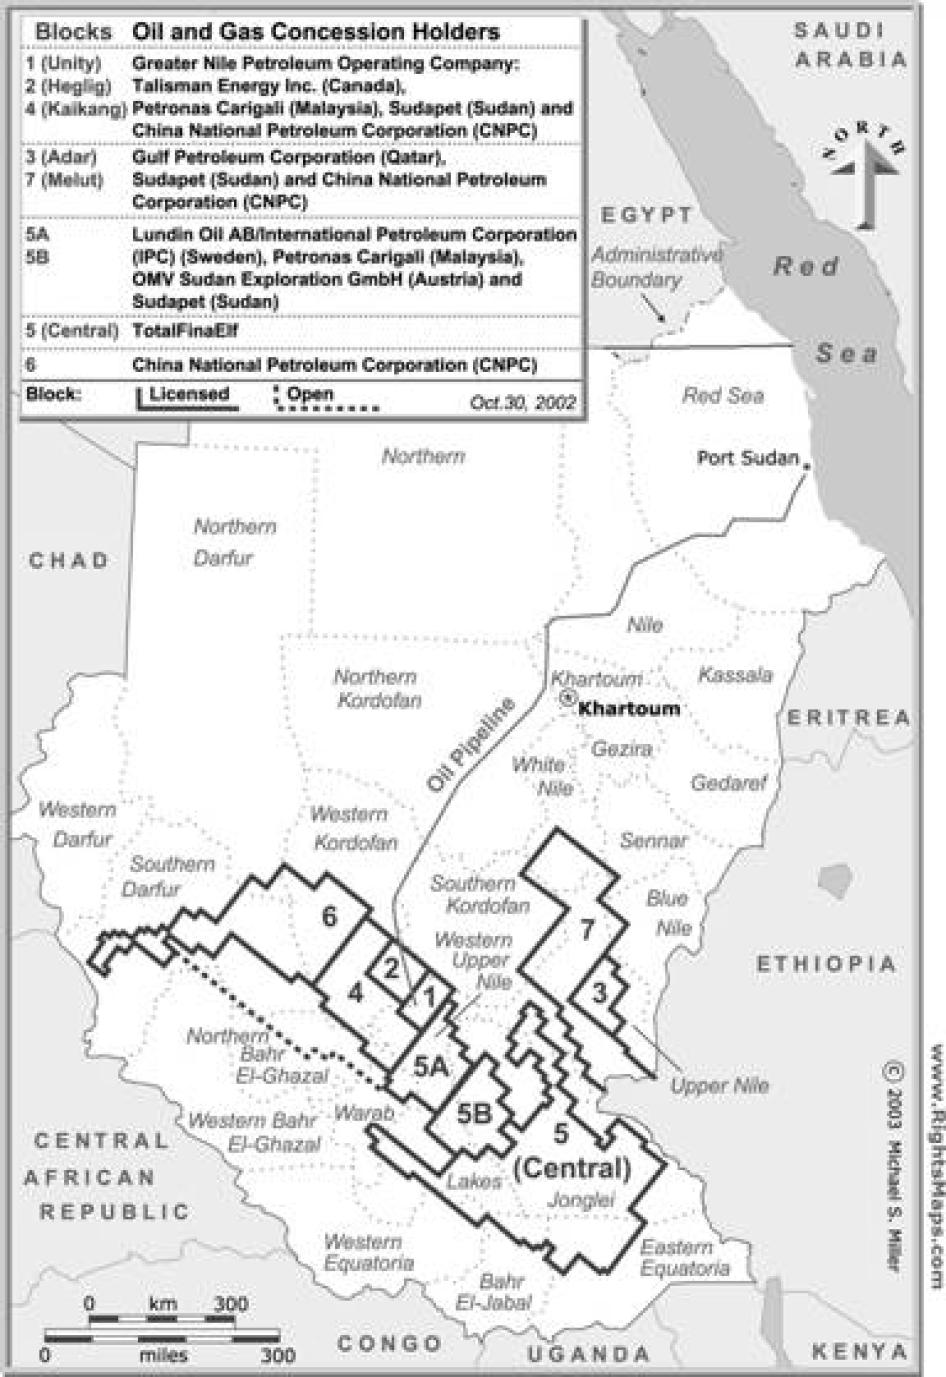
Blocks 1, 2, and 4: Greater Nile Petroleum Operating Company (GNPOC) owns the concession to explore and develop these blocks, the 1,540 kilometer pipeline to the Red Sea, and the port at Masra El Bashair, the last two built and completed by GNPOC in 1999. Its owners are Talisman Energy Inc. of Canada (25 percent, from 1998 until 2002, when it sold its interest to ONGC Videsh Ltd.); China National Petroleum Company (CNPC) (40 percent since 1996), Petronas Nasional Berhad of Malaysia (Petronas) (30 percent since 1996), and Sudan's state-owned Sudapet Limited (5 percent since 1996).
This concession in Western Upper Nile includes the Unity and Heglig oilfields, the oldest producing oilfields in southern Sudan. It also includes El Toor, Toma South, El Nar, Talih, and Munga oil fields, and the more recently explored Timsa and Bamboo oilfields in Block 4. Civilian displacement started in the mid-1980s.
Block 5A: Lundin Oil AB, a Swedish company, was lead partner in the consortium that owned Block 5A, immediately to the south of Blocks 4 and 1 in Western Upper Nile, until 2003. Lundin (through its subsidiary International Petroleum Corp.) owned 40.375 percent, which it sold to Petronas of Malaysia. Petronas owned 28.5 percent, which it purchased in 1997, and with the purchase of Lundin's interest owns 68.875 percent of Block 5A. OMV of Austria owned 26.125 percent, which it purchased in 1997, and sold this interest out to ONGC Videsh Ltd. in 2003. Sudapet owns 5 percent of Block 5A, also purchased in 1997. The Block 5A concession is still in the exploratory phase, with very good results from drilling tests. Civilian displacement began in 1998.
Because of a rebel attack at their drilling facility in May 1999, the consortium withdrew, citing "the rainy season" and "logistics" as the reasons for not continuing tests. After major displacement, continuing in 2000, the all-weather road to the drilling site was completed in 2001 and the exploratory tests resumed, were suspended for more than a year in 2002, and resumed again in 2003 shortly before Lundin sold off its interest.
Block 5B: Petronas (41 percent) and Sudapet (10 percent) are the lead partners on this concession, with Lundin Oil (24.5 percent) and OMV (24.5 percent), as announced on May 3, 2001. The concession, on the southeast border of Block 5A, includes Nyal and Ganyliel in Western Upper Nile. The White Nile cuts through it. It appears that OMV agreed to sell its interest in this block to ONGC Videsh Ltd. in 2003.
Blocks 3 & 7 in Eastern Upper Nile are not the subject of this report, but are being developed by the Qatari Gulf Petroleum Company(GPC) with CNPC, Al Hath (private Sudanese company), and Sudapet (5 percent). Fighting in this area has expanded in 2000-2001 between SPDF, SPLA, rebels and government militia and troops.
Block 5: also not covered in this report, the concession, by far the largest in the south at 120,000 square kilometers, is owned by the oil multinational TotalFinaElf, and encompasses Central Upper Nile and beyond. It is not currently being developed.
Block 6: the concession northwest of block 4 in western Sudan is owned by CNPC, but oil explorations have not yet taken place and the block is not covered in this report.
Past Players:
Chevron Oil Co., a U.S.-based multinational oil company that bought and explored concessions in Sudan starting in 1974; it pulled out of the south in 1984 after rebels killed three employees and sold off its Sudan interests in 1992.
Arakis Energy Co., a small Canadian exploration company traded on the Vancouver Stock Exchange, that in 1992 purchased State Oil Co. and its interest in Sudan in blocks 1, 2, and 4, and brought in Chinese, Malaysian, and Sudan government partners in December 1996, forming the Greater Nile Petroleum Operating Company (GNPOC). Talisman Energy purchased Arakis in October 1998.
MAP B: OIL CONCESSIONS IN CENTRAL AND SOUTHERN SUDAN AS OF AUGUST 2002
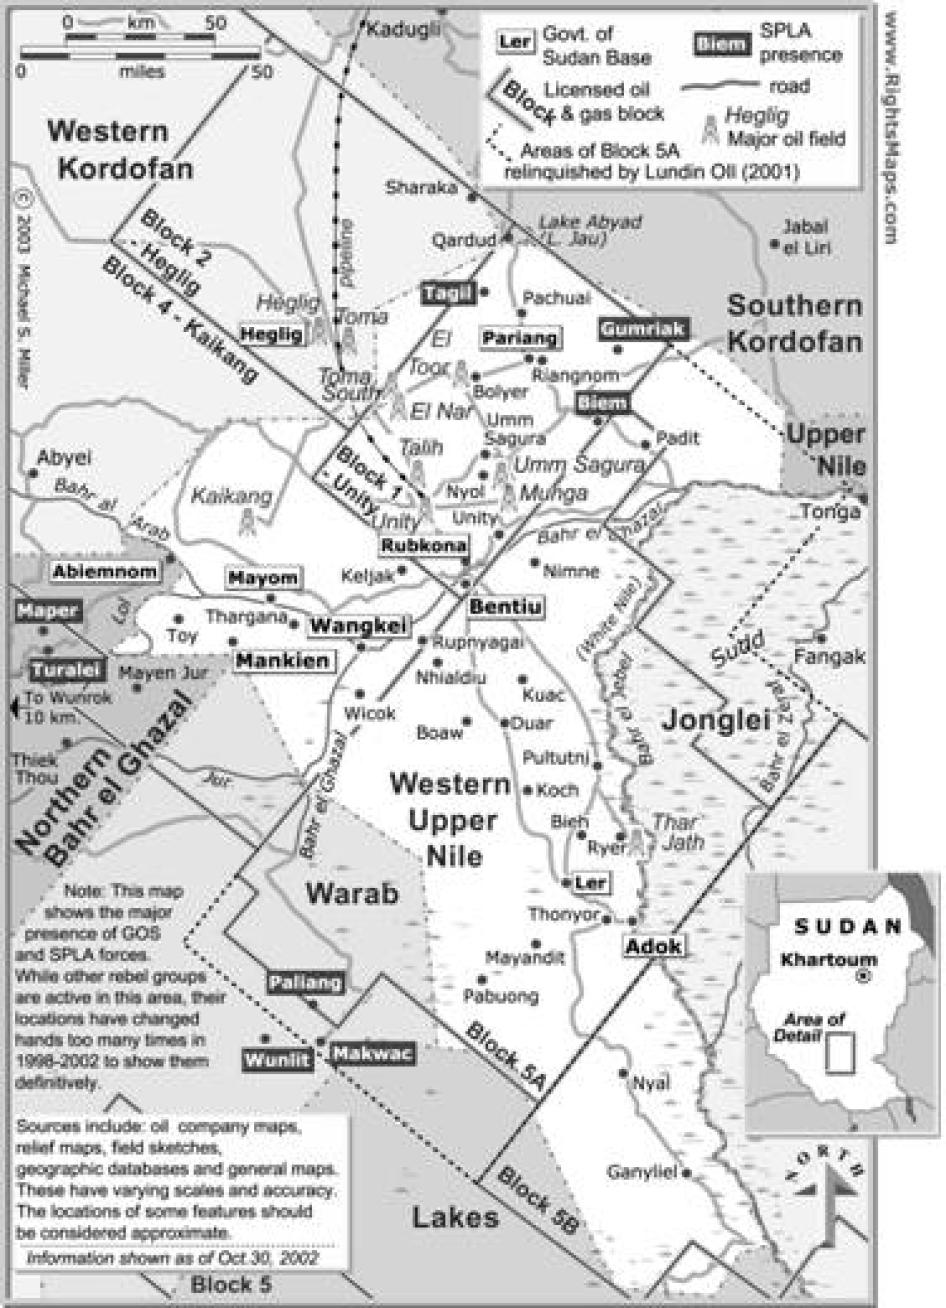
Map C: OIL ACTIVITY AND THE SCENE OF WAR IN WESTERN UPPER NILE, AS OF OCTOBER 31, 2002
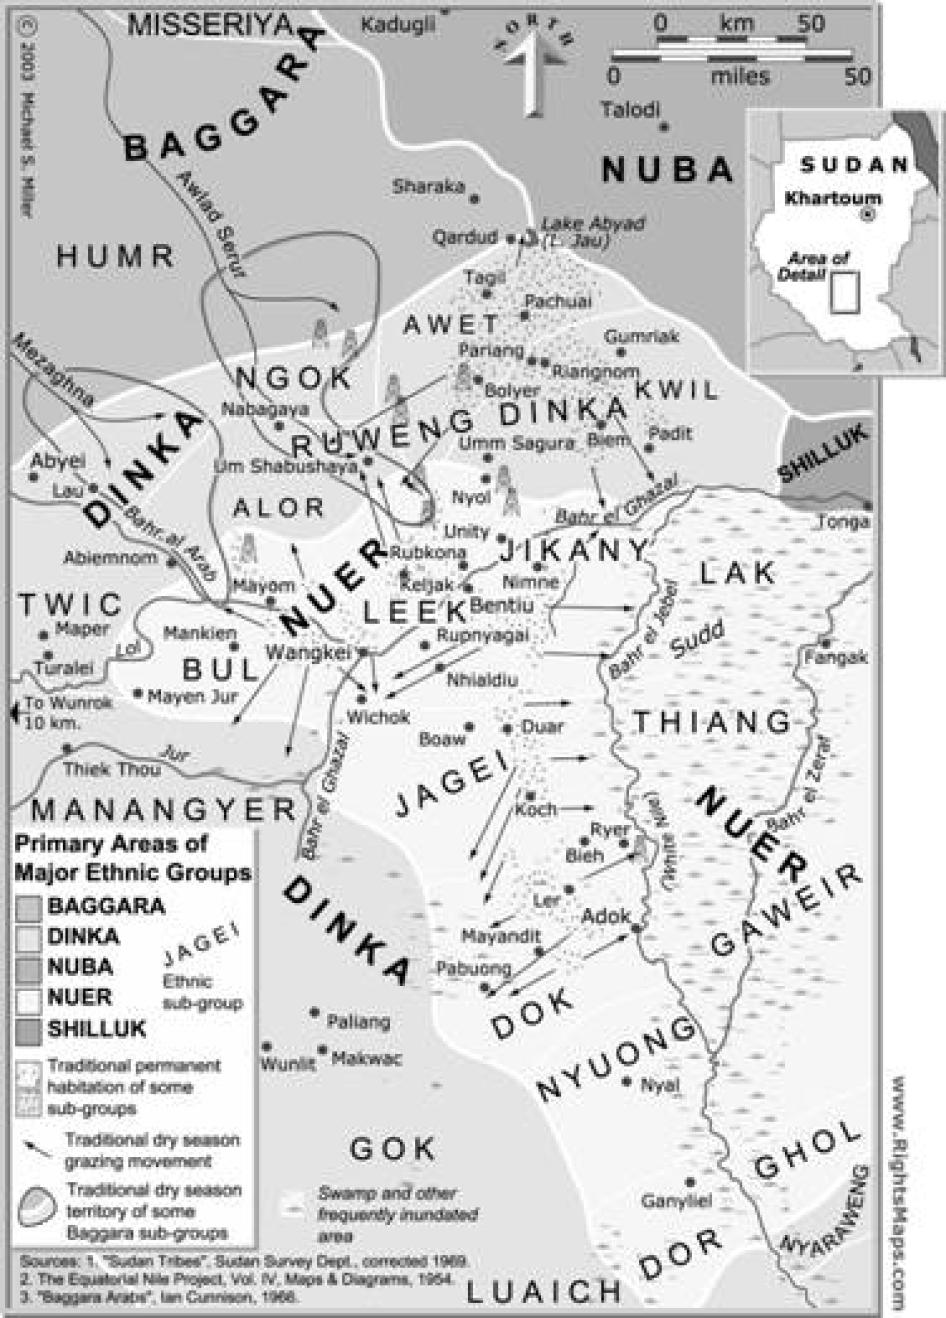
Map D: Ethnic Geography In Western Upper Nile
Main Rebel and Militia Forces in Southern Sudan Named in this Report
Anyanya: guerrilla army of southern separatists, 1955-72.
Anyanya II: guerrilla army of southern separatists, 1975-91.
Sudan People's Liberation Movement/Army (SPLM/A): dominant rebel army in Sudan, 1983-present, composed of southerners and other marginalized peoples such as the Nuba, headed by Col. John GarangdeMabior (Dinka). Program: united, secular Sudan. Headquartered in Rumbek, Bahr El Ghazal, southern Sudan.
South Sudan Liberation Movement (SSLM): a pro-independence southern political movement based in Akobo, Eastern Upper Nile, headed and formed by Michael Wal Duany in late 1999; it signed the Khartoum Peace Agreement with the Sudanese government in 2002.
Rebel forces headed (directly or indirectly) by Cmdr. Riek Machar, 1991-2002:
SPLM/A-Nasir faction: 1991-93, breakaway SPLA faction headed by SPLA Cmdrs. RiekMachar Teny Dhurgon (Dok Nuer), Gordon Kong Chuol (Eastern Jikany Nuer), and Lam Akol(Shilluk); although its program called for an independent south, it received government aid. Headquartered in Nasir until 1995 and thereafter in Waat and Ayod, Upper Nile.
SPLM/A-United: 1993-94: the above faction (mostly Nuer) joined by forces from other ethnic groups in southern Sudan, headed by Cmdr. Riek Machar, based in Nasir. Later this name was used by Lam Akol for his mostly Shilluk faction (see below).
South Sudan Independence Movement/Army (SSIM/A): 1994-97: the above faction, reformed and renamed after the Nuer reconciliation meeting at Akobo in 1994, based variously in Waat and Ayod, Upper Nile.
South Sudan Defense Forces (SSDF): 1997-2000, the army formed under the Khartoum Peace Agreement from ex-rebel forces including SSIM/A, based in Khartoum, Juba, and Malakal, and aligned with the political party United Democratic Salvation Front (UDSF). Both were headed by Cmdr. Riek Machar until January 2000, when he left the government. On April 27, 2001 all southern forces allied with the government were unified under this name, SSDF, including the progovernment militia forces listed below.
Sudan People's Defense Forces/Democratic Front (SPDF): January 2000-January 2002 or when the merger with the SPLM/A was complete, the rebel group formed from most SSDF forces, based in Upper Nile.
Some pro-government militia forces (later known as "armed groups"):
South Sudan Unity Movement/Army (SSUM/A): formed in early 1998 by Maj Gen. Paulino Matiep of the Sudan army, incorporating his formerly Anyanya II and SSDF Bul Nuer forces, supported by the Sudan government, based in Mayom, Western Upper Nile. (Bul Nuer)
Cmdr. Gabriel Tanginya, pro-government Nuer militia based in Fangak, later Poum, Central Upper Nile. (Lak Nuer)
Cmdr. Gordon Kong Chuol, pro-government Nuer militia based in Nasir, Eastern Upper Nile. (eastern Jikany Nuer)
Cmdr. Simon Gatwich Dual, pro-government Nuer militia based in Waat, Central Upper Nile. (Lou Nuer)
SPLM/A-United: Cmdr. Lam Akol's Shilluk forces formed in 1994, which signed the Khartoum Peace Agreement in 1997. Lam Akol claimed the name after the Riek Machar forces in 1994 took the name South Sudan Independence Movement/Army (SSIM/A). Lam Akol had been part of the original SPLM/A-United. Based in Tonga, the Shilluk capital, in Upper Nile of southern Sudan.
For further details, consult the Glossary, Lists of Key Individuals, and the text. There are several other southern ethnic militias armed by the government, including the Murle, the Mandari, the Toposa, the Didinga, and the Fertit and other ethnic groups not named here.
Most southerners' names include their "proper" name first, their father's name second, and their grandfather's name last. For example, to refer to Cmdr. Riek Machar Teny Dhurgon as "Machar" is to refer to that commander's father. Therefore the first and second names are used in this report.
Key Southern Individuals Named in This Report
Note: The names are listed alphabetically by second name (underlined), unless the person is known by another name.
Abel Alier Kwai Respected southern politician living in Khartoum, former vice president of Sudan and head of the Southern Region during part of the autonomy period. Author of Southern Sudan:Too Many Promises Dishonored (1990). (Bor Dinka)
Tito Biel Chuol Western Upper Nile zonal commander in SSDF in May 1999 in charge of the attack on the oil company rig at Ryer/Thar Jath, Western Upper Nile. Instrumental in securing field alliance with Cmdr. Salva Kiir Mayandit of the SPLA. Originally in the SPLA, joined the Riek Machar breakaway faction in 1991 and followed him into the government in 1997, becoming part of the SSDF, and then in 2000 part of Machar's SPDF. In late 2002 he realigned himself with the SSDF (pro-government). (Dok Nuer)
Kuong Danhier Gatluak Head of security of the SPDF in 1999. Joined the SPLA and defected with Riek Machar in 1991. When Riek Machar was in the government, Kuong Danhier was chief security officer for the SSDF, based in Nairobi. Joined Riek Machar when Machar defected from the government in early 2000. (Nyuong Nuer)
Taban Deng Gai Spokesman for Machar's SPDF forces in Nairobi, Kenya from December 2000 until June 2001, when he rejoined the SPLA. Originally joined the SPLA in the 1980s and left to join his relative by marriage, Riek Machar, when he split from the SPLA in 1991. In 1996 he joined the government with Riek Machar and became a leader of the political party they formed, the UDSF. He won an election for governor of Unity State/Western Upper Nile in December 1997 and was expelled from the governorship and the state in May 1999 by Maj. Gen. Paulino Matiep. He fled to Khartoum. He was appointed state minister for roads and communications in January 2000 by President Bashir and defected from the government in December 2000, and joined Machar's new faction, the SPDF, until he decided to rejoin the SPLA. (Leek/Western Jikany Nuer)
Michael Wal Duany Head of the SSLM as of late 1999 to the current time. Dr. Duany represented the Nuer intellectuals in the diaspora at the Wunlit Nuer-Dinka West Bank peace and reconciliation meeting of March 1999; formerly with the Workshop on Political Theory and Policy Analysis at Indiana University in Bloomington, Indiana, U.S. Based in Akobo, Upper Nile. (Lou Nuer)
John Garang de Mabior Commander-in-chief of the SPLA and head of the SPLM. Member of Anyanya briefly at the end of the first civil war in 1972, and was incorporated into the Sudan army, earned a PhD in the U.S. in agricultural/environmental studies, and having attained the rank of colonel in the Sudan army, was a founder of the SPLM/A in Ethiopia in 1983. He supported a united secular Sudan against internal SPLA rivals (separatist Anyanya II) in 1983 and won out, with backing from Ethiopia's president Haile Mengistu Meriam, continuing in control of the SPLM/A today. A Twic Dinka from Aborom in Kongor County (near Bor; he is frequently referred to as Bor Dinka).
Peter Gatdet Yaka Former Sudanese army officer sent to Iraq to fight against the Iranians in the Iran-Iraq war in the 1980s. He joined the SPLA and left it in 1991 with Riek Machar. He was assigned to Cmdr. Paulino Matiep's Bul Nuer forces as an officer, and when they split off from the SSDF he became a key commander in Commander Matiep's SSUM/A pro-government militia. He fought on the behalf of the government against the SSDF forces under Cmdr. Tito Biel in Block 5A in 1999 for control of Block 5A. He and his forces mutinied against Maj. Gen. Paulino Matiep in September 1999 and fought against the government. For several months he coordinated his activities with the SSDF (under Cmdr. Tito Biel/Peter Paar) against the government, and attacked various oil targets in Western Upper Nile/Unity State. In early 2000 he joined the SPLA. He began fighting Cmdr. Riek Machar's SPDF forces (under Cmdr. Peter Paar, formerly his SSDF adversary in 1999) in July 2000. During this round, he was anti-government and the Machar forces were pro-government. After disagreements reportedly about military discipline with the SPLA, he rejoined the government's militia forces in late 2002. (Bul Nuer)
Elijah Hon Top (deceased 2000) SSDF chief of staff under the Khartoum Peace Agreement. After Riek Machar resigned unexpectedly from the government in January 2000, Cmdr. Elijah Hon Top, a Lou Nuer from Ayod, became the spokesman for the SSDF and the UDSF in Khartoum. Formerly with the SPLA and Machar's breakaway faction in 1991, he joined the government with Machar in 1997. (Gaawar Nuer)
Kerubino Kuanyin Bol (deceased September 1999) Anyanya officer, then incorporated into the Sudan army after 1972, he was leader of the Bor mutineers whose rebellion lead to the formation of the SPLA in Ethiopia in 1983. Jailed by Garang for conspiracy in 1987, he escaped in 1992 and in 1993 joined Riek Machar's breakaway rebel group. By 1994 his Dinka militia was directly supplied by the Sudanese army from his home, the garrison town of Gogrial, Bahr El Ghazal. Defected to the SPLA in January 1998, and split with the SPLA later in that year and received protection from his in-law, Maj. Gen. Paulino Matiep, in Mankien. Killed by forces of Cmdr. Peter Gatdet after they mutinied from Paulino Matiep and captured the Mankien base in September 1999. (Tuic Dinka)
Salva Kiir Mayardit A native of Bahr El Ghazal, assigned chief of staff of the SPLA in late 1999. He was commander of Bahr El Ghazal in 1999 when he strongly backed the Dinka-Nuer Peace and Reconciliation Conference at Wunlit. (Rek Dinka)
Riek Machar Teny Dhurgon Rebel leader with the SPLA from 1984 until the 1991 split, which he helped lead. As SPLA Zonal Commander of Western Upper Nile, entered into agreement with Baggara chiefs in 1986. Led breakaway faction from SPLM/A in 1991, forming a separate southern rebel movement initially known as the SPLA-Nasir (from 1993 the SPLA-United, and from 1994-97 the SSIM/A). Despite espousing independence for the south, his faction received covert support from the government as it fought for years (1991-99) against the SPLA, resorting to increasingly bloody and ethnically motivated attacks against civilians. His SSIA rebel forces claimed all the rural land of Western Upper Nile/Unity State, except the few garrison towns and the Bul Nuer area where Paulino Matiep and Anyanya II prevailed. Signed 1996 Political Charter and 1997 Khartoum Peace Agreement with government, which in 1997 appointed him president of the Southern States Coordinating Council (SSCC) and assistant to President of Sudan Omar el Bashir. Also formed and became head of the political party United Democratic Salvation Front (UDSF) and commander-in-chief of the military arm created under the Khartoum Peace Agreement, the South Sudan Defense Force (SSDF), comprising most of the ex-rebels who had signed that agreement. His failure to stem the government's forced displacement of civilians from Western Upper Nile/Unity State ended up turning the Nuer against his leadership and eventually led to his belated resignation from government and attempt to recreate his army in the south in 2000 as the Sudan People's Democratic Forces (2000-02). In January 2002 signed an agreement with Dr. John Garang to merge the SPDF and the SPLA, receiving a leadership position in the SPLA. (Dok Nuer)
Benjamin Majak In the late 1990s, head of the relief arm of the SPLA, the SRRA, based in his Dinka area of Ruweng County, Western Upper Nile, and an SPLA commander in that area. With the Khartoum government since 2000. (Panaru/Ruweng Dinka)
Paulino Matiep Nhial Bul Nuer ally of the Sudan government. He was in Anyanya but was not incorporated into the Sudan army after the 1972 peace agreement. He became a rebel again in 1975 in Bilpam, went to Ethiopia, and returned to Western Upper Nile in 1985-86 as Anyanya II. He never joined the SPLA, in part because of its 1983 attacks on Anyanya II. He remained in Anyanya II, armed and supported by the government. With then army officer Omar El Bashir (who led the 1989 coup and became Sudan's president), he successfully recaptured Mayom garrison in Western Upper Nile in early 1989 from the SPLA. He joined Machar's breakaway faction in 1991. His forces were incorporated into the SSDF forces after the 1997 Khartoum Peace Agreement, but he fought the SSDF forces for control of the governorship of Unity State in September 1997, and lost. In March 1998 his South Sudan Unity Movement/Army (SSUM/A) was recognized by the government, which continued to directly provide him with arms and ammunition. He was named a major general in Sudan's army in or before 1998. In 1998-present, he fought on behalf of the government, forcibly displacing civilians from Block 5A. For a longer period he helped the government conduct displacements from Blocks 1, 2, and 4. In 2003 he was again engaged in fighting against Nuer pro-government rivals for control of the governorship of Unity State, and lost. (Bul Nuer)
Peter Paar Jiek, SPDF commander of Western Upper Nile in 2000-01. Formerly SSDF commander under Cmdr. Tito Biel in the fighting in 1998-99 in Western Upper Nile/Unity State. He was with Machar's forces since the split from the SPLA in 1991. He coordinated anti-government attacks with Gatdet's forces until June 2000, when he and Gatdet began to fight each other. He and Gatdet settled the "war of the Peters" in late 2000, and with Riek Machar he rejoined the SPLA in 2001. (Dok Nuer)
Nuer pro-government militia leaders:
Simon Gatwich Dual Pro-government Nuer militia leader based in Akobo, Upper Nile. With the SPLA, he followed Machar in 1991, becoming an SSDF commander in 1997. In 1999 he began receiving direct government funding. He followed Riek Machar out of the government in 2000 and Riek Machar named him governor of Leich State (Western Upper Nile/Unity State). He went with Riek Machar into the SPLA in 2002 but may have remained in some relationship with the Sudanese government and militias. (Lou Nuer)
Gordon Kong Chuol Pro-government Nuer militia leader based in Eastern Upper Nile. An Anyanya veteran and founder of the SPLM/A, he joined the separatist Anyanya II and fought against the SPLA from 1983-88, when he led the reconciliation of most Anyanya II with the SPLA. With Riek Machar and Lam Akol, he led the breakaway faction that split from the SPLA in 1991. The faction received military assistance from the government and in 1997 signed the Khartoum Peace Agreement with the government. He was made an SSDF (pro-government) commander in 1997 under Riek Machar, and he began to accept direct supplies from the government in 1998. From that time a government militia leader operating out of Nasir with his local Jikany Nuer troops. (Eastern Jikany Nuer)
Gabriel Tanginya (nom de guerre) Commander of government Nuer militia based in Fangak then Pom, Upper Nile, he was associated with Cmdr. Paulino Matiep in the early Anyanya II and with him joined Cmdr. Riek Machar's breakaway rebel forces in 1991. He became a government militia leader by accepting direct government backing in 1998-99. In early 2000 he hijacked a U.N. plane in protest of the U.N.'s alleged transport of commanders to Riek Machar's then location in Koch, Western Upper Nile. (Lak Nuer)
Key Non-Southern Individuals Named in This Report
Awad al-Jaz Sudanese minister of energy and mining.
Lloyd Axworthy Canadian minister of foreign affairs (1997-late 2000) who in 1999 threatened sanctions for Talisman Energy if it was implicated in human rights abuses.
Omar el Bashir President of Sudan who initially took power through a military coup on June 30, 1989, when he held the rank of brigadier general in the Sudan army. Elected later to president when the opposition refused to participate in elections.
James W. Buckee Chief executive officer and president of Talisman Energy, Inc., formerly with British Petroleum before it spun off Talisman as an independent oil company.
Leonardo Franco U.N. special rapporteur for human rights in Sudan mandated by the U.N. Commission on Human Rights from 1998-2000; professor of law in Buenos Aires, Argentina.
John Harker Canadian specialist in African issues and advisor to the government of Canada. He headed the human rights team specially appointed in October 1999 by the Canadian foreign ministry to investigate whether oil development was exacerbating the war in Sudan, and wrote its report in January 2000.
Adolph Lundin Geneva-based oil and minerals investor whose family owns Lundin Oil AB and its subsidiary, the International Petroleum Corporation, part owner and lead partner of the consortium on Block 5A in Western Upper Nile (Unity State) until 2003, and part owner (24.5 percent) of the consortium on Block 5B.
Sadiq al Mahdi Sudanese prime minister (1965-67 and 1986-89), the head of the Umma Party and the Mahdi family, decendants of the holy man who led the Islamic national fight against the Egyptians and British and liberated Sudan from their control in 1881. The Mahdi family also heads the Sudanese Muslim religious sect, the Ansar, which is the base of the Umma Party. In 1995 the Umma Party joined the National Democratic Alliance (NDA, a coalition of opposition armed and political groups) in Asmara, Eritrea, and on its own fielded a small army against the Sudan government in eastern Sudan under overall command of the NDA. In 2000, the Umma Party left the NDA and returned to Sudan to operate as a political party, but refuses to take part in elections and insists on a constitutional conference.
Jafa'ar Numeiri Former general and president of Sudan (1969-85), through a military coup; he created a socialist one-party state. After the Sudanese Communist Party tried to overthrow him in 1971 (and he thereafter executed a number of its major leaders) and Ethiopia joined the USSR camp in the mid-1970s, Sudan under President Numeiri became a U.S. ally and received large amounts of western aid and loans. At various times formed alliances with the Sudan Communist Party, southerners, and Islamists (enacting shari'a in 1983) before he was overthrown by military coup in support of a popular uprising in 1985. He stayed in exile in Egypt until 1999, when he returned to Sudan and was amnestied. Presided over inauguration of the GNPOC pipeline in 1999.
Ali Osman Mohamed Taha Sudanese first vice president since 1998, an active leader in the National Islamic Front in the 1980s, who became the head of the National Congress (NC) until 2000. He joined the side of Pres. Omar El Bashir in an internal NC split between Pres. Bashir and al Turabi.
Hassan Al Turabi Intellectual and political leader of Sudan's Islamist movement since the 1960s, he was named Attorney General under President Numeiri. He advocated the enactment of shari'a; his Muslim Brotherhood was suppressed by Numeiri and Turabi was jailed by Numeiri in early 1985. After Numeiri's overthrow and the reorganization of political parties for elections, he and his followers fielded Islamist candidates under the National Islamic Front (NIF), which took 20 percent of the vote. He was jailed in the immediate aftermath of the 1989 Islamist military coup that overthrew Prime Minister Sadiq al Mahdi. Although he did not hold government or party office until the late 1990s, he was believed to be de facto the most powerful man in Sudan until late 1999, when his former protégé President Bashir curbed his power and dismissed him from the NIF (by then known as the National Congress) in early 2000. He formed a rival Islamist party, the Popular National Congress (PNC) party, and was held in prolonged arbitrary detention by the government in 2001 (after the PNC signed a compact with the SPLA) although the courts ordered him released. As of late 2003, he remains in detention.
Glossary of Terms and Abbreviations
AGI Arab Group International, a corporation run by Prince Sultan bin Saud Abdullah al-Saud, whose 1995 promised funding for Arakis' oil project in Sudan never materialized.
Ansar A Sudanese Sunni Muslim religious sect headed by Sadiq al Mahdi; many Ansar members live in Omdurman and western Sudan. They form the base of the Umma Party.
Anyanya The southern Sudanese rebel (separatist) army of the first civil war, 1955-72; Anyanya is the word for a poison made in southern Sudan.
Anyanya II Southern Sudanese rebel (separatist) forces formed in the south in the late 1970's. The name covered a series of independent groups, some political, some bandits. Ethiopia assisted some of them and by 1982 these began to bring discipline to the others. After the SPLA was formed and backed by Ethiopia in 1983, some Anyanya II resisted incorporation and their leaders allied with Khartoum for military and political support. Groups of Anyanya II came from specific sections of the Gaajak Nuer of Maiwut, the Bul Nuer of Western Upper Nile, the Mor Lou of Akobo, and the Lak and Thiang Nuer of Zeraf Valley. In 1987-90 the SPLA won most of them over, but they remained in their home areas and sided with Riek Machar during the 1991 split in the SPLA. Paulino Matiep, an Anyanya II leader, never joined the SPLA.
Arakis Arakis Energy Corporation, an oil exploration company listed on the Vancouver (Canada) Stock Exchange (VSE). Arakis acquired part of the Chevron concession in Blocks 1, 2, and 4 in the Muglad Basin in Sudan in 1992. In 1997 it formed and led a consortium, the Greater Nile Petroleum Operating Company (GNPOC), to develop and produce oil in those blocks; it was acquired in a friendly merger by Talisman Energy Inc. in October 1998.
Baggara Arabic word for cattlemen. The Baggara are cattle-owning Arabic-speaking (Muslim) nomads of western Sudan, including the Misseriya and Humr ethnic groups of southern Kordofan and the Rizeigat of southern Darfur. Because of the notoriety attached to the name "Baggara" as a result of the resurgence of slavery in the 1980s in Sudan, these ethnic groups no longer want to be referred to as "Baggara."
BCSC British Columbia Securities Commission, responsible for regulating the Vancouver Stock Exchange.
Beja Congress A political party of eastern Sudanese Beja people, which took up arms in the 1990s and joined the opposition National Democratic Alliance (NDA). It claimed responsibility for January and May 2000 oil pipeline attacks. The Beja Congress backed candidates for parliamentary office in the 1950s, 1960s and 1980s.
BP Amoco One of the three largest integrated energy companies in the world, it purchased 20 percent of PetroChina's Initial Public Offering in early 2000. Now called BP.
CARE An international relief and development agency headquartered in the U.S.
CRS Catholic Relief Services, an international relief and development agency headquartered in the U.S.
Chevron Corp. A U.S. multinational integrated oil company granted oil concessions in Sudan in 1974. It pulled out of southern Sudan in 1984 for security reasons and sold off its Sudanese concessions at a loss in 1992.
CNPC China National Petroleum Corporation, a Chinese state-owned oil company that has owned the largest (40 percent) share of the Greater Petroleum Nile Petroleum Operating Company (GNPOC) since 1997.
CPTDC China Petroleum Technology and Development Corporation, a Chinese state-owned company that received 70 percent of the GNPOC pipeline contract in early 1998.
Concorp Concorp International, a private Sudanese oil company owned by Abdullah Jar al Nabi, which purchased the Chevron Sudan concession in 1992 and sold it off in parts. Now owns a private oil refinery north of Khartoum, built to refine Sudanese crude oil for domestic consumption, which became operational in 2000.
Danforth points Four points proposed by former U.S. Senator John Danforth, Special Envoy for Peace in Sudan (appointed by President George W. Bush on September 6, 2001) for the Sudanese government and the SPLM/A to meet in order to prove their desire for peace. They agreed to all four points: a humanitarian six-month cease-fire in the central Nuba Mountains region, with international monitors; willingness to cooperate with an internationally-sponsored commission to investigate the ongoing practice of slavery in Sudan; establishment of "zones of tranquility" to allow for emergency humanitarian interventions; and not to target civilians or civilian objects in the war in the south, with international monitoring.
DUP Democratic Unionist Party, based in the Khatmiyya Muslim religious sect in eastern Sudan, traditionally headed by the El Mirghani family, also head of the Khatmiyya sect. It is a political party in exile and part of the NDA; its leader, Moulana Mohammed Osman El Mirghani, also heads the NDA.
Dinka An African people living in the Bahr El Ghazal and Upper Nile provinces of Sudan; probably the largest ethnic group in Sudan comprising approximately 12 percent of the population in 1983. They speak Dinka, a western Nilotic language, and believe in a Dinka religion but many have converted to Christianity.
GNPOC Greater Nile Petroleum Operating Company, the joint venture among Talisman (its interest acquired by ONGC Videsh Ltd. in 2003), CNPC, Petronas, and Sudapet to own and develop Blocks 1, 2, and 4 of Sudan's Muglad Basin oil fields. It also owns the pipeline connecting the GNPOC oil fields to the Red Sea and the port built on the Red Sea for oil supertankers.
IGAD Intergovernmental Authority on Development (formerly the Intergovernmental Authority on Drought and Desertification, IGADD), comprising Ethiopia, Eritrea, Djibouti, Somalia, Sudan, Kenya, and Uganda. Has hosted peace negotiations between the government of Sudan and the SPLM/A since 1993.
IPC International Petroleum Corporation, a Canadian corporation; it owned a 40.375 percent interest in Block 5A as lead consortium partner; it also acquired a 10 percent interest in Arakis in 1995, sold in 1998. IPC was folded into its parent Swedish corporation, Lundin Oil AB, in 1998.
jallaba Arabic term for merchant, trader, or importer: in nineteenth and twentieth century Sudan it applied to itinerant petty merchants. In southern Sudan it has the additional (historical) meaning of slave trader, and is applied generally to all northern Sudanese. Jallabiya refers to their robe of rough white cotton.
KAIROS Canadian Ecumenical Justice Initiatives/ Initiatives canadiennes oecumeniques pour la justice (formerly the Inter-Church Coalition on Africa/ICCAF)
Khartoum Peace
Agreement Signed in Khartoum on April 21, 1997, by the government of Sudan and six leaders of rebel factions that had been secretly
allied with Khartoum for years.
LRA Lord's Resistance Army, Ugandan rebel group noted for its gross abuses of human rights, including kidnapping and brutalizing Ugandan children; the LRA has been supported by the Sudanese government and operates in northern Uganda out of bases near the government garrison town of Juba in southern Sudan.
Lundin Oil A Swedish oil company traded on the Stockholm Exchange and formerly the NASDAQ. It is the owner of IPC (see above) through which it had a 40.375 percent share in Block 5A of Sudan's Muglad oil fields and retains a 24.5 percent interest in Block 5B.
Médecins Sans An international humanitarian aid organization that provides
Frontières (MSF) emergency medical assistance in conflict zones around the world; winner of the 1999 Nobel Peace Prize.
Misseriya A Baggara ethnic group of Arabic-speaking cattle-owning nomads living in southern Kordofan.
mujahedeen Arabic word for the Muslim concept of holy warriors or participants in jihad (holy war); sometimes used to refer to Islamist militias sponsored by the government.
muraheleen(murahiliin) The Misseriya word for "travelers," now referring to Baggara tribal militias of southern Darfur and southern Kordofan armed by successive Sudanese governments starting with Pres. Numeiri, and incorporated in 1989 into government militias under army jurisdiction.
National Congress The Islamist political party formed from the National Islamic Front under the 1999 Sudan constitution.
NDA National Democratic Alliance, opposition alliance of political parties and armed groups formed in exile; members include the SPLM/A, DUP, Sudan Alliance Forces, Beja Congress, and others; from 1995 to 2000 the Umma Party was a member.
NIF National Islamic Front, the militant Islamist political party that came to power in 1989 after a military coup overthrew the elected government. It was initially known as the Muslim Brotherhood, after the Egyptian Muslim Brotherhood; then the Islamic Charter Front (1964-85); the NIF (1985-2000); and in 1999 renamed the National Congress. Its founder Hassan el Turabi, and others, formed a break-away political party in 2000, the Popular National Congress, after an internal coup lead to Turabi's removal from NC leadership.
Nilotic (western) A language group to which some southern Sudanese belong, including the Dinka, Nuer, Shilluk, Anuak (including Pari), Luo (including Acholi) and Meban.
Nuba The African people living in Southern Kordofan's Nuba Mountains, comprised of fifty ethnic groups and subgroups with over ten distinct language groups using Arabic as their lingua franca. Some are Muslims, some Christians, and some practice traditional Nuba religions. Their territory was divided between government towns and rebel-held (SPLA) rural areas until a ceasefire in January 2002.
Nuer An African people living in the Upper Nile region of Sudan; the second largest people in southern Sudan. They speak Nuer and believe in a Nuer religion although many have converted to Christianity.
OCHA U.N. Office for the Coordination of Humanitarian Affairs.
OEPA Organization of Exploration and Production Authority: a Sudanese government entity.
OLS Operation Lifeline Sudan, the result of humanitarian access agreements to war-affected areas of Sudan negotiated from 1989 onwards between the government of Sudan, the SPLM/A, and the United Nations. The humanitarian operation comes under the U.N. Humanitarian Coordinator for Sudan based in Khartoum. He is assisted by two deputy humanitarian coordinators; one in Khartoum, for operationsin government-held territory; and one in Nairobi, for operations in rebel-controlled territory. OLS in the south is a consortiumof six operational U.N. agencies and forty-five international and Sudanese nongovernmental organizations. It is headquartered in Khartoum and the southern sector is headquartered in Nairobi. The only official entry point by air is from Lokichokkio, Kenya.
OMV OMV (Sudan) Exploration GmbH, owned by the largest company in Austria, OMV Aktiengesellschaft, which is traded in Vienna, Munich, and Frankfurt. It held 26.125 percent of the Block 5A consortium (1997-2003) and 24.5 percent of the Block 5B consortium.
OPEC Organization of Petroleum Exporting Countries, of which Sudan is not yet a member.
PDF Popular Defence Force, an Islamist government-sponsored militia under the jurisdiction of the Sudanese army, which trains, arms, and supervises these forces.
PetroChina Chinese oil company formed of CNPC domestic Chinese assets and liabilities in 1999, in order to float an initial public offering (IPO) to raise money on the New York Stock Exchange (NYSE) for domestic Chinese oil and gas operations; CNPC owns 90 percent of PetroChina.
Petronas Petronas Carigali Overseas Sudan Berhad, the wholly-owned subsidiary of Petronas Nasional Berhad, the national petroleum corporation of Malaysia, which owns a 30 percent share of the GNPOC, a 28.5 (since 2003, a 68.875) percent share of the Block 5A concession, and a 41 percent share of the Block 5B concession, for which it is co-lead partner.
Political Charter Signed April 10, 1996 by the government of Sudan and Riek Machar for the SSIM/A and Cmdr. Kerubino Kuanyin Bol of the SPLA/BEG. Both forces had been cooperating with and receiving material and logistical support from the government long before signing of this political charter.
Proved/
probable reserves Proved reserves: Estimated quantities of energy sources that analysis of geologic and engineering data demonstrates with reasonable certainty are recoverable under existing economic and operating conditions. The location, quantity, and grade of the energy source are usually considered to be well established in such reserves. http://www.eia.doe.gov/glossary/glossary_p.htm, "Energy Glossary."
RASS Relief Association of South Sudan, the relief arm of the forces led by Riek Machar (1991-2003). In 2003, it merged with the SSRA to form the SRRC.
Riek Machar forces SPLA-Nasir, SPLA-United (1993-94), SSIM/A, SSDF, SPDF.
Rizeigat Baggara ethnic group of Arabic-speaking cattle-owning nomads living in southern Darfur.
Royal Dutch/Shell An Anglo-Dutch group of companies of which the two ultimate holding companies are the Netherlands-based Royal Dutch Petroleum Co. (60 percent) and the U.K.-based Shell Transport & Trading PLC (40 percent). The group includes companies operating in more than 135 countries and engaged in the core businesses of exploration and production, oil products, chemicals, downstream gas and power, and renewables. Shell participated as a junior partner in Chevron's oil operations in Sudan in the early 1980s. It has offices in Sudan for storage bunkers and seafreight, and for marketing and chemicals. It entered into a marketing agreement with GNPOC in 1999. As of 2001, it agreed that it would not sell aviation fuel to the Sudanese army.
Samaritan's Purse Only hospital in one hundred kilometers in Eastern Equatoria region of southern Sudan, serving 100,000 people for three years and run by the U.S. religious NGO Samaritan's Purse; it was bombed by the government of Sudan five times in 2000. Located in Lui, Eastern Equatoria.
SIARG Sudan Inter-Agency Reference Group, a consortium initially of eleven Canadian agencies (grown to twenty-two) campaigning to press the Canadian government to develop a just and humane policy on Sudan, especially to require the Canadian oil companies Arakis and then Talisman Energy to divest their Sudan holdings.
SPDF Sudan People's Democratic Front/Defence Forces, a southern antigovernment military and political force formed by Riek Machar in early 2000; merged with SPLM/A by agreement of January 2002.
SPLM/A Sudan People's Liberation Movement/Army, the political organization and army of Sudanese rebels formed in 1983, of which John Garang de Mabior is chairman and commander-in-chief. It remains the largest rebel group in Sudan.
SPLM/A-United Current usage: Sudan People's Liberation Movement/Army-United, a rebel group based in the Shilluk of Tonga, Upper Nile, southern Sudan. It was formed by Lam Akol after his February 1994 expulsion by Riek Machar from the Riek Machar forces which were then called SPLM/A-United. When Riek Machar's faction adopted the name SSIM/A later in 1994, Lam Akol retained the SPLM/A-United name for his group. It joined the government in 1997 under the Khartoum Peace Agreement.
Prior usage: The group that split, under Cmdr. Riek Machar, from the SPLA in 1991 and received covert government assistance. It used the name SPLA-Nasir until March 27, 1993, when prominent individuals joined and it was renamed SPLA-United. In late 1994 the name was changed to SSIM/A.
SRRA Sudan Relief and Rehabilitation Association, relief wing of the SPLM/A; in 2003 it merged with RASS and formed the SRRC.
SRRC Sudan Relief and Rehabilitation Commission, formed of the merger of RASS and SRRA; the relief wing of the SPLM/A in 2003
SSCC Southern States Coordinating Council, created by the 1997 Khartoum Peace Agreement to govern southern Sudan prior to a self-determination referendum to be held (after certain conditions were met) in four years, pursuant to that agreement.
SSDF South Sudan Defense Force, a government umbrella group for former rebel factions headed by Riek Machar until 2000, formed as a result of the 1997 Khartoum Peace agreement between the government and the forces of Riek Machar and other commanders who signed the agreement. After 2000, it was headed by Brig. Gen. Gatluak Deng (removed in late 2002) and then by Maj. Gen. Paulino Matiep.
SSIM/A South Sudan Independence Movement/Army; breakaway faction of the SPLA from 1994 to 1997. Led by Cmdr. Riek Machar, Cmdr. Gordon Kong and Cmdr. Lam Akol, it broke away from the SPLM/A and John Garang's leadership in August 1991. It was based in Nasir, Upper Nile, and for a time was referred to as SPLA-Nasir. It was dependent on clandestine military supplies and cooperation from the Khartoum government. On March 27, 1993, others joined and it was renamed SPLA-United. In November 1994, it was renamed South Sudan Independence Movement/Army to emphasize its focus on southern separation and independence. In April 1996 it signed a political charter and in April 1997 a peace agreement with the government. Its forces were then designated the South Sudan Defense Force (with which other ex-rebel militias joined); its associated political wing was the UDSF. When Riek Machar left the government in early 2000, many of these troops joined his newly-created Sudan People's Defense Forces/Democratic Front (SPDF) but a considerable number remained in the SSDF on the government side.
SSLM/A South Sudan Liberation Movement/Army, a political pro-southern independence movement formed after the Lou Nuer peace and governanceconference in Waat, Upper Nile, in November 1999, and announced in a press release on January 31, 2000; Michael Wal Duany is chairman and commander-in-chief. It described itself as a regional Upper Nile grouping, cooperating with all forces fighting the government for self determination for the south. In July 2002 it signed the Khartoum Peace Agreement with the government.
SSUM/A South Sudan United Movement/Army, formed by government militia leader Maj. Gen. Paulino Matiep from his Bul Nuer constituency in March 1998; always a government ally.
State Petroleum Company that bought the rights to Blocks 1, 2, and 4 from Concorp, which had bought them from Chevron in 1992. Went into partnership with Arakis Energy to develop the oil fields and was bought out by Arakis.
Sudapet Sudapet Ltd., the state-owned oil company of Sudan, which owns a 5 percent share of the GNPOC consortium and 5 percent share of the Block 5A consortium. It owns 10 percent of and is co-lead partner on Block 5B with Petronas.
Sudd The name for the large blocks of aquatic vegetation obstructing the channels of the swamps of the White Nile in southern Sudan (and impeding European and Arab penetration) prior to the twentieth century. Sudd was derived from the Arabic word sadd meaning barrier or obstacle. Today it is used to describe the permanent swamp of the Nile or, more loosely, the whole Nile flood-plain, including the seasonal wetlands as well as the permanent swamp.
Talisman Talisman Energy Inc, the largest independent Canadian oil and gas producer. Headquartered in Calgary, Alberta, it was the operational partner and owned 25 percent of GNPOC from October 1998 until early 2003. Talisman was spun off from British Petroleum and is now one of Canada's largest corporations.
Toic Seasonally river-flooded grasslands in the White Nile basin of southern Sudan. They are exposed late in the dry season as the floodwaters recede and provide excellent pastureland.
TotalFinaElf One of the world's largest integrated oil companies. It operates in more than 100 countries. In 1980 Total of France gained the concession for Block 5 (158,113 square kilometers in the Bor, Pibor and Kapoeta districts of southern Sudan). In 1999 Total allied with PetroFina to be the fifth largest oil company in the world, called TotalFina. In 2000 it merged with Elf-Acquitaine to become the fourth largest oil company in the world, TotalFinaElf. Its Block 5 concession in southern Sudan, which it reduced to about 120,000 square kilometers, has not been developed, due to the war. Block 5 is the largest oil concession in Sudan.
UDSF United Democratic Salvation Front, the political association (party) of ex-rebels headed by Riek Machar until he left the government in 2000. It registered with the government as a political association in 1999.
UMCC Upper Nile Provisional Military Command Council, an anti-government pro-southern independence unified military force created in Waat, Upper Nile, on November 4, 1999, from the mostly Nuer forces of the SSDF, SSUA, SPLA, and others. It declared the Khartoum Peace Agreement dismantled by Sudan government actions and delinked itself from that government, pledging to be responsible to a political body to be formed after adequate consultation among the political cadres of Upper Nile (the SSLM). It dissolved after Riek Machar defected from the Sudanese government in early 2000.
Umma Liberation Army The armed wing of the Umma Party, which became active when the Umma Party joined the NDA in 1995 and inactive when the Umma returned from exile to Sudan in 2000.
Umma Party The political party which was the senior political party in coalition governments between 1986-89, associated with the Sunni Muslim sect of the Ansar and its spiritual leaders, the Mahdi family. One of the two largest parties in Sudan during democratic times, it was part of the NDA in 1995 but withdrew in 2000 and its leadership returned to Sudan from exile to operate as a political party. Its leader, Sadiq al Mahdi, was prime minister twice.
United Nations
Consolidated Inter-
Agency Appeal for Sudan An annual joint appeal by U.N. agencies to raise funds toassist populations affected by conflict and natural disaster
in Sudan.
USAP Union of Southern African Parties, a political party comprised of several parties representing southerners living in the north. A schism in 1996-97 led to party leaders Samuel Aru Bol and Gordon Yoal returning to Khartoum, and party leader Eliaba Surur remaining in exile. Although repudiated by the party in exile, Samuel Aru signed the 1997 Khartoum Peace Agreement for USAP. In 1999 it issued a statement condemning the oil companies operating in Unity state and called on the government to suspend immediately all oil operations there.
World Relief Corp. A U.S., Christian, non-profit organization that provides humanitarian aid, disaster, and emergency relief and is involved in community and economic development, welfare reform, refugee resettlement, and immigration issues around the world, including in Sudan.
World Vision An international Christian, nonprofit humanitarian relief and development organization that works with the poor and oppressed in countries worldwide, including Sudan.
SUMMARY
The first export of crude oil from Sudan in August 1999 marked a turning point in the country's complex civil war, now in its twentieth year: oil became the main objective and a principal cause of the war. Oil now figures as an important remaining obstacle to a lasting peace and oil revenues have been used by the government to obtain weapons and ammunition that have enabled it to intensify the war and expand oil development. Expansion of oil development has continued to be accompanied by the violent displacement of the agro-pastoral southern Nuer and Dinka people from their traditional lands atop the oilfields. Members of such communities continue to be killed or maimed, their homes and crops burned, and their grains and cattle looted.
The large-scale exploitation of oil by foreign companies operating in the theatre of war in southern Sudan has increased human rights abuses there and has exacerbated the long-running conflict in Sudan, a conflict marked already by gross human rights abuses-two million dead, four million displaced since 1983-and recurring famine and epidemics.
Forced displacement of the civilian population, and the death and destruction that have accompanied it, are the central human rights issues relating to oil development in Sudan. The government is directly responsible for this forced displacement, which it has undertaken to provide security to the operations of its partners, the international and mostly foreign state-owned oil companies. In the government's eyes, the centuries-long residents of the oilfields, the Nuer, Dinka, and other southern Sudanese, pose a security threat to the oilfields because control and ownership of the south's natural resources are contested by southern rebels and government officials perceive the pastoral peoples as sympathetic to the rebels. But the Sudanese government itself has helped to create the threat by forging ahead with oil development in southern territory under circumstances in which its residents have no right to participate in their own governance nor share the benefits of oil development. Brute force has been a key component of the government's oil development strategy.
The oil in the ground and flowing through the pipeline to the Red Sea supertanker port has driven expulsions from Western Upper Nile/Unity State, the area of the main oil production today. In earlier campaigns in the 1980s government troops and horsebacked militia of the Baggara, Arabized cattle nomads of Darfur and Kordofan, invaded from the northwest, destroying communities and expelling much of the population from the initial exploration areas, in Blocks 1, 2, and 4, dangerously situated on the north-south border of Sudan. (Map B)
In the 1990s the government embarked upon a more sophisticated displacement campaign, through the use of divide-and-conquer tactics: it bought off rebel factions and exacerbated south-south ethnic differences with arms supplies. Mostly Nuer factions with political and other grievances against the Dinka-officered rebel Sudan People's Liberation Movement/Army (SPLM/A, referred to as SPLA when discussing the military wing), emerged and a bloody south-south war ensued, concentrated in the oilfield areas. Campaigns of killing, pillage, and burning, enabled by government troops and air support for their southern allies who served as front troops, cleared the way for Western and Asian oil corporations to develop the basic infrastructure for oil extraction and transportation: rigs, roads, pumping stations, and pipelines.
The relationship of the war and displacement campaign to oil development is evident: the oil areas targeted for population clearance are those where a concession has been granted and a pipeline is imminent and/or nearby. The availability of the means of transport of oil to the market makes the nearest undeveloped block economically viable. The agro-pastoralists living there then become the target of forced displacement. Since 1999, when the pipeline was nearing completion and Blocks 1, 2, and 4 came on line with 150,000, then 230,000 barrels of crude oil produced daily, the main military theatre has been in the adjacent Block 5A. Oil revenues enable the government to increase its military hardware: it tripled its fleet of attack helicopters in 2001 with the purchase abroad of twelve new helicopters-used to deadly effect in the killing of twenty-four civilians at a relief food distribution site in early 2002, to cite only one example.
In a number of cases, international oil companies in Sudan have denied that any abuses were taking place in connection with oil exploration and production. Despite considerable evidence to the contrary, oil company executives have claimed that they were unaware of any uncompensated forced displacement as a result of oil operations. They have also claimed to have undertaken investigations establishing that abuses are minimal or nonexistent. As noted below, such efforts do not stand up to scrutiny. Increasingly, under pressure from nongovernmental organizations (NGOs) and some concerned governments, oil company representatives have claimed instead that they are playing a positive role in difficult circumstances to monitor and rein in abuses. As detailed below, such claims have consistently been self-serving. Human Rights Watch believes that oil companies in Sudan, seeking to make a profit in areas of the country wracked by civil war and often brutally cleared of indigenous peoples, have an obligation to see that rights abuses connected with oil production cease.
This report is about the human cost of the oil-and corporate complicity in the Sudanese government's human rights abuses, including its policy of sponsored ethnic conflict and forced displacement to clear tens of thousands of southern Sudanese from their homes atop the oilfields.
The first part of this report describes early developments in the oil sector in Sudan, summarizing the experience of Chevron beginning in 1974 and Arakis beginning in 1992 in Blocks 1, 2, and 4. Part one also details the historical evidence that, contrary to oil company and Sudanese government assertions, southern Sudanese had long lived in the oilfields, and were displaced as a result of the oil operations. The second part of the report covers oil development by Lundin (IPC) in Block 5A starting in 1996 and the role of Talisman Energy starting in 1998 in continued development of Blocks 1, 2, and 4, examining the large-scale displacement that continued to accompany oil development and intensified civil war in the region. The third part of the report provides a detailed account of the human rights consequences of oil development in Sudan, including population displacement, ethnic manipulation, aerial bombings of civilians, property destruction, waste, and, especially for many Nuer and Dinka, human misery and despair. The fourth part considers what oil company representatives knew and the extent of their complicity, and their governments' all too common preference for business as usual over policies aimed at ending abuses.
The Displaced
According to information provided by the United Nations (U.N.) World Food Program (WFP) and others, as of March 2002 an estimated 174,200 civilians remained displaced as a result of the conflict between the government and its southern militia proxies, and the rebel SPLM/A in the oilfields of Western Upper Nile/Unity State (roughly Blocks 1, 2, 4, 5A, and 5B). Numbers are at most estimates, and hard to come by, but the displacement continues as of the writing of this report, in spasms of military attacks by government army forces and Nuer militia (or armed groups, as they now prefer to be called), joined in by militia of the Baggara tribes to the northwest. The uprooted civilians' movements in search of safety and food took them in different directions, sometimes to the edge of another oil concession, sometimes to the toic (seasonally flooded grasslands), sometimes to a garrison town or relief airstrip, and sometimes outside of Western Upper Nile/Unity State. This count did not include many others who fled to areas inaccessible to the U.N. and other relief organizations, or to northern towns such as Khartoum.
The estimated numbers break down as follows: 1998-99: 70,500 displaced from/within Western Upper Nile/Unity State; and 2000-February 2001: 134,000 displaced; as noted above, by March 2002 a total of 174,200 civilians were listed as displaced from the oilfields in two regions, Lakes (part of Bahr El Ghazal) and Upper Nile. This is a conservative estimate as it does not include the oilfield displaced that went to other parts of Bahr El Ghazal or to Khartoum. The displacement has continued in sporadic surges of tens of thousands ever since.
The Nuer and Dinka people, members of the two largest ethnic groups in the south, have borne the brunt of the war in their home territories, through war-caused displacement, death, disease, dislocation, asset destruction, and recurring famine.
The year 1999 saw a significant escalation of conflict and displacement, shortly after the Canadian company Talisman Energy Inc. became the operating company for the concessions in Blocks 1, 2, and 4 and brought much greater financial muscle and technical expertise to bear on opening up oil production in Sudan. In mid-May 1999, the Sudanese government launched an all-out attack lasting several weeks on Dinka communities in the eastern part of Block 1. The assault commenced with aerial bombardment, followed by ground troops who looted freely and burned everything. Tens of thousands of people were displaced.
The completion of the pipeline from Block 1 to the Red Sea in May 1999 meant that Block 5A became commercially viable in a way it had not been before. A government offensive into the block followed ineluctably. Survivors described to Human Rights Watch the exodus of Nuer civilians being chased by pro-government militia from Block 5A's oilfields in late 1999. The displaced Nuer carried fishing spears, but most left behind even such basic necessities as kitchen spoons and cooking utensils. Some had a few implements and mosquito nets but they could not carry much because they were carrying their children. They tried to save their cattle, their main asset, but those cattle that were too exhausted to keep up and straggled behind were attacked by lions.
On the long walk through the wetlands to Makuac, in Dinka territory, "There was so much water on the way, and we were walking with children, that it took a week,"said a Nuer chief of Ler, who took part in the flight. "Hunger was the main problem," he said, while the cold and rain were both a curse and a blessing: "The rain saved our lives. It stopped them from chasing us, and we kept walking through the rain. Small children died of cold on the way, and had to be left on the road." He said there was hunger and sickness, such as relapsing fever, malaria, and skin diseases. "The main thing was the mosquitoes eating us alive, leaving rashes, scabies. We drank the water from the road and toic. There were rivers with water lilies and fish; we ate both." Twenty-three people from one group died of hunger, exposure, and disease on the way to safety in Bahr El Ghazal.
We slept on the grass, outside. This is what killed some children. A boy aged eight and a girl of ten years were lost on the way. I do not know if the wild animals got them. When they were missing we searched for them and could not find them. We lost both in the toic after crossing the Dinka border, near the cattle camp Ngot. The girl's name was Nyanit Biel.
These were not the only abuses. Boys were conscripted and women raped. One boy soldier forcibly inducted by Nuer pro-government militia said, "If they captured you and then took your sister as a wife [raped her], if you were angry, they would beat you. They are serious about raping." A young woman who had never been captured described her fear. "They are abducting girls and making them their ladies [raping them]," she said, to explain why she had been in hiding before leaving her village of Ger. She knew some of the girls who were abducted, including a young woman of her age-eighteen-who was taken with three girls from a village one hour away.
Their mother came to our house and told us of the abduction by the renegades [pro-government militia]. No one knows what happened to them. Their mother tried to follow but she could not find them.
This young woman had been hiding in the forest and going home at night to sleep. After hearing of the abductions, she fled south.
This suffering has continued in the same pattern to date. In February 2000, the Swedish company Lundin Oil AB, lead partner in Block 5A, announced that the lack of a road had delayed its drilling operations. The government's dry season military activities in 2000 in Block 5A appeared designed precisely to capture land for, construct, and secure a road leading to Lundin's fields and the Sudanese army garrison at Ler. In the ensuing months of fighting, most of it between Nuer rebels opposing the government and the government's Nuer militias, tens of thousands of civilians in the Block 5A and adjacent Block 4 oil areas were uprooted. During this time, with the rebels distracted and on the defensive, the oil companies forged ahead with construction of a north-south all-weather road from Bentiu, on the border of Blocks 1 and 5A, to an exploratory drilling site at Ryer/Thar Jath, and Ler, reaching the Nile port of Adok in southern Block 5A in January 2001.
By July 28, 2000, thousands of civilians were on the move from both the pro-government militias and the rebel forces. Relief workers in a plane flying over the fifty kilometers between Nimne and Nhialdiu in Block 5A saw few people, huts, or cattle, because a wide swathe of land, as far as they could see, had been burned to the ground. Many civilians from the area fled or were driven west and north; many thousands were seen with their cattle and mats (but no other possessions) camped on the banks of the Jur River in late July 2000. Those who could manage to swim across with their cattle did so. A separate mass of up to 60,000 people made it to the relative safety of Bentiu, a garrison town.
By early 2001, the oil road south of Bentiu was heavily defended by military patrols and guard posts. While the oil companies said that civilians were living there and enjoying the road, the tens of thousands of people already displaced from there to other less militarized areas told an entirely different story-one of people forced from their land, their cattle stolen, homes and possessions destroyed by government agents without the least notice or compensation. They were abandoned to the over-extended and under-funded international relief network, whose operations were the object of a government cat-and-mouse game in which a government "win" meant that the newly displaced were cut off from international aid altogether.
In late 2001-early 2002, newly reunited rebel forces-including a previously government-allied militia that had been guarding the Block 5A installations-went on the offensive. The rebels succeeded in ambushing several large government military convoys on the oil road in Block 5A, stymieing oil operations for a period.
The government used heavy bombing-including a total of sixteen new attack helicopters, purchased abroad in 2001-2002 with oil revenue-in an attempt to retake and secure the oil road and operational area. It also deployed Baggara militia for the first time south of the Bahr El Ghazal (Nam in Nuer) River. The Lundin-built bridge at Bentiu made it possible for the first time for the government-armed Baggara horsebacked raiders to attack in this area of Block 5A. Civilians ran for shelter further south and west, into a marshy area crossed by streams where the horses could not reach; from there the newly-purchased government attack helicopters often picked up the chase. The civilians were scattered and isolated, hungry, thirsty, and tired, beyond the reach of aid agencies, which the government prohibited from searching for them. Many of those who were uprooted and dispossessed of all means of survival faced famine and death in the unfamiliar areas to which they fled. Block 1 was also a target of Sudanese army offensives and SPLA counter offensives throughout 2001, including a government attack with new helicopters and ground troops in October in Ruweng (Panaru) County, in which an estimated 80,000 persons were displaced.
Ongoing armed conflict has led to continued flight; establishment of government garrisons has prevented the displaced from returning to their homes. While both sides employ modern weapons, the government has produced and purchased more and better weapons with its new oil money, including sixteen new attack helicopter gunships in 2001-2002, more than tripling its military helicopter fleet.
The government made civilian suffering worse by banning relief flights from reaching those who try to cling on in areas the government wants cleared. The government repeatedly refused international relief access to Nuer and Dinka oilfield areas that were in rebellion against the government, calculating that the civilians, who have lost everything in attacks on their villages, would be forced by famine to migrate elsewhere-anywhere-in search of food. It also prohibited humanitarian access to those recently displaced, if they remained in areas near the oilfields.
Even as the government entered into peace negotiations in 2002, it stepped up its attempts to close off Western Upper Nile/Unity State to all relief except that which went to its garrison towns. Finally, under extreme foreign pressure and in the middle of peace talks, the Sudanese government relented on humanitarian access in October 2002. The ceasefire, signed that same month, was broken mostly in Western Upper Nile/Unity State's oilfields.[1]
Sudan's Land and Peoples
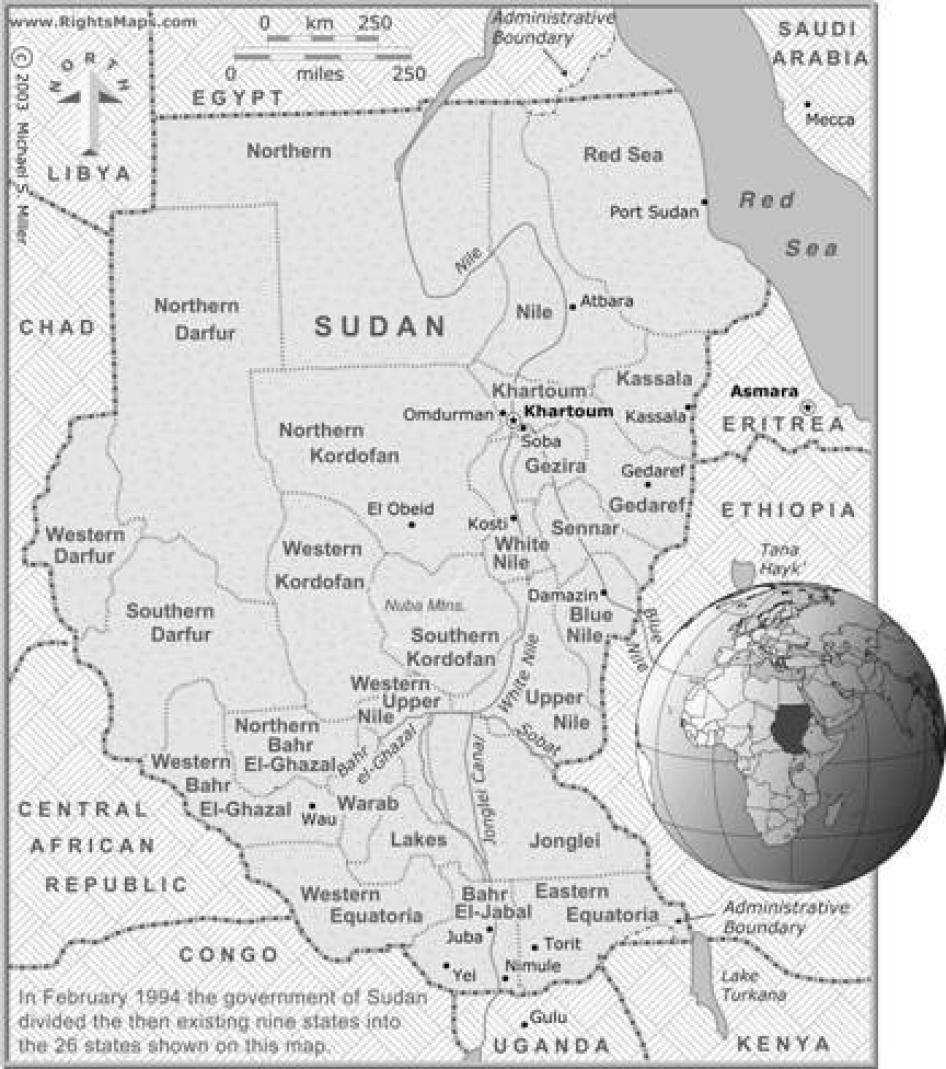
Sudan's 2.5 million square kilometers make it the largest country in Africa, more than one quarter the size of the United States (U.S.). Because of lack of water in the vast northern desert part, half the population lives in just over 15 percent of the land, along the Nile and, in the south, along its many tributaries and annually flooded areas.
Sudan's estimated 30.3 million people are even more varied than its desert-savannah-floodplain-swamp-rainforest terrain. (Map A) They are divided among nineteen major ethnic groups and some 600 subgroups who speak more than one hundred languages and dialects. In the first and only ethnic census taken (1956), Arabs were 39 percent, and Africans 61 percent, of whom Dinka were the largest group at 12 percent of the total population. Perhaps 70 percent of the population is Muslim, most living in the northern two-thirds of the country. The rest of the population practices traditional African religions or Christianity.
The African non-Muslim citizens who populate the south have been at war with the central government, dominated by an Arabized Muslim elite, since independence in 1956. State power remains in the hands of this elite, which dominates the officer corps of the army, security agencies, and other implements of power-although poverty-stricken Africans from the Nuba Mountains, west and south of Sudan make up the bulk of the soldier class.
Although there was a decade of peace and southern autonomy in 1972-83 after the separatist southern rebels laid down their arms, it came to an end when the central government abolished the southern autonomous region and made shari'a (Islamic law) the law of the land in 1983. The civil war flared up again, but with a different political agenda. While southern sentiment remains strongly separatist, Dr. John Garang, the leader of the main rebel force, the SPLM/A calls for a "united, secular Sudan."
The human rights catastrophe in Sudan's oilfields cannot be seen in isolation from the larger conflict between the ruling riverain Arabized and Muslim elite and the vast economically, politically, and socially marginalized sections of the population, west and east, north and south. It is difficult to overstate the historical differences and special distrust that divide the south from the northern or ruling elite. The south has been starved of development resources, its economy one of pastoral and agricultural subsistence, its children uneducated, and health clinics almost nonexistent. Without doubt it is one of the most underdeveloped regions in the entire world. Sudan has enjoyed democracy only sporadically, and even then southerners have been in the minority in a country where respect for minority rights and cultural diversity is decidedly lacking.
Therefore, when oil was discovered in the south in 1978, control over it became a hot issue. Leaders of the autonomous Southern Region protested the northern-dominated central government's plans to locate the pipeline through the north, to build a refinery in the north and, they feared, to divert all profits and jobs away from the south to the north. This is exactly what has come to pass by means of the debilitating and never-ending war in the south (1983 – present).
Oil in Sudan: The Corporate Holdings
The large oil reserves in Sudan, which are located almost entirely in the southern third of the country, make it potentially a producer in the Brunei/Colombia range. It is not considered a potential megaproducer on the level of Saudi Arabia or Iraq.[2] But, if properly managed, its oil resources could be a godsend to a country as poor as Sudan, where the annual per capita gross domestic product is an estimated U.S. $ 424.
The main area of oil exploration and production in Sudan to date, the Muglad Basin, stretches southeast down across the midsection of the country, from El Muglad in Western Kordofan through Bentiu and Western Upper Nile, known by the government as Unity (al Wihda) State, to Juba on the White Nile and Eastern Equatoria.[3]
The Western Upper Nile/Unity State area was traditionally the homeland of the Nuer people. Oil exploitation in southern Sudan began north of Bentiu, in Western Upper Nile/Unity State-in Blocks 1, 2, and the southernmost parts of Block 4, the sites of Unity and Heglig oilfields. (See Map B.) The oil history and development of Block 5A, which is a continuation of the Muglad Basin to the south east of Blocks 1 and 4, has been controlled by the developments in these blocks. Blocks 1, 2, and 4 total nearly 19,500 square miles (50,500 square kilometers or 12.5 million acres).[4] Block 5A totals 8,076 square miles (20,917 square kilometers or 5.2 million acres), and Block 5B totals 7,768 square miles (20,119 square kilometers or 5 million acres).[5]
Petroleum exploration in Sudan began in the early 1960s. Activity was originally concentrated offshore in the Red Sea. In 1974, two years after the peace accord that ended the first civil war (1955-72), the Sudanese government granted the Chevron Oil Company (U.S.) large oil concessions in Sudan. Chevron discovered and named the Muglad and Melut basins. It drilled for and found oil near Bentiu town in 1978. The government named the oilfield "Unity." It was located in Block 1, inside Upper Nile province, part of the autonomous Southern Region. Soon after, Chevron discovered the Heglig field, in Block 2. Chevron spent about U.S. $ 1 billion on exploration but never recovered it costs. It suspended activities in southern Sudan in 1984 due to a rebel attack that killed three expatriate oil workers and other security concerns. The French firm Total, which acquired various oil concessions around 1980, also suspended its onshore exploration activities, but retained its rights, including to Block 5, which, at 120,000 square kilometers, is larger than the size of Blocks 1, 2, 4, 5A, and 5B combined.
The Islamist-military government that took power in 1989 was determined to develop Sudan's oil potential. It forced Chevron to sell its concession and sub-divided it into smaller exploration blocks. In 1993 Canadian independent Arakis Energy acquired the portion of Chevron's concession north of the town of Bentiu, namely Blocks 1, 2, and 4. In June 1996, Arakis brought eight wells on stream in the Heglig field, subsequently trucking low levels of crude oil to a small refinery at El Obeid in Northern Kordofan for domestic consumption.
On December 6, 1996, in need of cash for the project, Arakis sold 75 percent of its interest to three other companies, with which it formed a consortium called the Greater Nile Petroleum Operating Corporation (GNPOC), whose value Arakis put at approximately U.S. $ 1 billion. Arakis was to be the operational partner. The three other companies were state-owned: the China National Petroleum Company (CNPC), Petronas Carigali Overseas Sudan Berhad (a subsidiary of Petronas Nasional Berhad, the national petroleum corporation of Malaysia), and Sudan's state-owned oil enterprise Sudapet Limited. They would own 40 percent, 30 percent, and 5 percent of the project, respectively. CNPC and Petronas put up project financing until mid-1998.
Although Arakis had been working proven oilfields in Sudan since 1992, by mid-1998 it had relatively little to show for it. The Sudanese oil industry remained in rudimentary form, producing only for local consumption. The country still imported most of its petroleum needs.
On October 8, 1998, Canada's largest independent oil and gas producer, Talisman Energy Inc.,[6] acquired Arakis and Arakis' main asset, the Sudan project. Talisman, with its superior technology and experience, brought major improvements for the benefit of the war-stressed and cash-poor Sudanese government. It took only one year after Talisman joined the consortium to boost development of the Heglig and Unity fields in Blocks 1 and 2, to finish a 1,540-kilometer (1,000-mile) pipeline to the Red Sea, to build a new marine terminal for oil supertankers, and to pump and export the first crude oil from Sudan. This project transformed Sudan from a net hydrocarbon importer into a potential member of the Organization of Petroleum Exporting Countries (OPEC), the cartel of oil-exporting countries. In August 1999, the first oil for export earned the Sudanese government U.S. $ 2.2 million in one shot. Much more was to come. Talisman estimated that, over the life of the Heglig and Unity fields alone, the government of Sudan would earn approximately Canadian $ 3 billion to $ 5 billion (more than U.S. $ 2 billion to $ 3 billion), depending on the international price of oil.[7]
Because of Talisman's successful exploration, by 1999 reserves in Blocks 1 and 2 were discovered to be much larger than previously thought-403.6 million barrels in 1998 and an increase to 528 million barrels in reserves in 1999.[8] In 2002, a breakthrough in exploration on Block 4 indicated that there might be an additional 160-240 million barrels of oil in the GNPOC concession.[9] By April 2002, it was estimated that current proven plus probable ultimate recovery of the GNPOC concession would be one billion barrels of crude oil.[10]
From 150,000 barrels per day of oil pumped by GNPOC in 1999 (annualized), production increased to 230,000 barrels per day (b/d) by year end 2001.[11] Actual output for 2002 reached 240,000 b/d.[12]
Talisman's projections indicate a peak production from the GNPOC blocks at 250,000 b/d in 2005 and the sharp and continual decline in production to 40,000 b/d in 2020.[13] This projected decline in production meant that the government needed to bring new blocks on line, in order to maintain at least a steady flow of oil revenue.
On October 30, 2002, Talisman announced that it had agreed to sell its Sudan interests to ONGC Videsh Limited, a subsidiary of Oil and Natural Gas Corporation Limited, India's national oil company, for a net return on investment of 30 percent. International human rights pressure greatly contributed to the pressure for Talisman to leave Sudan. Chief Executive Officer (CEO) Jim Buckee said, "Talisman's shares continue to be discounted based on perceived political risk in-country and in North America to a degree that was unacceptable for 12 percent of our production."[14]
The disastrous human rights developments in Block 5A from 1999 onward were related to GNPOC's successful production in Blocks 1 and 2 and the approaching completion of pipeline facilities in GNPOC's Blocks. Without the pipeline, the oilfields in Block 5A would have remained as Chevron left them, undeveloped, attracting little military attention. Block 5A was an area the government had long ago conceded to the rebels, as of no strategic interest and having a particularly difficult, swampy environment; but with the GNPOC pipeline completed only a short distance away, it became economically feasible, gained strategic importance, and became a military priority for the government.
On February 6, 1997, the International Petroleum Company (IPC), a wholly-owned subsidiary of Lundin Oil AB, signed an exploration and production-sharing agreement with the Sudanese government, granting IPC (referred to here as Lundin, the name of the Swedish family controlling IPC) rights to Block 5A, adjacent to and south-southeast of Block 1. IPC (or Lundin), the lead partner, held 40.375 percent of the concession, and the Malaysian state oil company Petronas held 28.5 percent; OMV (Sudan Block 5A) Exploration GmbH, owned by OMV AG, one of Austria's largest listed industrial companies, held 26.125 percent; and Sudapet held 5 percent. Lundin also owned 10 percent of Arakis' stock.[15] (In 2000 Lundin and OMV also acquired a 24.5 percent interest each in Block 5B.) Lundin estimated there were 115 million barrels in reserve in Block 5A, but nothing has been produced so far from the concession.[16]
Lundin's explorations in Block 5A were suspended twice due to insecurity, last in January 2002. On March 27, 2003, Lundin announced the resumption of activities.[17] In June 2003, Lundin sold out its interest in Block 5A to Petronas, while retaining its interest in Block 5B.[18] A few months later, in September 2003, OMV agreed to sell its interests in both blocks to ONGC Videsh Limited of India.
Government Strategy of Divide and Displace
In order to control the production of oil, the unelected government of Jafa'ar Nimeiri (1969-85) adopted a two-pronged strategy, division and displacement of the southern population. It has taken almost two decades and various governments to develop and refine this strategy, but the division and displacement strategy has accomplished what direct military action from the central government alone could never achieve: clear control of certain oil areas in southern Sudan.
The political tactic was to conceal the hand of the government by encouraging government proxies-land-hungry neighbors-to attack the agro-pastoralists of the oilfields. With the population thinned out, the government could erect a "cordon sanitaire" around the producing areas in Blocks 1, 2, 4 and 5A for foreign oil companies to exploit in peace and security-while those who had lived for generations on the land were robbed of their peace, security, homes, animals, crops, families, and often their lives.
In the 1980s, the government of dictator Nimeiri (1969-85) and then the elected government of Prime Minister Sadiq al Mahdi of the Umma Party (1986-89) armed militias of the Baggara, Arabic-speaking cattle-owning nomads, to drive southerners from their own land, in particular the Nuer and Dinka ethnic groups to the south and east of the Baggara, steadily clearing out Blocks 1, 2, and 4 for oil development. The north-south border drawn by the British cuts through Blocks 2 and 4. (See Map B)
The Baggara horse-backed militias, known as muraheleen, with state and central government-supplied automatic weapons, were allowed full impunity in Western Upper Nile/Unity State to loot cattle and burn, and to kill, injure, and capture Nuer and Dinka, whose men resisted on foot, mostly with spears.[19] The government granted impunity to its proxies for what they stole and whom they murdered. Government soldiers in trucks later came through, with equal brutality and greater thoroughness, to erect garrisons and stay, occupying the land and preventing most of those displaced from returning.
Inside Block 4, west of Bentiu, and probably not far from what later became an oilfield, there were schools attended by hundreds of Leek Nuer children in 1983, according to a man who then served as school administrator. These Nuer were pushed by the Baggara in the mid-1980s to cross the Bahr El Ghazal (Nam) River for safety. The school administrator said:
The Baggara looted the Nuer cattle, and sold it to traders. They killed people, abducted girls and boys to be slaves, and sold some to Libya. If a person were lucky, his children would be in Khartoum. Most of those abducted disappeared. This started . . . when the government of Sudan gave guns to the Baggara.[20]
The schools the administrator was managing closed from 1983 until 1991 because the Baggara raiders destroyed them. Whole communities fled; many families were separated.
In 1983, mutinies by southerners within the Sudanese army led to the creation of the SPLM/A, and then the full-scale resumption of the civil war. By 1986, the SPLM/A dominated most of Western Upper Nile-except for the government garrison towns, some oilfields north of Bentiu town, and the Bul Nuer area, which was loyal to the commander of a pro-government militia, Paulino Matiep, who had never joined the SPLM/A and to whom the government referred as a "friend" of the army.[21]
In the face of SPLM/A successes, the Sudanese government further developed its preferred strategy of divide and rule. In addition to deploying the army and Baggara militia to protect the oilfields, the Sudanese government also implemented a strategy of dividing southerners and buying off those occupying strategic territory. It cultivated Cmdr. Paulino Matiep as its primary surrogate force to keep the SPLM/A presence-and that of other hostile forces-in the oilfields at a minimum. Paulino Matiep's role was to become ever more important in the years that followed.
The government took advantage of a 1991 split in the SPLM/A-which broke into two factions mainly along Dinka/Nuer ethnic lines-to begin covertly aiding the mostly-Nuer breakaway faction led by prominent Nuer leader Dr. Riek Machar Teny Dhurgon. This force changed names as it changed alliances, and was last known as the Sudan People's Defence Forces (SPDF). (In January 2002, the SPDF and the SPLM/A signed a unity agreement, reuniting many of the forces that split in 1991.[22])
The Nuer were the key ethnic group as far as oil development was concerned. Nuer territory extended to most of the Muglad and Melut basins, with Dinka being the second largest ethnic group in the southern oilfield regions.
In 1996, Riek Machar and one other commander signed a Political Charter with the government. In 1997, the Khartoum Peace Agreement was signed between the government, the Machar faction, and other political and armed groups at odds with the SPLM/A. The Khartoum Peace Agreement provided for a referendum on self-determination, a widely-held southern aspiration. But the referendum was to be held four years after conditions were right, and has not been held to date. Instead, the Nuer became victims of extensive displacement at the hands of their government "allies."
The Khartoum Peace Agreement of 1997 was what the government needed to show foreign oil investors. It supposedly put an end to the war that had driven Chevron away; it provided African "ex-rebel leaders" to meet with and to assure oil investors that Chevron's bad experience would not be repeated; and it supplied ex-rebel forces with arms and ammunition to brush away the rebel "remnants" who might venture too close to the oilfields.
But the northern-based government fundamentally mistrusted southerners. It would neither rely on southerners as firm allies nor allow them to grow too powerful. It directly provisioned various smaller Nuer commanders, thus winning them away from Riek Machar's forces. In addition, the government issued renewed calls to students and others in the north to join militias known as "Popular Defence Forces" (PDF), including one known as the "Protectors of the Oil Brigade," that it then deployed to the oil areas of the south.
When the pro-government Nuer militia of Paulino Matiep began attacks in late 1997 into the territory of Riek Machar, supposedly a government ally, the government publicly dismissed the fighting as "tribal clashes." Since all these forces were southern, the government claimed it was remote from "inter-factional" fighting between southerners and could not control it. But the government did not lift a finger to stop it. The government itself promoted the myth of the "ungovernable south" sure to plunge into anarchy that would end in a "Rwanda" scenario, unless there was steady oversight from Khartoum.[23] By selectively arming ethnic factions-providing arms and ammunition to Nuer pro-government militias to fight against another Nuer factions and the SPLM/A-the government's actions were actually making that Rwanda scenario more, not less, likely. The strategy of fielding southern forces as its proxies was a government attempt to evade accountability for its actions. The creation and nurturing of southern proxies also helped to prevent unification of the southern political and military forces opposing the government.
The government's ethnic divide and displace strategy was especially devastating for the Nuer: it encouraged and armed them to fight each other in scorched earth campaigns-at home. They were skilled in familiar terrain, as the government troops were not, at lightning raids conducted regardless of the harsh geography and weather, including during the wet season when government troops, vehicle-bound, could not engage.
With heightened development interest in Block 5A, as Talisman was completing the pipeline to the Red Sea in 1999, the strategy of arming southern proxies to fight the war became even more important to the government. The Block 5A oilfields did not border the Baggara or the north-south divide; they were deep inside the south where rivers traditionally barred the advance of the Baggara militias on horseback. The government's proxy for clearing those Nuer-populated oilfields therefore would have to be Nuer. But Riek Machar's forces, instead of cooperating with the government, challenged the government's right to control the Block 5A oilfields. First, Riek Machar tried negotiations. In February 1999, Sudan's minister of defense met him, and insisted that Sudanese army forces must guard the oilfields, including Lundin in Block 5A. Riek Machar disagreed, insisting that his forces had guarded Lundin since 1997 and should continue.
In April 1999 Lundin drilled an exploratory well at Thar Jath (known to locals as Ryer) in Jagei Nuer territory of Western Upper Nile/Unity State in Block 5A. Representatives of the Khartoum government held a meeting in Bentiu (Block 1 and capital of Western Upper Nile/Unity State) with Riek Machar's United Democratic Salvation Front/South Sudan Defence Force (UDSF/SSDF) in late April 1999. At this meeting, Sudanese ministry of defense representatives again told Riek Machar and his colleagues that the government army would protect all the oil areas in Western Upper Nile/Unity State. There was no agreement, however. Elijah Hon, an SSDF commander and later its chief of staff, described the discussion in an interview in July 1999:
We said the oil workers can go there [Block 5A], but not the government of Sudan. The government of Sudan refused this. We said the presence of two armies would involve problems. They said that the [government] army should be free to go anywhere in Bentiu [Unity State]. This is a violation of the Khartoum Peace Agreement, [we said,] which requires [our] consultation and approval.
Within days, a campaign of forced displacement from the Block 5A oilfields had started up again, in which the government army, government-backed Paulino Matiep's Nuer militia, and northern militia all participated. It ranged through Block 5A, chasing the Macharforces-which had run out of ammunition-and Nuer civilians out of the area to Dinka land in the west or to other Nuer areas to the south and east. Government forces occupied the Block 5A drilling location, Thar Jath (Ryer).
In 1999, the Sudanese army also began operations to displace civilians remaining in and around an oilfield area north of Bentiu. Beginning May 9, 1999, the army launched an offensive against Dinka villages in Ruweng County, in eastern Blocks 1 and 5A. The attack was an all-out effort by the Sudanese government. It first used Antonov bombers and helicopter gunships and then tanks and armored personnel carriers backed by militia and army soldiers from garrisons at Liri in the Nuba Mountains and Pariang in Block 1. A local SPLM/A commissioner commented, "The reasons for the attack are clear: they want to exploit the oil in this area without fear of local resistance, so they are clearing the area and removing all the people." The Sudanese government offensives of 1999 into the oil producing areas pushed several previously opposing forces from the south back into alliance against the government. Riek Machar's zonal commander in Western Upper Nile/Unity State, Cmdr. Tito Biel Chol, sought and received ammunition from the SPLA, from which he and others had split in 1991. He launched two attacks to roll back government forces in Block 5A, but by August 1999 his forces were again pushed back. The government militia and forces ran over the same small towns and villages three times, repeatedly displacing civilians. As the numbers of displaced rose, the government tightened the noose by refusing relief access to their places of refuge until tremendous international pressure was brought to bear.
It was at this time, September 1999, that most of Paulino Matiep's forces, led by his Western Upper Nile/Unity State zonal commander Peter Gatdet, mutinied against the government, disgusted with the Nuer-Nuer fighting while the government drained off Nuer oil. Peter Gatdet, Tito Biel, and many other Nuer commanders in November 1999 formed a military command council, the Upper Nile Provisional United Military Command Council (UMCC), which was to have supreme military authority over all the antigovernment forces in Upper Nile. The commanders were also dissatisfied with the role of Riek Machar in cooperating with the government despite the government's refusal to give his forces the right to control the oilfields, and its refusal to honor the Khartoum Peace Agreement.
The new alliance radically and formally changed the military and political situation in Western Upper Nile/Unity State, with a sizeable increase in the number of antigovernment Nuer forces-Tito Biel's and Peter Gatdet's. This left the government with far fewer Nuer troops to front for it there. In response, the government initiated a heightened drive to recruit more young "volunteers" from universities for the more reliable, Islamist-inspired militias.
Just when it seemed that there was a chance that Nuer rebels opposed to the government would gain unity under the UMCC, however, Riek Machar resigned from the government and returned to the southern rebel area. He then created yet another political/military movement, the Sudan People's Defence Forces/Democratic Front (SPDF) in February 2000. His personal maneuvers in exile to retain a significant political and military role in the affairs of Sudan played straight into the hands of the government.
For a while, Machar's Nuer forces (including many who had signed on with the UMCC) and those of Peter Gatdet, who had since joined the SPLM/A, combined. Their actions included impeding the construction of the oil roads for Blocks 5A and 4, which were guarded by the government troops and the Paulino Matiep militia. But in April 2000, the Sudanese government launched a new offensive supported by hundreds of muraheleen (Baggara militia) on horseback. Backed by artillery, gunships, and Antonov bombers, they advanced into Block 4. Another government force advanced from Bentiu south to their military stronghold at the Block 5A oil exploration site at Thar Jath (Ryer).[24]
The working alliance among the Nuer rebels did not last long; its end was hastened by the government's ready supply of ammunition to the Riek Machar commanders to fight the SPLA/Gatdet troops in a mutual fury of grievance-settling and revenge-taking. In July-August 2000 fighting between government-supplied and antigovernment Nuer forces left a wide swath of territory between Nimne and Nhialdiu burned to the ground and tens of thousands of civilians displaced.
This fighting, with scores of civilian casualties and substantial destruction of civilian property, continued between Cmdrs. Peter Paar Jiek (SPDF, backed by regular Sudanese government forces) and Peter Gatdet (SPLA) until August 2001-more than a year of scorched-earth tactics displacing Nuer civilians by the tens of thousands-with killing, rape, and abduction as well. A February 2001 attack by SPLA Cmdr. Peter Gatdet on the SPDF Nuer area of Nyal, Western Upper Nile/Unity State, a U.N. relief hub, threatened the West Bank Nuer-Dinka peace agreement concluded in March 1999 at Wunlit.
When in August 2001 the two "Peters" reached a standstill agreement, Cmdr. Peter Paar Jiek ceased to serve as a local guard for the Lundin Thar Jath (Ryer) Block 5A oilfield. The two commanders formally reached a peace covenant in February 2002-a few weeks after the SPLM/A and SPDF leaders, Dr. John Garang and Dr. Riek Machar, announced their unity at a press conference with much fanfare in Nairobi.
With Cmdr. Peter Paar Jiek no longer on the Sudanese government's side, the situation of Lundin's project became precarious. The pro-government Paulino Matiep Bul Nuer militia, based in the government garrison town of Mayom, was not native to the Jagei Nuer area where Paar Jiek had drawn many troops-and where the Thar Jath (Ryer) rig was located. In response to the SPLA's increased forays into this area following the Paar/Gatdet standstill, the Sudanese government launched a dry season offensive to protect the Block 5A Lundin Thar Jath (Ryer) project. In the meantime, however, on January 22, 2002, Lundin suspended operations on Block 5A due to insecurity; its helicopter had been shot down in December (reportedly by an angry member of the Paulino Matiep militia).
The Sudanese government's early 2002 attack on Block 5A adjacent to Block 1 (the Nimne/ Nhialdiu corridor), and near its garrison in Ler made use of Nuer pro-government militias and Baggara. The Baggara crossed the Bahr El Ghazal (Nam) River into Block 5A via the Lundin-constructed bridge at Bentiu, and began their "standard" raids, destroying villages, looting cattle, and capturing women and children. The government forces followed up and/or paved the way with Antonov bombing and helicopter gunships, forcing more tens of thousands to move, some for the second or third time. They moved southwest, towards rivers and toic dividing Dinka and Nuer in Bahr El Ghazal. In May 2002, the same displacement process started in Bul Nuer territory between Mayom and Mankien, as efforts to build a second bridge, this one in GNPOC's Block 4 at the military garrison at Wangkei, proceeded.
The U.N. special rapporteur on Sudan reported to the March/April 2002 session of the U.N. Commission on Human Rights that: "the overall human rights situation has not improved" since 2001.[25] He stated his belief that "oil exploitation is closely linked to the conflict which . . . is mainly a war for the control of resources and, thus, power."[26] He further stated that "oil has seriously exacerbated the conflict while deteriorating the overall situation of human rights," and said that he had received information whereby "oil exploitation is continuing to cause widespread displacement . . . ."[27]
By 2002, the government had apparently reached a strategic balance point in this process. It was able to generate enough income from the relatively small GNPOC areas already producing oil to start a domestic arms industry and purchase sixteen new attack helicopters in two years and armaments from abroad that would enable it to target, clear populations, and secure the next oil concession area with road building and garrisons. Thus, the circle was completed, providing a government strategy that could be reproduced successively until all oil areas and transport corridors could be brought under heavy government guard-protecting the oil which in turn funds a larger guard.
Government Revenue from Oil and Expenditures on Arms
Before the oil project went on-line, Sudan's economy was in dire straits. In 1990, the International Monetary Fund (IMF) issued a declaration of noncooperation against Sudan due to the government's unpaid IMF debt and debt service. Sudan agreed to a schedule of payments to the IMF in 1997 and made progress in fiscal reforms that ultimately led the IMF to lift its declaration on August 27, 1999-just days before Sudan exported its first crude oil.[28]
Government oil revenues rose from zero in 1998 to almost 42 percent of total government revenue in 2001.
Oil revenue has made the all-important difference in projected military spending. The president of Sudan announced in 2000 that Sudan was using the oil revenue to build a domestic arms industry. The military spending of 90.2 billion dinars (U.S. $ 349 million) for 2001 was to soak up more than 60 percent of the 2001 oil revenue of 149.7 billion dinars (U.S. $ 580.2 million). Cash military expenditures, which did not include domestic security expenditures, officially rose 45 percent from 1999 to 2001. This was reflected in the increasing government use of helicopter gunships and aerial bombardment in the war.
In U.N. mandatory filings, Russia confirmed that in 2001 it had exported to Sudan twenty-two armored combat vehicles and twelve attack helicopters. In 2002, Russia sold eight amoured combat vehicles and four attack helicopters to Sudan, and Belarus sold Sudan fourteen large-caliber Russian-made artillery systems.
This represents an increase in Sudan's attack helicopter fleet from six in 2000 to twenty-two in 2002-more than tripling the fleet.
Corporate Responsibility
The major oil operators in Sudan are all partners of the government's state-owned oil company, Sudapet.
Human Rights Watch believes that the companies in the two oil consortiums during the 1998-2002 period covered by this report, Talisman (Blocks 1, 2, and 4) and Lundin (Block 5A), and their partners CNPC, Petronas, and OMV, have benefited from the government's continued abuses of human rights. (Chevron was also a beneficiary, but suspended operations as of 1984. Arakis benefitted and was able to put several wells into production before it ran out of money and withdrew in 1998.) Some of these oil companies denied that violations took place, and hosted journalists on tours of the oilfields. In 2001, Talisman paid for a costly project: selective satellite photographs and analysis by an expert reader that "proved" that there had never been any displacement-carefully limiting the scope of the project to several small areas inside its concession. Modern technology was used in lieu of conducting interviews with any people who were actually forcibly displaced or were eyewitnesses to this brutality and its visible aftermath.
From the beginning of its involvement in Sudan, Talisman resolutely refused to speak out against or to seriously investigate the Sudanese government's policy of forcibly displacing civilians from areas designated for oil extraction and the human rights abuses that have been an essential element of this policy.[29] Yet, under modern concepts of corporate responsibility that Talisman claims to endorse, it had a responsibility to ensure that its business operations did not depend upon, or benefit from, gross human rights abuses such as those that have been committed by the government and its proxy forces in Sudan.
From the outset, Talisman had ample warning of human rights abuses in Sudan: even before Talisman became involved, Canadian nongovernmental organizations (NGOs) had been campaigning for the Canadian government to force Talisman's Canadian predecessor investor, Arakis, to pull out of Sudan because of the Sudanese government's record of gross human rights abuses. These Canadian NGOs then wrote to Talisman and publicly called for the company to stay out of Sudan. Senior Talisman officials later had meetings with Riek Machar and other southern leaders. Although Talisman denies it, these southern leaders say that early on they told Talisman about the forcible displacement of civilians from its oilfield areas.
In a letter to Talisman shareholders dated March 10, 1999, Talisman CEO Jim Buckee acknowledged that Canadian NGOs and others had raised troubling questions about human rights abuses by the Sudanese government, but stated:
Because Sudan presents significant challenges, we realized that this project would attract questions from varied sources. However, careful study last summer [1998] persuaded management that this is a sound business investment and our involvement could be carried out in a responsible, ethical manner. Experience to date confirms that judgment.
We recognize that Sudan's chronic troubles, including poverty and conflict running along political and tribal "fault lines", create special challenges. . . . Talisman is taking the necessary steps to ensure the safety of our employees. . . . [30]
In July 1999, Human Rights Watch asked Talisman's Khartoum-based general manager for the GNPOC pipeline division if he had received any information about forced civilian displacement from the GNPOC concession area. He said that he had received some reports but that he had not investigated them because of the frenetic pace of work that Talisman was maintaining in order to meet its pipeline and production deadlines.[31]
U.N. Special Rapporteur for Human Rights in Sudan Dr. Leonardo Franco presented a report to the U.N. General Assembly on October 14, 1999, in which he noted that the May 1999 government assault on Ruweng County (in Block 1) had caused many people to become displaced, adding that the offensive had lasted ten days.[32] Jim Buckee rejected this report as "hearsay"[33] and indicated that he might present contradictory evidence, though he did not do so. In late 1999, after months of pressure from the Canadian government, Talisman finally signed the International Code of Ethics for Canadian Business; this committed the company tothe "value" of "human rights and social justice" and to "support and respect the protection of international human rights" within its "sphere of influence" (undefined), and "not be complicit in human rights abuses."[34]
Talisman justified its presence in Sudan-and argued even that its withdrawal would be "immoral"-on the grounds that it undertook community development programs for the dwindling population, and because of the unsubstantiated claim that "development" would be beneficial and would bring peace.
But, while Talisman provided clean water to several communities, these and other charitable contributions amounted to only a fraction of one percent of Talisman's post-tax revenue.[35] Talisman spent about $ 1 million in fifteen Sudanese community development projects in 2000,[36] the majority of which, in fact, were located in the northern part of Sudan.[37] It spent an additional U.S. $ 469,070 (estimated) on GNPOC community development projects in 2000,[38] or a total of approximately U.S. $ 1,469,070 in social spending in Sudan in 2000. This is equal to 0.12 percent of Talisman's post-tax revenue.
The percentage was almost the same in 2001, when it spent less: U.S. $ 819,541 (of which $ 190,687 was carried over from 2000) in its own projects, and U.S. $ 662,545 (estimated) on GNPOC community development projects, or a total of approximately U.S. $ 1,482,086 in all in 2001.[39] This is equal to 0.12 percent of Talisman's 2001 post-tax revenue.[40] These benefits represent the positive side, but they are insignificant compared to the impact of Talisman's involvement in Sudan's oil extraction on those communities in the south who have been targeted for forcible displacement and other human rights abuses in order to clear them from actual and potential oilfields.
One of the oft-repeated charges was that GNPOC did not hire local southern Sudanese laborers, even for the most menial work. The Chinese CNPC-related subcontractors that predominated admittedly brought in thousands of Chinese and some northern Sudanese laborers to build the pipeline. Thus even the small spin-off that communities ordinarily realize from foreign oil investment, jobs in infrastructure construction, was denied to the southern Sudanese.
Talisman's defense of its presence was challenged both by southern rebel organizations and by the government's civilian opposition. The United Sudanese African Parties (USAP), a southern political party registered under the government's political association system in Khartoum and operating within the Sudanese political system, issued a declaration in 1999calling on the government to suspend immediately all oil operations. It condemned not the government, however, but the oil companies, and singled out Talisman for hiring agents in Europe, North America, and elsewhere to launch "foolish propaganda that claims that people of Southern Sudan are incapable of appreciating the economic advantages which petroleum exploitation" will offer them.[41] It accused Talisman of knowing full well:that the Dinka and Nuer national groups were suffering brutal death, wanton destruction of their homes, and unprecedented displacement of whole families and clans. "Their ancestral land has instead become a theatre of war, fueled with inputs from oil interests in Canada, China, Malaysia and some European countries."[42]
The Christian church leadership in Sudan, in the government and rebel areas, also condemned the presence of foreign oil companies and oil development in the absence of a just peace:
Since it started the exploitation of the oil last year 1999, the government of the Sudan has however not used the revenues from the oil for the development of the people of Sudan and in particular those in the oil areas who throughout history were neglected in terms of equitable allocation of the national resources. Instead, the oil revenues have been used for the purchase of military necessities and weapons used for killing and displacing people in these oil areas. The government has assumed that it can end the conflict militarily.
Further, the government is using the roads and airstrips of the multi-national oil companies engaged in the production of oil in the Sudan, for military purposes, carrying out aerial bombardment on civilian targets . . . .[43]
Like other oil companies engaged in Sudan, Talisman knew or should have known that oil production was taking place in areas where local pastoral populations lacked the basic rights necessary to defend their interests. Talisman also knew or should have known of government displacement and attacks on civilians in its and adjacent concessions prior to its investment in Sudan; it knew or should have known that the government was attacking civilians in Talisman's GNPOC concession in May 1999 and thereafter, and that forced displacement of civilians by government forces was occurring in this and adjacent concessions. Although Talisman would occasionally protest to the government of Sudan (for instance, on the use of the airstrip), it also knew or should have known that government forces were targeting civilian infrastructure, including aerial bombings of hospitals, churches, and schools throughout the south and the Nuba mountains.[44]
Talisman's complicity in the government's abuses was not limited to its inaction in the face of the continued displacement campaign rolling through the oil areas. Its activities in some cases assisted forcible displacement and attacks on civilians. For example, it allowed government forces to use the Talisman/GNPOC airfield and road infrastructure in circumstances in which it knew or should have known that the facilities would be used to conduct further displacement and wage indiscriminate or disproportionate military attacks that struck and/or targeted civilians and civilian objects. Its activities also allowed the government to expand its program of forced displacement into Block 5A, which had been overlooked in the conflict until the pipeline neared completion just seventy-five kilometers from Block 5A's first drilling site.
The military use of the transportation infrastructure built by the oil operators in the concession areas has raised particular issues of corporate responsibility. The long all-weather airstrip at the oil operators' camp at Heglig is confirmed to have been used by the Sudanese military, as have the roads built from north to south and east to west through the concession areas. A large military base at Heglig intended to protect the oilfield operations sits almost on top of the oil operators' enclave and airstrip. A Canadian human rights delegation concluded that government helicopter gunships and Antonov bombers have taken off from the oil company airstrip at Heglig "with their payloads of death and displacement."[45] The Sudanese army also makes military use of the excellent road system installed by the oil companies to move their heavy equipment; armored personnel carriers are able to reach the government's targeted villages by surprise, in much less time than before.
Far from bringing peace, prosperity and security, in Sudan oil development has brought conflict, displacement and widespread abuse. After Talisman came on the scene in 1998, fighting and displacement in Western Upper Nile/Unity State drastically increased. As documented in several human rights reports by international NGOs, non-Sudanese government commissions, and international agencies, Western Upper Nile/Unity State became the focal point of the war, where the Sudanese government has invested large amounts of soldiers and aviation resources in the see-saw battle for control of the oilfields. Talisman admitted, when it sold off its interest in GNPOC, that it was "unsuccessful in . . . attempts to finalize a protocol [with the Sudanese government] that endeavoured to address the provision of security and the appropriate use of oilfield infrastructure."[46]
Human Rights Watch believes that CNPC and Petronas, Talisman's partners, share complicity with Talisman. Indeed, they began investing money and expertise some years before Talisman, and they laid the groundwork for the project that Talisman then completed. They have shown little interest in corporate responsibility, however; they are state-owned corporations based in countries, Malaysia and China, whose governments have shown little interest in human rights accountability. At Talisman's urging, GNPOC signed a code of corporate conduct, but CNPC and Petronas did not individually sign any codes.
Lundin has followed Talisman's lead, and also failed to investigate or acknowledge forcible displacement of tens of thousands of civilians from its concession area in the years after it began active exploration. Lundin scarcely acknowledged that there was a war anywhere in Block 5A-despite the fact that a May 1999 rebel attack at its only exploratory rig caused it to suspend all operations for more than a year. On the day of the attack, it withdrew its one hundred employees and subcontractors from the Thar Jath (Ryer) rig to Bentiu, a twenty-minute helicopter ride north. The government, using proxy Nuer militias followed up by army and Islamist militias, then ousted tens of thousands of civilians from their homes in Block 5A, some more than once, in three sweeps lasting months in 1999. But Lundin in its public statements about its 1999 suspension of activities disclosed only that operations were suspended because of the "rainy season," later referred vaguely to "logistics," and much later made a passing comment on "insecurity" as reasons for withdrawing.
Lundin and its partners, Austrian OMV and Malaysian Petronas, made no public statement condemning this displacement, destruction, or other abuses brought about by oil development. The U.N. special rapporteur and international NGO reports of continuing displacement in Block 5A have proliferated from 2000 to date, however, evidencing the stepped-up expulsion.
Lundin claimed that upon completion of the road to its Thar Jath (Ryer) drilling rig in January 2001, its representatives visited the (militarized) "habited areas along the road" to assess their basic needs, and claimed that people were grateful for the road. A Swedish journalist visiting in April 2001, however, found that "the road is bordered with misery and military."[47] But traditionally Nuer did not live along that new road or any other. While denying the existence of any displacement from Block 5A, Lundin took full advantage of the heavy army presence to develop its concession.
Lundin was forced to suspend its operations in Block 5A again in early 2002, as a "precautionary measure to ensure maximum security for its personnel and operation."[48] Lundin is also invested in Block 5B, with the same partners as Block 5A; Petronas is the managing partner on Block 5B, where it appears that no exploration activity has taken place since Chevron pulled out almost two decades ago.
Lundin announced on March 27, 2003 that because of progress in the peace talks it would "carry out work on the existing infrastructure within Block 5A and the equipment stored in the Rubkona base camp, as a first step towards and eventual recommencement of activities."[49] A month later, however, Lundin announced that it would sell off its interest in Block 5A to Petronas. The sale was complete on June 23; Lundin retained its interest in Block 5B.[50]
Based on the findings of our research, Human Rights Watch concludes that CNPC and Petronas operations in the GNPOC Sudanese oil concession Blocks 1,2, 4 (and the operations of Talisman Energy prior to the sale of its interest), and Lundin, Petronas, and OMV operations in Block 5A have been complicit in human rights violations. Their activities are inextricably intertwined with the government's abuses; the abuses are gross; the corporate presence fuels, facilitates, or benefits from violations; and no remedial measures exist to mitigate those abuses. Human Rights Watch believes that a corporation should not operate in Sudan if its presence there has an unavoidable, negative impact on human rights. Human Rights Watch therefore recommends that all foreign oil companies immediately suspend their operations in Sudan, and agree to resume them only when certain minimum human rights benchmarks are met.
Talisman and the Canadian Government
Although the Canadian government acknowledged the ethical dilemma faced by any Canadian company operating in Sudan, it never provided clear direction or took effective action in the case of Talisman. According to the statements of Canadian officials in early 1999, the optimum time for Talisman to have brought pressure on the Sudanese government to reach a negotiated solution to the civil war, or to bring about human rights improvements, was before the pipeline was completed (June 1999) and oil exports began (late August 1999).[51]
But the Canadian government did not make a Sudan policy statement until October 26, 1999. It then hinted that sanctions on Sudan might be appropriate on human rights grounds and appointed a Canadian government human rights delegation led by consultant John Harker to visit Sudan, mandating it to find whether oil exploration had exacerbated the conflict.[52] The report came back in the affirmative. The delegation found, in February 2000, that
We can only conclude that Sudan is a place of extraordinary suffering and continuing human rights violations, even though some forward progress can be recorded, and the oil operations in which a Canadian company is involved add more suffering.[53]
Despite this finding by its own commission, the Canadian government failed to impose any penalties or restrictions on Talisman. In mid-2000, the Canadian government attempted to put Sudan on the agenda of the U.N. Security Council, of which it was then a member and chair. But its proposal was forestalled by Chinese threats to bring up the U.S. bombing of the pharmaceutical plant in Khartoum in 1998 in any discussion of Sudan, leading the U.S. to ask its Canadian ally not to move forward on this item. Thereafter, the Canadian government took no further concrete action on Sudan or Talisman's involvement there.
The Role of the U.S.
After 1989, when a coup deposed the elected government and imposed a military-Islamist junta on Sudan that committed gross human rights abuses, the U.S. administration was legislatively mandated to vote against such a government in international lending institutions, and it did so. Under President Bill Clinton (1993-2001), the U.S. government gradually adopted a policy of isolating the Sudanese government; Sudan was placed on the State Department's list of countries supporting terrorism in 1993. In 1997, U.S. sanctions were escalated through an executive order barring any U.S. person from doing business with the government of Sudan or its entities.[54] The only exception was for the import of gum arabic from Sudan (an exception under U.S. anti-terrorism legislation made by the State Department for Occidental Petroleum in 1996 was dropped after it came to light).
Under the George W. Bush administration starting in January 2001, two domestic U.S. lobbies flexed their muscles in seeking to influence U.S. policy toward Sudan: one extremely powerful-the oil industry-and one just beginning to test its foreign policy strength, on Sudan-a conservative religious grouping concerned about treatment of Christians. This conservative religious lobby scored a victory over the oil and business community when the Sudan Peace Act passed the U.S. House of Representatives by 422-2 on June 13, 2001. This act contained an amendment imposing capital market sanctions on foreign companies doing oil business in Sudan, prohibiting them from any access to U.S. capital markets. This would have required that Talisman Energy be de-listed from the New York Stock Exchange.
The oil and financial industries prevailed, however. The Senate subsequently passed a version of the bill lacking these capital market sanctions. In October 2002, in light of Bush administration hostility to any capital market sanctions, the House passed another version of the Sudan Peace Act, one which omitted such controversial sanctions. This passed the Senate also and was signed by the president.
A year earlier, on September 6, 2001, President Bush named former U.S. senator John Danforth as his special envoy for peace in Sudan. Days later, on September 11, 2001, Islamic militants belonging to al-Qaeda attacked New York and Washington, D.C. With terrorism becoming the main focus of U.S. foreign policy following these attacks, the Sudanese government-which had hosted al-Qaeda leader Osama bin Laden from 1990 to 1996-moved quickly to attempt to improve bilateral relations, publicly offering to cooperate with the U.S. in its efforts to combat terrorism.
With assistance from the State Department and U.S. AID, peace envoy former senator Danforth devised a four-point plan to test the willingness of the Sudanese government and the SPLM/A to come to a peace agreement. These four points, although not conceived as such, were essentially human rights points, and the two parties agreed to all of them and began to comply with some of them, thus convincing the U.S. administration that they were sufficiently committed to peace that the U.S. should stay deeply involved in the international diplomatic push for peace.
Perhaps the single most important human rights agreement of the four Danforth points, signed by both government and rebel forces in March 2002, was the agreement not to target civilians or civilian objects, with the provision that a team of international monitors could operate freely in Sudan to verify compliance with that agreement. The monitoring of this agreement, to be undertaken by the U.S. State Department, did not begin until late 2002.
Postscript: Peace Talks Update 2003
The U.S. peace agenda, in which several U.S. agencies played roles supporting Danforth's efforts, proceeded with noticeable momentum. The peace talks, pending under the auspices of the regional Intergovernmental Authority on Development (IGAD) since 1994, when the government and the SPLM/A signed a Declaration of Principles,[55] were taken up again in June 2002, with the renewed engagement of several international partners, particularly the U.S., the U.K., and Norway (the "Troika").
On July 20, 2002, in Machakos, Kenya, the Sudanese government and the SPLM/A signed a protocol agreeing to settle two of the most contentious issues in the Sudanese conflict: self-determination for the south and the role of religion in the state. This Machakos protocol was reached as a first step in the peace process. In it, the government agreed to a referendum for southern self-determination after a six-year interim period following the signing of a final peace agreement. The government also agreed that-for the six-year interim period-shari'a or Islamic law would not be applied in the south, which could have its own legislation. As of the writing of this report, the difficult issues of resource and power sharing are still being negotiated, as are security and the fate of three African-populated marginalized areas in the transitional area just north of the north-south border (and in which the SPLA has also been waging war): Abyei, the Nuba Mountains, and Southern Blue Nile.
When the July 20 Machakos agreement was reached, many Sudanese groups who were not included in the peace talks protested that this agreement would never last because it was an agreement between minorities (the Islamist government and the SPLM/A) and would-notwithstanding written agreements for democracy, good governance, and human rights during the six-year interim period-consolidate two dictatorships. The dictators would be Sudanese President Omar El Bashir and SPLA Cmdr.-in-Chief Garang, neither of whom had been elected in free elections, both of whose forces were guilty of gross human rights abuses.
On October 4, 2002, after the Sudanese government returned to the peace talks-following an evident power struggle within the Islamist ruling party and the capture of Torit by the SPLM/A and its recapture by the Sudanese government-the parties agreed to a cessation of hostilities. An October 15, 2002 memorandum of understanding provided for "a period of tranquility during the negotiations by ceasing hostilities in all areas of the Sudan and ensuring a military stand down for their own forces, including allied forces and affiliated militia." There was no provision for this ceasefire to be monitored. Following on this agreement, on October 26, the government and SPLM/A agreed with the U.N.-coordinated umbrella relief agency Operation Lifeline Sudan (OLS) that humanitarian access would not be impeded by either.[56]
The peace talks in August 2003 were to discuss the outstanding issues. The parties were to decide, among other things, on deployment of troops and police during the interim period; the SPLM/A wanted two armies (the SPLA and that of the Sudanese government) and the government wanted a united army.
The future role of the pro-government southern militias, mostly Nuer, is crucial for a lasting peace, as this report illustrates. As of the writing of this report, the parties to the peace talks do not seem to have reached this vital topic. The government-backed southern militias, now organized under the umbrella of the SSDF, are not party to the talks, and their political counterparts, some of which are technically in the government, have not been allowed to play any role at the IGAD talks. An SSDF delegation was permitted to attend security talks in April 2003 and tabled a proposal for three armies during the interim period (the third being the SSDF). This proposal was not discussed nor addressed by the parties to the talks.
The mostly Nuer militias remain a stumbling block for the SPLM/A, which lays claim to govern the entire south. These militias (or armed groups, as they ask to be called) are also a challenge to the government, which does not trust them because they are southerners and continue to insist on the right of self-determination as outlined in the Khartoum Peace Agreement of 1997. Although the SPLA seems to have a position, from time to time, within Block 5A sufficient to block its development, the government militias are situated in different parts of Blocks 1, 2, 4, 5A, and 5 in Western Upper Nile/Unity State, and in Blocks 3 and 7 in the Melut Basin in Eastern Upper Nile also. These areas have changed hands often, even after the October 2002 ceasefire, demonstrating the parties' and the militias'/armed groups' continued high interest in controlling the valuable oil resource.
If peace is reached, it should mean that there will be no more fighting or displacement of civilians from the oilfields or elsewhere, and that the displaced may return to their homes. Whether they will return with compensation for the losses suffered and international monitoring of the parties' respect for human rights is not yet known. The serious human rights abuses detailed in this report have never been accounted for by any of the parties to the conflict.
Nor is it clear that the fighting and the abuses will end with a peace agreement. If peace means that the SPLM/A is the sole government of the southern region and it refuses to compromise or reconcile with the other southern military and political forces, it is likely that Sudanese government hard-liners will continue to use the SSDF militia/armed groups to foment war in the south-in order to frustrate the goal of a self-determination referendum. In these circumstances, displacement and death in the oil war will continue to be the fate of southern Sudanese, even if a peace agreement is signed by the Sudanese government and the SPLM/A.
PART I: OIL IN SOUTHERN SUDAN:
EARLY DEVELOPMENTS
BACKGROUND
Blocks 1, 2, 4, and 5A and 5B: Oil Geography
The main area of oil exploration and production in Sudan to date, the Muglad Basin, stretches southeast down across the midsection of the country into the south. The Muglad Basin extends from El Muglad in Western Kordofan through Bentiu and Western Upper Nile, known by the government as Unity (al Wihda) State,[57] to just north of Juba on the White Nile River.[58] Oil exploitation in southern Sudan began north of Bentiu, in Western Upper Nile/Unity State-in Blocks 1 and 2, the sites of Unity and Heglig oilfields. (See Maps B and C) This report first outlines the 1978-98 phases related to the oil companies, Chevron Oil Co. and Arakis Energy Inc., that successively owned the exploration rights to Blocks 1, 2, and 4, the three blocks which are the Greater Nile Petroleum Operating Company (GNPOC) concession. It highlights the waves of Baggara militia and government soldiers who displaced the pastoral Dinka and Nuer living there over several years, looting their cattle and leaving them without land and without resources, forcing them to escape southward from the 50,500 square kilometer concession.
The oil history and development of Block 5A, operated by Lundin Oil AB (until 2003) and then Petronas Carigali Overseas Sdn Bhd, have been determined by the developments in the GNPOC area, as it is a continuation of the Muglad Basin to the south east of the GNPOC blocks. The physical and human topography of Blocks 5A and 5B-and their military and political history-are different from the GNPOC blocks, however. Blocks 5A and 5B straddle the White Nile and Zeraf island, are swampy, more densely populated, and were in rebel hands from 1984 to 1999, after which significant parts were captured by government forces, who forcibly and without compensation displaced the population so that international oil companies could be brought in to develop the oil.
Blocks 5A and 5B and the rest of the vast Sudanese oil areas to the south and east are part of the flood plain, a basin in southern Sudan into which the rivers of Congo, Uganda, Kenya, and Ethiopia drain off from an ironstone plateau that belts the regions of Bahr El Ghazal and Upper Nile in southern Sudan:
[T]he flood region covers most of what is now administratively called Upper Nile and Bahr el-Ghazal. Here the land is flat, heavy clay soil, of high fertility, and with only a few outcroppings of slightly higher, sandier soil. . . . [T]his area is subjected to severe seasonal river and rain flooding which limits its use for cultivation. . . The variety of grasslands . . . provide modern pastoralists with different types of grazing throughout the dry season, but this requires constant movement to take advantage of [it] . . . . Those areas which have consistently been able to support the largest populations have been those which combine large stretches of permanently habitable land with access to flood-fed seasonal grazing.[59]
Blocks 5A and 5B are discussed in the next part of this report, which also continues the story of development and displacement in the GNPOC blocks.
Despite geographical differences among the GNPOC blocks and Blocks 5A and 5B concessions, a common characteristic is the radical difference between dry season and wet season. In the dry season, the area of "permanent habitation" is hot and parched and most of the population moves the cattle to be nearer to water sources such as a river or seasonally flooded toic.[60] In the wet season, as the lower lands flood, the population returns with the cattle to higher grounds-sometimes no more than a meter higher.
Whether people are driven from their dry season or wet season homes, however, they are displaced, as the two areas are economically linked and equally necessary for agro-pastoralists' survival in the harsh environment.
Southern Sudan has been described as "a large basin gently sloping northward," through which flow the rivers Bahr el Jebel River (White Nile),[61] the Bahr el Ghazal (Nam) River and its tributaries, and the Sobat, all merging into a vast barrier swamp.[62] (Map A) Southern Sudan may be divided into five subzones, the floodplain being the one which suppports Dinka, Nuer, Shilluk, and others in much of the Muglad and Melut oil basins. The floodplain is divided into four land classes:
The highlands, higher than the surrounding plains by only a few centimeters, are the sites for "permanent settlements." Vegetation consists of open thorn woodland and/or open mixed woodland with grasses.
The intermediate lands lie slightly below the highlands, and there the "creeping flow" of river water from heavy rainfall in the Ethiopian and East and Central African highlands is common. Vegetation is mostly open perennial grassland with some acacia woodland and other sparsely distributed trees, such as balanites aegyptiaca, or heglig.[63]
Thetoic is land seasonally inundated or saturated by the main rivers and inland water-courses, retaining enough moisture throughout the dry season to support cattle grazing.
The sudd is permanent swampland below the level of the toic, and covers a substantial part of the floodplain. It provides good fishing but is not available for livestock.[64] Historically it has been a physical barrier to outsiders' penetration.[65]
The ecology of the large basin and the societies of its peoples are almost unique in the world. Until recently, wild animals and birds flourished, hunted rarely by the agro-pastoralists. The names of rivers and towns in various Nilotic languages[66] suggest this variety, for instance, Ghazal (gazelle), Jeraf (giraffe), and Mankien (mother egret).
Southern pastoralists in the floodplain live in different areas during a single year, and, depending on the season, family members will live apart according to their economic roles. One report accuses some past "experts" on southern Sudan of mistakenly basing their opinions and perceptions on observations of the Nuer or Dinka during only one season, the dry season. These experts usually left during the rainy season to avoid being stranded for months at a time,[67] although that is the time when most of the population moves back into their permanent habitations, above the flood level. When determining whether people "live" in a given area, therefore, it is important to note the season of the year under observation. An area considered "empty" in the dry season would not be empty in the wet season.
Human Population
Two key human rights questions have been raised about developments in Blocks 1, 2, and 4 (GNPOC) and in Blocks 5A and 5B: did people ever live there? And if so, were they forcibly displaced by the government to make way for oil development? The answer to both questions is yes.
Maps and Tax Records of Nuer and Dinka Presence
Throughout the Anglo-Egyptian Condominium rule of Sudan (1898-1955), colonial administrators recorded ample evidence that Africans lived in the areas under consideration for an unknown number of centuries prior to 1898. During the condominium period, the government of Sudan Survey Department prepared a 1946 tribal map of Sudan (corrected in 1969),[68] which showed that what later became Blocks 1 and 2 were inhabited by the Bul and Leek ethnic groups of the Nuer people.[69] Block 1 was also inhabited by three subgroups or sections of the Ruweng (Panaru) Dinka ethnic group: the Alor Dinka to the west; the Awet Dinka in the northern cap; and the Kwil Dinka in the east.[70] (Map D) Maps compiled in 1928 and 1937 provide even earlier evidence of Dinka living in this Ruweng (Panaru) Dinka area of Blocks 1 and 2.[71]The Dinka word dugdug, or cattle camp, appears on maps of this period throughout the Ruweng (Panaru) Dinka areas in Western Upper Nile, the large area the Baggara called the Bahr (meaning river in Arabic).[72]
The first population census of the newly independent Sudanese government, carried out in 1955/56, counted the numbers of people living in different court centers (or omdiyas), giving figures ranging from 7,000 to 33,000 heads of household in each of nine ethnic groups in Western Upper Nile.[73] Although the figures from the 1955/56 census are suspect, as all census figures for the south have been, they give a rough idea of the proportional sizes of groups. Dinka and Nuer heads of households in Western Upper Nile totaled 137,391 at that time.[74] Overall, the population of the Upper Nile as a whole in 1956 was given elsewhere as 888,611.[75]
It appears the Nuer and Dinka were classified by later Sudanese government census-takers as "rural" and the Baggara as "nomads." The 1983 census showed a population in Upper Nile of 1,594,554, of which 89.9 percent was rural, 5.7 percent was urban, and 4.4 percent was nomadic.[76]
From 1946-54, the Jonglei Investigation Team (JIT) carried out a survey of the possible effects of a massive canal-the Jonglei canal-on the ecology and peoples of southern Sudan.[77] The research was conducted over a period of years beginning in 1946 and was based on administrative reports kept on the region by administrators who lived and traveled there.[78]
The JIT survey confirmed that the Ruweng (Panaru) Dinka and the Leek and Bul Nuer lived in areas of Western Upper Nile in what later became known as Blocks 1, 2, and part of 4;[79] large parts of these areas were referred to on the JIT maps as "permanent settlements,"[80] located on higher and better drained land.[81]
A 1954 JIT map illustrates the "permanent habitation" land south of Bentiu in what is now Block 5A.[82] (Map D) The most prominent geographical feature is the Nile River tributary, the Bahr Al Jebel River (White Nile), flowing from south to north where it meets the Bahr El Ghazal River and flows eastward. Coincidentally, Blocks 5A and 5B would be deprived of water by the Jonglei canal. Work on the Jonglei canal was brought to a halt in 1984 by an SPLA attack, however, and the project has not resumed as of the writing of this report.
The Bahr El Ghazal (Nam) River originates south of Wangkei, flows north to join the Jur River coming from the west, then continues north to where it meets the Bahr al Arab at Wangkei, almost one hundred kilometers west of Bentiu.[83] It then continues east through Bentiu, joins the Bahr El Jebel then the Bahr El Zeraf (both flowing south north to meet it), until it meets the Sobat River (coming from Ethiopia) in Malakal to form the Nile. It continues north as the White Nile to Khartoum, where it joins the Blue Nile (also coming from Ethiopia), to become the Nile River until it reaches Cairo and pours out into the Mediterranean Sea.
Historically, the Bahr El Ghazal (Nam) River provided a barrier to Baggara horseback penetration to Nuer settlements south of this river. Block 5A-except its northern corner-is south of this Bahr El Ghazal (Nam) River and therefore did not experience many raids by the Baggara. Instead, Block 5A provided a refuge for the terrorized Leek and Jikany Nuer population fleeing south from Blocks 1, 2, and 4 in the 1980s and 1990s. Such displacement swelled the numbers of people and cattle south of the river.
The historical barrier was breached, however, when the Lundin consortium bridged the river at Bentiu in 2000 and the government later put in a bridge at Wangkei in Block 4. In 2002 the Baggara used them to penetrate south of the river for the first time, hunting Nuer civilians in government-organized destroy and displace raids.
The human and cattle population south of the Bahr El Ghazal (Nam) River was, even before oil exploration and accompanying displacement started, denser than in the Heglig area of Western Upper Nile. Block 5A includes the small towns of Nimne, Nhialdiu, Duar, Boaw, Koch, Ler, Adok, and the market town of Rupnyagai that grew up after a peace agreement was reached between the Nuer/SPLM/A and the Baggara in 1986 and trade between them recommenced.[84] Block 5A is populated by Bul, Leek, Jagei,[85] (western) Jikany,[86] and Dok[87] Nuer. The Lak and Thiang Nuer also reside in Block 5A, on Zeraf island-formed by the triangle of the Bahr El Ghazal (Nam) River, the Bahr El Jebel River (White Nile), and the Bahr el Zeraf River-but so far they have not been as greatly affected by the fighting. Lak and Thiang Nuer live in Zeraf Island (in Central Upper Nile), which has been back and forth between the SPLM/A and progovernment militia leader Cmdr. Gabriel Tanginya, based in Pom to the east of Old Fangak (one day walking). The southern part of Zeraf Island, mostly of Thiang Nuer, is included in Block 5A.
The Nyuong and Dor Nuer lived predominantly in Block 5B, where the towns of Nyal and Ganyliel are located. On the East Bank of the Nile in Block 5B are the Gaweir and Gol Nuer. (Map C and D)
The Living Patterns of Dinka and Nuer
The subsistence economy and rich social life of the Nuer and Dinka have been determined in great measure by geography. Their agro-pastoral lifestyle has been adapted to the periodic flooding and dryness of the land they live in. Their way of life has been guarded from outside invaders-the first being slavers-by malaria, heat, wild animals, flooding, and papyrus-clogged rivers or sudd. .
The spread-out villages or "permanent settlements" of the rural Nuer and Dinka do not refer to brick and mortar buildings, but to settled locations with more permanent type of mud and thatch housing above flood-level, to which the Dinka and Nuer return annually during the rainy season and where they plant their crops. These settlements include several extended family and/or other compounds. The compounds contain tukls, circular mud one-room huts with thatched roofs that last about five to ten years. The compound fence, of thatching or more permanent material, may encircle several tukls, depending on family size. Other permanent structures such as cattle byres (luaak, plural of luak) and graneries are also made of mud and branches, in contrast to the impermanent "dry season" houses built of flimsy materials, closer to the rivers, which are flooded out during the rainy season.[88]
Many anthropologists and others have studied Africa's migratory agro-pastoralists, particularly the Dinka and Nuer. The care of cattle and the availability of water for their cattle is the main reason for their migration. Cattle to the Nuer and Dinka are not simply sources of food and other products. Cattle are the main form in which wealth is kept, and are signs of prestige. They are used to pay bridewealth, which is a group responsibility of the family of the bridegroom, and therefore helps maintain interrelations among lineage members. Cattle are also used to provide compensation for homicide and other crimes; jails or prisons were introduced by outsiders and rebel movements. Cattle play an important role in the traditional religions. Even now, there is still resistance in most Dinka and Nuer areas to using cattle for draft or transport because the cattle might be harmed by such exertion.[89]
Movement from the permanent settlements to dry season grazing in the toic starts in December-January at the beginning of the dry season. The return journey to the permanent settlements usually starts in May-June, the early part of the rainy season.
These major migrations are planned not by individual families but by larger lineage groups. Some family members (particularly young men) accompany the cattle to the toic, and female family members go with them to milk cattle; these roles are traditionally assigned by sex. Other family members stay behind to cultivate.
Cultivation of sorghum and other crops begins in the highlands or permanent settlement areas in the early rainy season and the harvest of crops begins when the rains are heavy in June-August. Rains drop off in September-November and cattle are driven to the toic again. This is the most socially active place and time, a period of fun, especially for the youth. The rains usually stop by early December, while harvest of crops is completed and the cattle graze on the stalks.[90]
Relations between Baggara, and Nuer and Dinka
Before the discovery of oil in 1978, Blocks 1, 2, and parts of 4 were economically useful for their pasturelands during the dry season; they were partially flooded during the other six or eight months of the year. During the colonial period, the British allowed the Baggara[91] to graze during the dry season in Nuer and Dinka pastures and water in their rivers, but controlled this seasonal migration by issuing permits, in order to minimize friction over resources between the Baggara and the Nuer and Dinka.
The Nuer and Dinka who lived in the region have never moved their herds to Baggara lands for watering or any other purpose, except sometimes for sale. Their migrations stayed within the south, where the valuable dry season pastures and water-and their permanently habitable land-lay. The historian of the Baggara in the 1950s noted that "much of [the southern area of Baggara migration] has permanent Dinka settlements, although during most of the time that the Humr [Baggara] occupy it the Dinka are with their cattle south of the Bahr el Arab [River]."[92] The two groups had complementary migration patterns that avoided both using the same watering and grazing area at the same time, although this broke down occasionally.
Cattle raids were a part of life among the Baggara, Nuer, and Dinka; the Dinka lived on both sides of the north-south border in Sudan (which border was generally kept as the British left it at independence, with one exception).[93] The Leek and Bul sections of the Nuer, and the Ruweng (Panaru) Dinka (as well as the Ngok Dinka of Abyei, Kordofan; Twic Dinka of northern Bahr El Ghazal; and other Dinka), lived close enough to the Baggara of Kordofan (Humr and Misseriya) to be affected by their cattle raids. They fought back and conducted counterraids.[94]Usually a tribal conference resolved the conflict, sometimes at central government insistence.[95] But the feuding did not dominate relations. Negotiated access for Baggara cattle to Dinka and Nuer watering spots was more common than raids before the war.
Independence, Civil War, and the Addis Ababa Agreement
In 1956 independence came to Sudan, a country where many differences existed among its peoples: race, ethnicity, language, religion, dress, facial scarification, cuisine, and so on. It was a multicultural society where no one people had the majority. The Dinka, the largest people in Sudan, were estimated to comprise 12 percent of the Sudanese population at the time of the only ethnic census in 1955/1956.[96] At that time, 39 percent of the Sudanese spoke Arabic as their native language and identified themselves as "Arabs." Approximately 60 percent of the population was African (non-Arab).[97]
It is estimated that between 60 and 70 percent of the population of Sudan is Muslim. Ninety percent of Muslims live in the northern two-thirds of the country. They are, among themselves, quite diverse and preserve many customs, languages, facial scarification styles, and dress unique to their ethnic groups.
Southerners--which name refers to those who predominate in the southern third of the country--call themselves "Africans,"[98] speak their own languages,[99] worship their own gods or-a minority-practice Christianity.[100] Few southerners are Muslims.
Not all persons describing themselves as Africans (non-Arabs) are southerners, and many Africans living in the center, east, and west of Sudan are Muslims; approximately a fifth of Sudan's population is both African and Muslim. These Africans are Muslims who have not adopted Arab culture and their home language is not Arabic. One example is the Nuba, who live in central Sudan; many Nuba, including Muslims, consider themselves Africans (not Arabs); perhaps one-half of the people of the Nuba Mountains area is Muslim and the other half Christian.[101] The adoption of Islam without Arabization is typical of sub-Saharan Muslim Africans outside of Sudan; Sudan's coupling of Islam with Arabic language, customs, and culture in most of northern Sudan is unusual in Africa. The attempts of central governments and others to spread the Arab/Muslim culture to African areas has long been a source of political and social friction in Sudan. Attempts of Arab/Muslim Sudanese to politically and economically dominate non-Arabs and non-Muslims have also been resisted.
Those dominating the central government in Sudan since independence-whether military dictatorship, elected, democratic, socialist, free market, sectarian, secular, or Islamist-have always come from northern Nile-based (riverine) ethnic groups claiming Arab origin, whose religion was Islam. All Sudanese central governments have considered the oil in the south to be national, i.e., central government, property, and the same for the Nile waters that wend their way north through the sudd. Historical experience, including nineteenth-century enslavement of southerns by northern entrepreneurs,[102] made southerners suspicious of northern government promises to deal fairly with them regarding treaties, oil, or any other matter.[103]
At the time of the last national census, in 1983, the southern provinces were the poorest in the country. Per capita income in the south (population then about five million) was about half that of the national average and perhaps only one-quarter that of the more prosperous province of Khartoum.[104] Life expectancy in Upper Nile province in the 1973 census was 35.69 years, compared to the already low national average of 44.85.[105]
Against this background, it was unsurprising that an independent Sudan, once freed from its colonial masters, soon showed the strains of maintaining unity. The country consisted of nine large provinces. As early as 1955, less than a year before independence, a mutiny among southern soldiers broke out when the central government tried to transfer them from the southern garrison in Wau, Bahr El Ghazal, to the north. Only two years after independence, the 1958 military takeover by Maj. Gen. Ibrahim Abboud and his subsequent policy of Islamization fueled a southern separatist war, sporadic at first. During the early 1960s, separatist southern guerrillas known as Anyanya[106] made the initial focus of the war Equatoria, one of three southern provinces, but by the mid-1960s it had spread to the other two southern provinces: Upper Nile (the largest) and Bahr El Ghazal. In 1969, President Jafa'ar Nimeiri took power in Khartoum following a military coup. He prosecuted the war but soon entered into peace negotiations with the rebels.
In 1972 an agreement was signed in Addis Ababa, Ethiopia, mediated by Ethiopia's ruler Emperor Haile Selassie, which ended the first civil war and gave regional autonomy to the three southern provinces, uniting them into one political body, the Southern Region.[107]
The government subsequently incorporated some Anyanya rebels into its army: the Addis Ababa agreement stated that citizens of the Southern Region "shall constitute a sizeable proportion" of the Sudan armed forces "in such reasonable numbers as will correspond to the population of the region."[108] In all, the government brought 10,703 Anyanya into the uniformed forces,[109] leaving 7,290 still unemployed.[110]
THE CHEVRON PERIOD: 1974-92
Overview
Chevron's presence spanned major developments in Sudan's modern postcolonial history. Chevron was granted its oil concession in 1974, shortly after the agreement on southern autonomy ended the separatist war in the south. Chevron discovered oil in this autonomous region in 1978, and by the time a second civil war broke out in the south in 1983 was developing Unity and Heglig oilfields. Located in today's GNPOC Blocks 1 and 2 in Western Upper Nile/Unity State, these oilfields were home to the Nuer and Dinka, members of the two largest ethnic groups in southern Sudan.
In February 1984, a southern separatist rebel force, Anyanya II, attacked a Chevron facility in Block 1 and killed three expatriate workers. This led Chevron to suspend operations in the south.
A new Sudanese rebel army, the SPLM/A, was formed in 1983 in Ethiopia. The SPLM/A brought together, temporarily, the separatist remnants of the first civil war (based in Ethiopia) and many former Anyanya troops integrated into the Sudanese army battalions.[111]
The SPLM/A, following the lead of its Ethiopian and Soviet backers, endorsed a united, secular, socialist Sudan. In the words of its leader, Sudanese army colonel John Garang de Mabior, at the founding of the SPLM/A,
[T]he anarchy in production, the separatist tendencies in the various regions of our beloved country, the moral decay and all the ills that I have enumerated can only be solved within the context of a united Sudan under a socialist system that affords democratic and human rights to all nationalities and guarantees freedom to all religions, beliefs, and outlooks.[112] (italics in original)
The SPLA's first battles were within the rebel movement. The separatist faction, Anyanya II, was defeated in 1984, driven back from Ethiopia into Sudan, and started accepting arms from the government, setting a pattern for the war that has still not been broken.
To prevent further rebel threats to oil development, state and Umma party authorities started arming Baggara cattle-owning nomads, the western and northern Kordofan and Darfur neighbors of the Nuer and Dinka, with automatic weapons. These authorities were non-nomadic Baggara in many cases. The Baggara served as a proxy, a cheap and deniable counterinsurgency tool for the government. They serve the same purpose today. The Baggara were able to loot southern cattle with impunity and push the Nuer and Dinka off their land. Most Nuer and Dinka were still armed only with spears.
The removal by 1985 popular uprising of President Nimeiri's dictatorship did not affect the war, and the elected parliamentary government that followed (1986-89) did not give priority to a peace settlement, although many negotiations were held and many preliminary agreements were entered into among various parties. In 1988, the SPLM/A and the Anyanya II, except for Bul Nuer Cmdr. Paulino Matiep of Western Upper Nile, joined forces. In 1989, an Islamist-military coup d'état led to the end of peace negotiations, just as it appeared that they might bear fruit. Unlike other military coups, this one did not hand over power to civilians after a short period. Fourteen years later, most of the same persons are still in power, through brutal repression and denial of political rights.
Another major political/military shift occurred in May 1991: the SPLM/A's main backer, Ethiopian dictator Mengistu Haile Miriam, was overthrown. At least one hundred thousand southern Sudanese refugees fled Ethiopia, with the SPLM/A, and returned to Sudan. A few months later, in August 1991, Riek Machar Teny Dhurgon, SPLA zonal commander of Western Upper Nile, and others led an attempted coup against the SPLM/A leader John Garang. When it failed, he formed his own rebel secessionist group, claiming Western Upper Nile and the rest of the Nuer areas, basically most of the oilfields of southern Sudan. Although Riek Machar's group had a separatist agenda, it secretly allied with the Sudanese government, which supplied it with arms and other material. It fought and defended itself against the SPLA, not the government. A major south-south war was added to the conflict.
Chevron sold out in 1992 as the Sudanese government began to look for a way out of its serious economic decline: in 1990 the government, defaulting in debt service payments on the staggering debt incurred by President Nimeiri, was suspended by the IMF, a blow to its ability to borrow money. [113] The Islamist-military government, desperate for oil revenues, had none because the oilfields were mostly in rebel-controlled areas.
Chevron Oil Concessions[114]
In 1974, two years after the 1972 Addis Ababa peace accord that ended the first civil war, President Ja'afar Nimeiri's government granted the Chevron Oil Company (American in origin) large oil concessions in Sudan.[115] The company explored for oil unsuccessfully where the government directed, in areas outside southern Sudan. One source reports that oil exploration in southern Sudan initially came about through the intervention of then U.S. Ambassador to the U.N. (later U.S. President) George H. Bush, who alerted the government of Sudan to satellite imaging maps that indicated the presence of oil in the south. George H. Bush also played a role in getting U.S. companies involved in Sudan.[116]
According to Abel Alier, a prominent figure in the southern regional administration, southerners had to struggle for oil exploration in the south: "we . . . succeeded against all odds in 1974 to get the first oil company (Chevron) to the South for exploration."[117]
Chevron discovered the two major oil basins, Muglad and Melut, and then in 1978 the oilfield in the Muglad Basin near Bentiu, which the Nimeiri government named al Wihda or "Unity." It was located in Block 1, inside Upper Nile province, part of the Southern Region. Soon after, Chevron discovered the Heglig field to the northwest.[118] The central government and the Southern Kordofan authorities used the Arabic name Igligi for this oilfield and area in Block 2, using an Arabic name to denote Arab control.[119]
The Shell (Sudan) Development Company Limited[120] subsequently took a 25 percent interest in Chevron's large project. Together, the companies spent about U.S. $ 1 billion in extensive seismic testing and the drilling of fifty-two wells.[121]
Southern Fears about Oil Development
The Addis Ababa agreement of 1972 that ended the first civil war provided qualified rights for the autonomous southern regional government to receive revenues accruing from mineral and other natural resources in the south; at the time of the agreement in 1972, no one was aware of oil deposits in the south.[122] After the discovery of oil in 1978, southerners feared that the government, always dominated by the northern elite, would deny the south jobs, a refinery in the south, a pipeline through the south, and any share of the revenues from oil. In 1978, southern urban residents took to the streets to condemn the government's decision to export Bentiu crude oil through Port Sudan; the protestors wanted export through the south to the Kenyan port of Mombasa.[123]
Following the discovery of uranium at Hofrat en-Nahas in Bahr El Ghazal in 1961, the government had redrawn the western Bahr El Ghazal/Darfur border to give these mineral deposits to the northern state of Darfur. Although the Addis Ababa agreement (1972) provided that this territory should be returned to Bahr El Ghazal, it never was. Many pointed to this annexation of mineral resources to the north by the central government as a precedent for what would happen in the oilfields.[124]
Several government actions deepened that fear. In 1980 President Nimeiri, the same president who had signed the autonomy agreement in 1972, made an effort through the national assembly to redraw the Upper Nile border to include the Heglig and Unity oilfields in the province of Kordofan (i.e., outside the south). He dropped the plan due to vehement opposition from southerners, both in the national assembly and in street demonstrations.[125]
Chevron and the government proposed a package of development projects following the protests over the redrawing of the Upper Nile border and the location of the refinery. There were five items: the government and Chevron would upgrade the Kosti-Renk-Malakal road to an all-weather road; Chevron would support improvement of health, drinking water, and educational services in Bentiu Area Council; a development authority for that Council would be created with a starting fund of one million Sudanese pounds; a topping plant would be established to produce refined products for areas near the oilfields; and Chevron would provide special barges to transport refined products from the Kosti refinery to Juba and intermediate towns. Neither the government nor Chevron lived up to these agreements.[126]
Resumption of Civil War
In May 1983, contrary to the Addis Ababa agreement that had ended the southern separatist war by setting up an autonomous Southern Region, President Nimeiri split the Southern Region into three and revoked its autonomous powers.[127] His dissolution of the southern government, passage of shari'a laws in September 1983, and the short-shifting of the south in his handling of economic resources particularly the oil, were prominent among reasons for renewed civil war.[128] Already in 1982, some Nuer and Dinka soldiers in Wangkei base had rebelled and taken their guns to Ethiopia to join the nascent separatist rebel movement called Anyanya II.[129]
In May 1983, the Sudanese army's 105th Battalion, consisting mostly of ex-Anyanya southern forces and located at Bor, Upper Nile province, mutinied. They were discontented because of threats to transfer them to the north, away from their home area, and because of a salary dispute with headquarters.[130] Due to political differences and miscalculations, this escalated into an attack by Sudanese army loyalists on the 105th Battalion headquarters in Bor. The rebellious105th Battalion, under the command of Sudanese army officer Maj. Kerubino Kwanyin Bol, fled to Ethiopia, where it was shortly joined by Sudanese army Col. John Garang de Mabior.[131] Later the 104th Battalion at Ayod, Upper Nile, commanded by former Anyanya officer William Nyuong Bapiny, and others in the 105th Batallion garrisons in Pibor and Pachalla, left for Ethiopia to join the struggle.[132]
Formation of SPLM/A in Ethiopia, 1983
At the time, Bor was only one of a series of mutinies of former Anyanya from the government army.[133] But the Bor mutiny led to the founding of the SPLM/A by Col. John Garang, Maj. Kerubino Kwanyin Bol, Lt. Col. Samuel Gai (Nath) Tut, and others.[134] From its inception, the SPLM/A was, in effect, an army, defecting in battalions, southern in origin. Over the years prior to 1983, small numbers of Nuer and Dinka soldiers, police, and civil servants had gradually joined the Anyanya II nucleus in Ethiopia,[135] and were initially incorporated into the new movement.
The SPLM/A was sponsored, housed, supplied, and trained by the repressive government of Pres. Mengistu Haile Miriam of Ethiopia. Ethiopia was reciprocating Sudan's own efforts. Ethiopia had warned Sudan as early as 1976 that if Sudan did not stop supporting Ethiopian and Eritrean dissidents, Ethiopia would support Sudanese dissidents.[136] With the Cold War at its height, Ethiopia was aligned with the Soviet Union and Cuba, while Sudan was aligned with the United States. President Nimeiri's dictatorship received considerable aid from the U.S. The SPLM/A received arms, training, and other assistance from the Soviet bloc and sent thousands of southern and Nuba boy soldiers and adult officers to Cuba for military and academic education.[137]
Colonel Garang's call for a united, secular, socialist Sudan was a non-secessionist goal consistent with that of the Ethiopian ruling council, the Derg. Anyanya II, like its predecessor, called for southern independence.
In Ethiopia, political, leadership, and personality problems cropped up within the rebel movement between the two factions in the SPLM/A, one led by Lt. Col. Samuel Gai and Maj. William Abdallah Chuol-the Anyanya II separatist faction -and the other by Colonel Garang. The SPLA fought its first battles against Anyanya II. Although Anyanya II was driven out of Ethiopia and some leaders killed, it did not dissolve but became a predominantly Nuer militia taking arms from the Sudanese government and fighting the SPLA. Anyanya II was particularly useful to the Sudanese government because of its location along the route from Bahr El Ghazal to the Ethiopian border, where it attacked SPLA recruits on their way to Ethiopian training camps. It also intercepted and fought the trained SPLA troops proceeding from their bases in Ethiopia.[138]
Government Use of the Baggara as a Forced Displacement Tool, 1980s
Following the southern mutiny and the resumption ofwar in 1983, both governments of dictator Jafa'ar Nimeiri (1969-85) and elected Prime Minister Sadiq al Mahdi of the Umma Party (1986-89) took steps to counter rebellious southern groups-and to protect the areas of oil exploration-by favoring Arab ethnic groups in the "transition zone" of Sudan between north and south. Both governments armed the militia of the Baggara nomadic cattle herders of southern Kordofan and Darfur, the muraheleen,[139] with automatic weapons. The Baggara began to use their new weapons to loot cattle and force the Dinka and Nuer from their land and pastures. The Baggara already had an advantage over their Dinka and Nuer neighbors, in that the Baggara had horses whereas southerners could not keep horses because of the inhospitable climate.
In the north of Western Upper Nile, the government used displacement to make the area "safe" for foreign and northern-based exploitation of oil. The Heglig oil location (in Block 2) was not densely populated, but Dinka lived dispersed in the whole Heglig area and moved their cattle tocattle camps in that same region, according to contemporary accounts, the memories of former residents, and older maps.[140]
The government permitted the muraheleen to operate unchecked in Dinka and Nuer areas in order to (1) deflect the political threat posed by the marginalized but potentially threatening Baggara by allowing them to reap profits from looting their richer neighbors to the south; (2) defeat southern rebels; and (3) gain access to southern resources such as oil, water, and grazing lands in the context of a growing economic and environmental crisis in the north.[141] The government did not pay the Baggara anything much for their raids, but gave their militia a license to steal from the Nuer and Dinka: cattle, grain, household goods-and women and children, taken as slaves. Notably, after the civil war resumed, the government stopped intervening in raids and calling tribal conferences to resolve conflicts between Baggara and the Nuer and Dinka.[142]
In the early 1980s, the Baggara stepped up their fights with the Ngok Dinka of Abyei, southern Kordofan, over water and grazing; the Baggara's home areas periodically suffered drought and were undergoing desertification-and a famine in 1984. They thoroughly looted and displaced these Ngok Dinka of Kordofan, many of whom became displaced persons south of the Bahr al Arab River, in the Bahr al Ghazal territory of their Twic Dinka cousins.[143] Even there, Baggara assaults kept and keep the displaced Ngok Dinka and their Twic Dinka cousins on the run.[144]
The next line of Baggara attack during those early years followed known watering routes southeast, through Western Upper Nile. Entering from the westerly direction of Abiemnon at the beginning of the dry season in December or January, when the roads were dry enough for their horses, the muraheleen displaced small isolated villages in Dinka areas of Western Upper Nile throughout the early 1980s. They pierced through to Leek Nuer territory and displaced villages there also.
According to a church development worker based in Bentiu and Mayom, in about 1982 the Baggara began showing up in the Mayom area with automatic weapons and became more aggressive. That year the Baggara took about 500 Nuer and Dinka cattle from the Heglig/Unity/Mayom region, and ran back north.[145]
A young Nuer man told how on two occasions in the 1980s the muraheleen came on horses and raided his village, Rang (two hours north of Bentiu on foot):[146]
In the beginning, we had no guns. . . . The muraheleen were shooting at people, who scattered. Then the muraheleen took the cows and left. Sometimes they captured children playing in the forest. Those children never returned. The muraheleen wore long white robes, and had guns. They came once a year but our people did not move.[147]
The muraheleen burned down the huts and grain, but these Nuer did not leave until the "Arab soldiers came footing [sic], in uniform," the Nuer man explained. "They were coming quietly, then they started shooting without saying anything." The soldiers also came twice, destroying the village and taking the cows. But the second time they set up a base in the village. The narrator was then sixteen. "The soldiers did not tell us to move but we saw them shoot civilians, and this was too much for us. My brothers were killed, the younger and the elder. They were in the luak [cattle byre]."[148]
Inside the current Block 4, west of Bentiu, and probably not far from what later became an oilfield, there were schools attended by hundreds of Leek Nuer children in 1983, according to the man who then served as school administrator.[149] These Nuer were pushed by the Baggara to cross the Bahr El Ghazal (Nam) River for safety. The school administrator said:
The Baggara looted the Nuer cattle, and sold it to traders. They killed people, abducted girls and boys to be slaves, and sold some to Libya. If a person were lucky, his children would be in Khartoum. Most of those abducted disappeared. This started . . . when the government of Sudan gave guns to the Baggara.[150]
The schools the administrator was managing closed from 1983 until 1991 because the Baggara raiders destroyed them. Whole Nuer communities fled; many families were separated. Most young Nuer men went to Bilpam, an SPLA military base in Ethiopia, "for training to protect their land," the school administrator said.[151] "The Baggara Misseriya came from Abiemnon, which was an Ngok Dinka area. They pushed the Dinka to Bul Nuer areas."[152]
The administrator recalled that:
Before the discovery of oil, chiefs on both sides would negotiate their differences, in 1965 and 1967. After that, there was no negotiation because the government of Sudan prevented that. The government of Sudan at Bentiu took no action to protect any Nuer or Dinka from the raids. They called it a "cool war," a political war, which kills people indirectly.[153]
Thus, the Leek Nuer fled from north of the Bahr El Ghazal (Nam) and Bahr Al Arab Rivers, down to the area south of Bentiu. Some Ruweng (Panaru) Dinka moved far away, south and west to Bahr El Ghazal province. Both Nuer and Dinka tended to go to relatives where possible, and to put a river between themselves and the Baggara for protection.[154]
According to Taban Deng Gai, the governor of Unity State (Western Upper Nile) from 1997-1999,[155] the attacks on the Nuer in Western Upper Nile followed government demands that the Nuer population leave the areas north of the river:
The Leek Nuer lived north of Bentiu, in what are now the Unity and Heglig oilfields. In 1983 they were told to move by the central government, to cross the [Bahr El Ghazal or Nam] River. They received no compensation. Their names were registered for "later on."[156]
Many contemporaneous reports confirm the expulsion of Nuer and Dinka from the early oilfield areas of Western Upper Nile. Anthropologist Sharon E. Hutchinson lived in Tharlual, where a Leek Nuer chief resided, during her fieldwork among the Leek Nuer in the early 1980s.[157] She described their clearance:
By late 1984 I had learned that my principal field sites in both eastern and western Nuerland had been destroyed. Tharlual had been overrun and razed by a band of northern Baggara (Misseriya) Arabs that had been armed with automatic weapons and ammunition by the government and instructed to clear the oil-rich lands of the Western Upper Nile of its Nilotic inhabitants.[158]
Africa Watch, now the Africa division of Human Rights Watch, reported that the muraheleen, active in 1983 and 1984, were "raiding into north-west Upper Nile, and devastating [the] Leek [Nuer]."[159]
A large pocket of Ruweng (Panaru) Dinka, who kept few cattle and were more sedentary, remained in the northeastern corner of Western Upper Nile/Unity State in Block 1-Block 5A.They were affected by government-armed muraheleen raiding starting in about 1983; by 1993, residents told a relief assessment team, they had few cattle because they had been taken in "Arab cattle raids" since the beginning of the war. The team observed very few cattle and goats in this whole Dinka area.
Perhaps as much as 70 percent of the population surveyed in 1993 in this part of Ruweng (Panaru) County had died in the previous four years (1989-93) because of displacement, migration, and disease, primarily kala azar, a wasting disease, according to those conducting the 1993 evaluation.[160] The Dinka residents were exposed to kala azar when they began hiding in the acacia forest nearby for safety from the murahaleen raids.[161] This epidemic started in the (western) Jikany area, south of the Bahr El Ghazal (Nam) River, in the mid-1980s, spreading north from the Nuer population to the Dinka area of Ruweng (Panaru) County in the late 1980s. MSF finally estimated that about 100,000 people had died from kala azar in Western Upper Nile/Unity State since 1984, as a result of the war.[162]
Southern politicians at the time saw a close link between the displacement and oil. Abel Alier, former head of the southern regional government, wrote that Chevron attempted to support these muraheleen as a way to protect the oilfields:
[T]he role of oil in South-North politics was further developed when Chevron made concerted attempts to support the activities of Southern Kordofan based armed militia [muraheleen] to secure protection of the oilfields in Bentiu Area Council to make exploitation and further prospecting possible. All oilfield areas were practically cleared of civilians in 1985-86; some of [the civilians] returned to the area in 1988 under the protection of the SPLA.[163]
Africa Watch noted that the muraheleen operating in the area in the early 1980s had been "organized by the government to protect Chevron's oilfields in Bentiu."[164] A journalist based in Khartoum at the time wrote that in early 1984 a special "Oilfields Protection Force" was established at Chevron's request and that until at least late 1984 Chevron was providing substantial support to these troops. According to her, the battalion was based not in the oilfields (Heglig and Unity) but further north, in El Muglad, and was under the command of the son of General Abboud, the late military dictator.[165] Years later, in 1988, the troops were sent to Rubkona near Bentiu to re-secure the oilfields and put pressure on Chevron to fulfill its concession obligations.[166]
Chevron Attempts and Fails to Develop the Oilfields
From the outset, the Chevron project was beset with difficulties. The SPLM/A opposed the oil developments in Heglig and Unity, the relationship between Chevron and the government of Sudan was tense, and the civil war as well as the government's political and economic difficulties kept the country perpetually unstable and an ongoing investment risk.
Chevron relations with the local southern authorities (during the period when the south had autonomy, 1972-83) began propitiously but deteriorated.[167] The security situation worsened. In 1982, Nuer rebels took hostage five employees of a Chevron subcontractor, seizing them from offices in Yoinyang near Bentiu. After several weeks, a Nuer Roman Catholic priest, Father Zakaria Bol Chatim, managed to convince Anyanya II to let the hostages go. According to one observer, the rebels wanted to make the point that the oil "belonged to south[erners]."[168] In December 1983 Charles David Hubbard, a Chevron expatriate employee, was shot and killed during an armed robbery attempt at the company's base camp in Bentiu.[169]
The safety of Chevron facilities and personnel was a major concern to the company. Oil development largely depended on the Sudanese government's ability to provide adequate security for international oil companies working there. Abel Alier, former head of the southern regional government, maintained that Chevron itself had a role in destabilizing the area, leading to its expulsion in 1984.[170]
On February 2, 1984, Anyanya II, led by Cmdr. Bul Nyawan and his deputy, Cmdr. James Lial Dieu, attacked Chevron's base camp in Yoinyang, killing three expatriate workers[171] and injuring others. The company suspended its operations.[172]
After receiving assurances from the Sudanese government that the area was safe, Chevron resumed some operations on March 9, 1984, a month after the fatal rebel attack.[173] John Silcox, president of Chevron's overseas operations, told the Wall Street Journal that the main reason the company did not fully resume operations was that "[w]e have to have access to the south before we can go back to work and we're not going to expose our employees to undue risk. And being in the middle of a civil war zone is an undue risk in our opinion."[174]
But Chevron's area of operations did not quiet down. The Anyanya II rebels under Brig. Paul Thong in September 1984 overran Bentiu and then withdrew, taking hostage three Catholic priests (one Sudanese and two foreigners) from the parish house in Bentiu. The rebels, who held the hostages six weeks, had warned foreigners to leave the area. Expatriates working in development projects had already departed. One hostage was the same Nuer priest, Fr. Zacharia Bol Chatim, who had negotiated the release of oil company hostages the year before. The rebels initially thought the two white priests with him were Americans (i.e., with Chevron). The church again negotiated the release.[175]
By the end of 1984, while Chevron's operations were effectively suspended, the Sudanese government defaulted on its debt service payments of U.S. $ 264 million to international creditors, including an approximately U.S. $ 218 million debt to the IMF. As a result, the IMF threatened to declare Sudan ineligible for new loans unless an agreement could be reached regarding resumption of debt payments. The Sudanese government approached its old benefactors, the Saudis and the U.S., to repay the debt for them, without success.[176] The government's inability to pay was due in part to the fact that the Chevron project did not provide any revenue.[177]
Overthrow of President Nimeiri, Chevron Pulls Out, 1985
Faced with severe economic pressures and internal conflict, the government of President Nimeiri was ousted in an armed forces coup led by Defence Minister Gen. Abdul-Rahman Suwar Dahab on April 6, 1985, after intense pressure was brought on the Nimeiri government by widespread popular protests and peaceful street demonstrations.
Following Nimeiri's overthrow, the SPLM/A announced it would continue to block Chevron's operations because it remained at war with the new government. SPLM/A leaders said the U.S. government could hasten the resumption of oil operations by supplying the SPLA with arms and equipment.[178]
Chevron's relationship with the interim military government deteriorated. On June 11, 1985, the government warned the company against using Israeli-made goods for its Sudanese oil operations because this violated the Arab embargo on Israel.[179] On October 25, Sudanese authorities accused Fred Daniel Clement, an operations manager for the Parker Drilling Company, a Chevron subcontractor in Sudan, of "intercepting [radio] communications" from the office of the Palestinian Liberation Organization in Khartoum. Clement was detained and released two days later.[180] On December 24, 1985, Chevron announced the suspension of its operations in the Bentiu region because of a need to reassess the "commercial viability" of the project.[181]
Chevron did not suspend its operations in El Muglad until later. But the company never returned to develop the oilfields of southern Sudan, and it sold out its rights to the entire Sudanese concession in 1992.
Civil War and Political Developments
Elections 1986, Military Coup 1989
The military junta ruled for one year, and stepped down after elections were held in May 1986. Two large pre-existing political parties then dominated the political scene: the Umma Party and the Democratic Unionist Party (DUP), each based on traditional Sudanese Islamic sects, the Ansar and Khatmiyya, respectively.[182] These parties and several smaller ones juggled offices as they formed and unformed alliances until an Islamist-military coup on June 30, 1989, installed Lt. Gen. Omar El Bashir as president. El Bashir remains in power as of the time of this writing. The National Islamic Front (NIF), an Islamist political movement, was the party behind the coup and had participated in past governments as a minority party. It is still in power and has changed its name to the National Congress (NC).[183]
SPLA Control of Western Upper Nile
The SPLA came from Ethiopia to Western Upper Nile in force in late 1984-early 1985, with its two (newly-formed and –trained) battalions, the Timsa (Crocodile) and the Tiger.[184] Following a March 1985 battle between the SPLA/Anyanya II and Baggara raiders at Thargana near Mayom, in which the Baggara were driven from Nuer areas, a relative peace ensued between the Baggara and Nuer. The SPLA/Anyanya II defeat of the Baggara was led by then SPLA Maj. Bul Nyawan, also responsible for the decisive February 1984 Anyanya attack on Chevron facilities.[185]
By 1986, the SPLM/A dominated most of Western Upper Nile-except for the government garrison towns, some oilfields north of Bentiu, and the Bul Nuer area, which was loyal to local Anyanya II commander Paulino Matiep, a Bul Nuer. The SPLA captured Ler in Dok Nuer territory in March 1986.
Cmdr. Riek Machar recalled with enthusiasm a scouting mission the SPLA made into the Heglig oilfield area in 1987, which demonstrated that the SPLA could reach the Heglig oilfields without detection.[186] While the SPLA remained in control of some oilfield areas in Blocks 1 and 2, some displaced Nuer and Dinka began to return to those areas and rebuild their homes. These areas, however, were very remote and received little attention from the outside world.
By 1988, most of Anyanya II was brought into the SPLM/A through negotiations. This was the high point of southern unity, which lasted until 1991. Only Paulino Matiep and his Bul Nuer forces-and militia of smaller ethnic groups such as the Mandari, Murle, and Toposa-remained on the side of the government
When Chevron dismantled some of its rigs in Unity field in 1988, shipping them to Heglig and then on to El Muglad further north, the SPLM/A considered that they had pushed Chevron out of the south: "The SPLA established a firm liberated area and we visited often, searching for the [government] army. The oilfield work was stopped. We stopped them," asserted one SPLA combatant.[187] Another said, "We fought the enemy in Heglig . . . The objective there: the enemy came and took the petrol. We chased them away. The purpose was protection."[188]
From a position of strength, with most of the Anyanya II militia in the SPLA, the SPLM/A entered into serious peace negotiations with the government in 1988. A settlement became a distinct possibility, until the 1989 Islamist-military coup, which prevented any peace agreement from being concluded.
Government Use of Paulino Matiep's Nuer Militia
In the face of SPLM/A successes, the new government honed its preferred strategy of divide and displace/destroy-successfully employed through the Baggara-to regain access to some of the oilfields, and thereby to generate oil revenues to salvage its economy. The government used Nuer commander Paulino Matiep, to whom it referred as a "friend" of the army, as its primary surrogate force to keep to a minimum the presence of the SPLA in Blocks 1, 2, and 4.
Cmdr. Paulino Matiep, then leader of the Anyanya II (government-aligned) forces, had never joined the SPLM/A. His role was to become ever more important in the years that followed. He was strategically placed, in Bul Nuer territory including Mayom and Mankien, to provide a buffer against SPLA incursions into the oilfields from the Dinka and SPLM/A stronghold in Bahr El Ghazal.
In return for Cmdr. Paulino Matiep's service as an oilfield guard, the Sudanese government provided substantial material benefits to him and his forces. Partisans have described the co-option of Cmdr. Paulino Matiep as an aspect of the government policy of divide, displace, and destroy:
They [Khartoum] created Paulino [Matiep]. They have a policy of interfering with the unity of large ethnic groups, especially the Nuer, who are championing independence. To undermine this, they cause the Nuer to fight among themselves. They must recruit people like Paulino to do this. This is the strategy of the government, to get the Nuer and Dinka to break into groups and fight [among themselves].[189]
In September 1988, when the SPLA under Riek Machar conducted a coordinated attack on Mayom, successfully capturing the Anyanya II base, the government sent Lt. Gen. Omar El Bashir with army reinforcements to recapture Mayom from the SPLA, which he and Cmdr. Paulino Matiep succeeded in doing. A bond between the two men was forged-more significant when Bashir became president after the military coup of June 30, 1989.[190]
Government Army Displacement of Nuer from the Oilfields, 1990
The government army, along with the Baggara muraheleen and Paulino Matiep's militia, served as an agent of displacement. Nuer villagers from Toryat near Bentiu said that the army drove them out of their town in May 1990 after an SPLA attack on the government army garrison in Bentiu.[191] Shortly thereafter, an elderly Nuer survivor described to a journalist how some one thousand soldiers appeared following a pre-dawn aerial strafing of the village, in what he deemed was retaliation for the SPLA attack: "What happened is, the jallaba[[192]] just walked into the village and opened fire, so everybody just ran." When he emerged from hiding, he found his hut burned and at least one hundred people, about a tenth of the village's population, dead. The northern soldiers shot his brother, caused many family members to disappear, razed Toyrat, and drove him and the other survivors away. Two of his children died of diarrhea and pneumonia as they fled before the family reached a refugee village near Nasir, 250 miles east of their home. "The jallaba [Arabs] are wanting the oil," he said. "If the jallaba go away from there, we shall be rich."[193]
A young Leek Nuer said he decided to join the rebels because his family and people were displaced by the Arabs in 1990: "Why do people disturb those who do not have guns? . . . Our place was close to the oil, near Yoinyang, to the west of Yoinyang," not far from Bentiu. They were displaced by soldiers, not by the muraheleen: "The soldiers were looking for oil."[194]
SPLM/A Split; Riek Machar Heads Breakaway Faction, 1991
In 1991, the SPLM/A was greatly weakened by the departure of three commanders and their troops, following an unsuccessful attempt to depose John Garang from SPLM/A leadership. Two of the departing commanders were Nuer: Riek Machar, the SPLA zonal commander of Western Upper Nile, and Gordon Kong Chuol of Nasir, Eastern Jikany (in Anyanya II before joining the SPLM/A in 1988).[195] John Garang, who remained in command of the SPLM/A, was Dinka. Many of the troops following Riek Machar and Gordon Kong were Nuer, and the split in SPLM/A ranks was perceived as falling along Nuer-Dinka lines.
Following the coup attempt, both sides committed summary executions of soldiers and officers who happened to be in the wrong place, or of the wrong ethnicity, at the wrong time: i.e., Dinka soldiers were killed in territory controlled by the Nuer breakaway faction and Nuer were killed in mainstream SPLM/A territory.[196]
The dissidents under Riek Machar formed a separatist southern rebel movement initially known as the SPLM/A-Nasir. Its stated goal was independence for the south, rather than the united, socialist Sudan sought by John Garang. By virtue of the 1991 split, Riek Machar became a key player with regard to the oilfields in his home region. His rebel forces claimed all the rural land of Western Upper Nile, excepting the few garrison towns. He nominally controlled even the Bul Nuer area where Paulino Matiep was based; Paulino Matiep joined the breakaway faction because its goal was independence, also the goal of Anyanya II. While this turn of events, along with many others in the war, may seem illogical given Paulino Matiep's previous relationship with the government, a partial explanation probably lies in the Sudanese government's covert support for the breakaway faction, pursuant to its policy of ethnic divide and conquer.
Neither the Riek Machar faction nor the Paulino Matiep militia ever attacked the Sudanese government.The clashes between Riek Machar's forces and the SPLA, however, were frequent, bloody, and unsparing of civilians. The ethnic division was probably sealed in late 1991 by the "Bor massacre."[197]
Each side was capable of quick guerrilla strikes against the other's forces and civilian population. Each knew the terrain and could move quickly on foot. In 1993, the fighting between them so seriously affected the civilian population that it triggered a famine in the "Hunger Triangle" of Upper Nile.[198] The Nuer-Dinka fighting on the West Bank of the Nile did not cease until the Wunlit West Bank Nuer and Dinka People-to-People Peace and Reconciliation Conference of 1999 (below).
After the split, traditional southern rules of warfare that were supposed to spare women and children were disregarded.[199] Unfortunately for the civilians, the southern leadership (John Garang and Riek Machar) on both sides "reached for the 'ethnic' card-and from there the conflict spiraled downwards into numerous independent warlords (many armed by Khartoum), each preying upon one another's civilian populations."[200]
"Traditional" Nuer-Dinka clashes included only the young men who raided cattle, and fought with spears, with fights lasting no more than a few days. Retaliation by the loser would occur when the time was right, or the parties would reach a truce or settlement through their chiefs and sometimes through their prophets. From 1991, however, the bitterness caused by the killing of women and children led civilians on each side in the Nuer-Dinka border war to ask their armed men for support.[201] But once the rebel military forces were engaged in the local conflicts, it became very difficult to work out a truce between the chiefs.[202] The latter had no jurisdiction over the rebels, who did not agree that they should pay compensation, the customary manner of settlement for homicide, raiding of cattle, and other damages.
The Riek Machar breakaway faction was supplied with arms and equipment by the Sudanese government from 1991 on, although it denied so at the time.[203] The Riek Machar forces never attacked the government's forces from 1991 until 1999. In 1993, according to one report, the government was negotiating with the Riek Machar group about the sharing of oil revenues, but no agreement was reached.[204]
By 1996, the Riek Machar forces had signed a political agreement with the government that provided for a southern referendum on its political future to be held four years from an indeterminate date, holding open the possibility of independence for the south. This 1996 agreement was a marriage of convenience, although tenuous. It was enough, however, to open the door to oil development.
THE ARAKIS PERIOD: 1992-98
Overview
In 1992, Arakis Energy Corporation, a Canadian oil company, with its partner State Petroleum acquired Blocks 1, 2 and 4 of the much larger concession that had belonged to Chevron. Yet, although it succeeded in making several new oil discoveries and beginning shipments of crude oil to a domestic refinery, Arakis was never able to raise enough capital to finance the project on its own; it was charged with insider trading and failing to disclose material facts during an illusory funding scheme in 1995.
In April 1996, Riek Machar and another rebel commander signed a Political Charter with Khartoum, formally abandoning the rebel movement. This agreement neutralized the rebel forces in Western Upper Nile/Unity State that might have threatened the Arakis oilfields.
In December 1996, Arakis sold a 75 percent interest in its project to three state-owned oil companies (from China, Malaysia, and Sudan), with which it formed a consortium called the Greater Nile Petroleum Operating Company (GNPOC). In March 1997, GNPOC agreed to build a 1,540-kilometer pipeline from the oilfields to a marine export terminal on the Red Sea. Pipeline construction began in 1998 and involved a Chinese subcontractor and several European companies. The pipeline and the export terminal were to be owned by GNPOC.
In April 1997 the Sudanese government entered into the Khartoum Peace Agreement with Riek Machar's forces and several other smaller rebel factions, but not the SPLM/A. Riek Machar was appointed president of the Southern States Coordinating Council (SSCC), to govern the south, and also headed a new army (SSDF) created from the former rebel armies that signed the Khartoum Peace Agreement. Paulino Matiep, who had joined his Anyanya II forces with Riek Machar's breakaway faction in 1991, was promoted to major general in the Sudanese army in 1998 and his militia, directly supplied by the government, was given a name: South Sudan Unity Movement/Army (SSUM/A).[205]
Forced population displacement in Western Upper Nile/Unity State started up again in 1992, with the sale of the concession to Arakis, and heated up further in 1996-97, with the signing of the Political Charter and the Khartoum Peace Agreement. The government launched muraheleen/army offensives that displaced thousands of civilians, particularly from the areas around the mostly Dinka villages of Pariang and in Ruweng County in general, in and near the Arakis oilfields. Insecurity and Sudanese government flight bans hindered humanitarian organzations' operations in the area.
Relations with the U.S. worsened during the Arakis period. In 1993, the U.S. State Department designated Sudan as a country that supported terrorists, and U.S. President Clinton on November 3, 1997 signed an executive order imposing economic sanctions on any U.S. person doing business with Sudan.
Arakis Energy's Struggle to Develop the Oilfields
Early Problems for Arakis, 1992-93
The Islamist-military government that took power in 1989 was determined to develop Sudan's oil potential. In 1992, it prevailed upon Chevron to sell its rights in the concession.[206] On June 15, 1992, eight years after suspending its operations in southern Sudan, Chevron sold its 42-million-acre (170,000-square-kilometer) concession for an estimated U.S. $ 23 million to a private Sudanese oil company, Concorp International.[207] Concorp then sold off the exploration and production blocks to different companies. On December 7, 1992, the small Canadian company Arakis Energy Corporation announced that it had formed a partnership with State Petroleum Corporation, also based in Vancouver,[208] and that the partnership had acquired Blocks 1, 2, and 4 of the Chevron concession from Concorp.[209]
James Terrence Alexander, then chief executive officer of Arakis, called the project "the opportunity of a lifetime for a company like Arakis" because it could bring about its transformation from a small to a mid-sized, independent oil company.[210] But the deal raised concerns from the press and the industry. Arakis primarily operated in the Appalachian Mountains in the U.S. The situation in Sudan was far more hostile and had forced a much larger, more experienced, and wealthier oil company to leave because of major security risks and questions about the project's commercial viability.[211]
In July 1993, Arakis announced that it would assume full ownership over the project-buying out its partner State Petroleum -and concentrate on raising the estimated U.S. $ 750 million to $1 billion needed to finance the Sudan project.[212] Arakis proved unable to raise enough capital to complete the project, however, though it did succeed in making new discoveries at Toma South and El Toor (Athonj) oilfields in Block 1.[213]
Formation of GNPOC Consortium, 1996
Despite the collapse of a mooted Saudi-backed finance deal for Arakis in 1995, later found by the British Columbia Securities Commission (BCSC) to have involved false and misleading statements and insider trading,[214] some activity continued on the ground in Sudan. Road building began north of Bentiu in 1996, in preparation for moving in heavy equipment. In June 1996, Arakis brought eight wells on stream at Heglig, subsequently shipping low levels of crude oil to a small refinery at El Obeid in Northern Kordofan for domestic consumption.[215] One journalist who visited the drilling site wrote,
The relationship between Arakis and its Sudanese hosts is self-evidently symbiotic . . . . The oil camp opens its doors to military men as well as nomads. Arakis services broken military trucks, provides electricity lines to their barracks and even pipes in water to army camps.[216]
Despite this small success, Arakis failed to raise sufficient funds for the larger project, while it remained under government pressure to produce. On December 6, 1996, Arakis sold 75 percent of its interest in the project to three other companies, with which it formed a consortium called the Greater Nile Petroleum Operating Company (GNPOC), whose value Arakis put at approximately U.S. $1 billion.[217] The GNPOC Exploration and Production Agreement was planned to last thirty years (until 2026).[218] Arakis was to be the operational partner. The three other companies were state-owned: the China National Petroleum Company (CNPC), Malaysia's Petronas Carigali Overseas Sudan Berhad (a subsidiary of Petronas Nasional Berhad, the national petroleum corporation of Malaysia), and Sudan's state-owned oil enterprise Sudapet Limited. They would own 40, 30, and 5 percent of the project, respectively, and the remaining 25 percent would remain in Arakis' hands.[219] CNPC and Petronas put up further project financing until Talisman entered the picture in 1998.
On March 1, 1997, the Arakis-led GNPOC consortium agreed to build an estimated 1,540-kilometer export pipeline from the oilfields north to a new marine port for oil supertankers on the Red Sea. The Crude Oil Pipeline Agreement (COPA) called for the GNPOC consortium to construct, own, and operate this pipeline and the supertanker export terminal, as well as field surface facilities.[220]
In late 1997 Arakis sold off its U.S. assets in response to the tightening of U.S. sanctions on U.S. companies doing business in Sudan. However, Arakis was unable to find financing for its share of the venture, and agreed to sell its interest in GNPOC to Talisman Energy in August 1998.[221]
Divide, Displace, and Destroy in the Oil Areas
Army/Muraheleen displacement, 1992-98
Displacement forced by the army started up again in the 1992 dry season, the same year that Arakis and State Petroleum acquired Blocks 1, 2, and 4 of the dormant Chevron concession. In February 1992, according to an investigation undertaken at the behest of the Canadian government in 1999, "military offensives caused the deaths of 35 people (mostly civilians), the theft of about 500 cows, some tukls [homesteads] burned and people forced out" of Pandakwil, Kong, Panlokwoc, Lok, Kwoc, and Panlock-Bibiok, hamlets in the oilfield area north of Bentiu (Blocks 1 and 2)."[222] Many of those displaced, however, returned and rebuilt. The government and its muraheleen allies then undertook a five-month offensive to dislodge the civilians permanently. From November 1992 (a month before the sale to Arakis and State Petroleum) through April 1993, these forces looted, burned, killed, and abducted people around the town of Heglig in Block 2.[223]
This period saw at least 213 deaths, sixty-three abductions, instances of rape, and 1,237 head of cattle stolen. In all, fifty-seven hamlets were burned, and 1,300 people displaced to government of Sudan-controlled areas before SPLA forces caused the Sudanese government troops to withdraw to Bentiu and El Obeid towns.[224]
The government launched a new offensive at the beginning of the next dry season, in December 1993. This time, the army hit hamlets close to Heglig: Panlok, Kwok, Nhorial, and Panagwit. Twenty-six residents were reportedly killed. Survivors maintained that the government aimed to clear the area so the SPLA would not remain near the oilfields. "It was after this that the area around Heglig was more or less deserted except for [government of Sudan] forces," the Canadian delegation reported.[225] The Dinka village of Maper in Block 1 was renamed Munga after government troops deployed there and the oilfield named Munga was developed.
Shortly before the formation of the GNPOC consortium in December 1996, displacement accelerated again. In October 1996, the government launched a muraheleen/army offensive that displaced many thousands in Ruweng County and looted their cattle and grain. Some of the displaced went into what witnesses referred to as "peace camps," a term usually used in the Nuba Mountains to describe sites in which forcibly displaced persons were required to live and provide free labor to soldiers and others. The camps were said to be in Pariang and Athonj (El Toor).[226]
This displacement continued. In late January 1998, a relief agency assessment team visited Ruweng (Panaru) County in the Padit area just east of Block 1, in Block 5A, an area inhabited mostly by Dinka. Ruweng County straddles Blocks 1 and 5A.[227]
The assessment team was told by the residents and the displaced persons there that two months before, in November to December 1997, a government army force from the garrison town of Pariang had attacked sixteen villages northwest, west, and southwest of Pariang (Block 1). The displaced provided the names of those, their own villages.[228] Most of the villages were looted and burned down, cattle were raided, and some elderly and young children-those not fast enough to run away-were killed.
The assessment team visited one of the villages identified by the displaced, Monykwo. There they counted sixty-eight burned down tukls (homes); the church and six tukls were still intact. The sorghum was partly harvested. The team visited the population of Monykwo in the acacia forest east of the Diir River: they saw ten small camps, with thirty to forty people (three or four families) sharing one camp. There were no food supplies, hardly any mosquito nets or blankets, and the families lacked shelter. The people interviewed there and in a displaced area to the north (who had fled from the burned village of Ling), said that they had been displaced because of the attacks, during which they had lost most of their property, such as clay pots, mosquito nets, and blankets.
The people of this area did not suffer at government army hands only. These Dinka residents of the Padit, Ruweng County, area, who had always been identified with the SPLM/A, reported to the 1998 assessment team that they had been attacked three times after 1991 by Riek Machar's government-supported forces.[229] They said that Riek Machar's forces had occupied the area for five months in 1993, burning and looting homes. They told the agency team that the Riek Machar forces again occupied the area, from October 1996 to April 1997, raiding cattle as they left, which had caused considerable internal displacement.[230] They distinguished between the attacks by Riek Machar's Nuer forces (at all times in question associated with the government) and the more recent government attacks (November-December 1997) conducted by Sudanese government army soldiers garrisoned in Pariang.
The agency team treated 768 patients during the 1998 assessment. It noted that most of the people needed treatment for more than one disease, and the report commented, "It was striking to see how sick the people were."[231] Maternal and child mortality rates were very high: among the population surveyed, 15 percent of the mothers died during delivery, and 43 percent of the children. None of the children questioned went to school. There were no schools in the whole area, nor any trained teachers available. There was one Catholic priest, and twenty-two villages had a chapel each. By this time, there were two dry season landable airstrips, in Padit and Gumriak. This entire area, including the relief airstrips, was the target of government army attack again in May 1999.
The population of Panaru (Ruweng County) in the 1983 census was 79,000, much higher than the 55,000 estimated population in 1994.[232] The agency assessment team cited the causes of the drop in population as disease and migration due to war.[233] Though the county commissioner gave an estimate of 55,000 population for 1998, the 1998 agency assessment team surveyed the area and estimated that population had been reduced to the 25,000-30,000 range.[234] This was the direct result of years of repeated government militia and army raids and flight bans.
The 1996 Political Charter and the 1997 Khartoum Peace Agreement
In addition to deploying the army and Baggara militia to clear out and "protect" the oilfields by displacement of the residents, the Sudanese government implemented a strategy of dividing and buying off those southerners occupying strategic territory. It carefully laid the necessary political groundwork. A peace agreement with Riek Machar's Nuer-plurality breakaway faction, whose territory extended into, or was close enough to threaten, Blocks 1, 2, and 4 and much of the Muglad and Melut basins, was achieved. It constituted the jewel in the crown of the government's divide-displace-and-destroy strategy to secure the southern oilfields for development.
In April 1996, the government signed a Political Charter with Riek Machar, head of the force by then known as the South Sudan Independence Movement/Army (SSIM/A).[235] The only other rebel signing that Political Charter was Cmdr. Kerubino Kwanyin Bol, a Dinka former SPLA high commander who joined Riek's forces in 1993 after escaping from several years of incommunicado detention by the SPLA.[236] The Political Charter provided for a referendum "to determine the political aspirations of the people of southern Sudan."[237] On its face, this represented a change in the government's hard line on the unity of Sudan. One year later, in April 1997, the Political Charter was incorporated into a peace agreement between the SSIM/A and the government. A number of smaller rebel factions also signed the 1997 Khartoum Peace Agreement.[238] The government touted it internationally as the solution to the war, and lambasted the SPLM/A for not signing.
Riek Machar argued he had no choice but to sign the agreement with the government after the SPLM/A prevented his group, the SSIM/A, from joining the broad opposition coalition, the National Democratic Alliance (NDA), formed in Asmara, Eritrea, in 1995.[239] Others "thought that he had been forced to do this because of the failure of the Ethiopians, Eritreans, or Americans to extend military assistance to his faction."[240] Whatever the reason, he made his deal, and took many with him.
The 1997 Khartoum Peace Agreement called for the establishment of a Southern States Coordinating Council (SSCC) to govern southern Sudan prior to a self-determination referendum to be held (after certain conditions were met) in four years. President Bashir appointed Riek Machar president of the SSCC and assistant to the president of Sudan. Riek Machar also became head of a new political group he formed, the United Democratic Salvation Front, comprising most of the ex-rebel parties to the Khartoum Peace Agreement. In 1999, when the government lifted its ten-year ban on political associations, the UDSF registered as a political party in Khartoum.
Riek Machar also assumed the role of commander-in-chief of the SSDF, the army formed by the rebel groups that had signed the Khartoum Peace Agreement. The SSDF also-nominally-included the forces of Cmdr. Paulino Matiep, who joined Riek Machar's forces in 1991. The 1997 Khartoum Peace Agreement provided that the SSDF "shall remain separate from the National Army and be stationed in their [SSDF] locations under their command."[241] The agreement declared that federal powers included armed forces and defense affairs and national security;[242] it reserved public order, state security, and good governance to the states.[243]
According to the Khartoum Peace Agreement, as interpreted by the Riek Machar group, the SSDF was to provide security in the south pending the referendum on the south's political status. This group understood that the territories they had "liberated" from the 1980s until 1997 were to be theirs to govern and protect exclusively, including the facilities of any oil company doing business in their area.[244]
The SSDF duly waged war on behalf of the government.[245] The SSDF later insisted that the government could not have fended off the SPLA's attempt to capture the Eastern Equatorian garrison town of Torit in September-October 1998-nor retaken Torit in late 2002-without SSDF support. However, the SSDF complained that it only received equipment from the government of Sudan as long as the government verified that SSDF units were engaged against "the Dinka" (SPLA). As stated by the SSDF's chief of staff: "Immediately after the Khartoum Peace Agreement was ratified, we received some little help: rifles, ammunition. We only received this when we were fighting. If no fighting, we did not receive anything."[246]
The government was, moreover, nervous about the UDSF's self-determination agenda. Accordingly, it moved in the army and government-supported Islamist militia (mujahedeen, holy warriors) to guard the area north of Bentiu, Blocks 1 and 2, at a time when the relationship between the UDSF/SSDF and the government was still new.
These troops posed political problems for the Riek Machar UDSF government of Unity State, which in early 1998 implemented an agricultural scheme in the Dinka village at Athonj, in Block 1, where drilling for oil was underway at the El Toor oilfield.[247] UDSF state authorities wanted to expand the agricultural scheme, but the army informed them that no settlement would be allowed so near the drilling location. The army then displaced the Dinka from Athonj in October 1998, according to the UDSF officials.[248]
Tensions had already broken out between Paulino Matiep and Riek Machar's factions in late 1997 over the campaign for governorship of Unity State. The government took advantage of the circumstances by continuing to separately fund Paulino Matiep and his militia to keep the Riek Machar group from controlling any oilfields. In addition, as long as the Nuer fought each other, conditions would not be "right" for a referendum on southern autonomy. Many in the UDSF/SSDF suspected that this was another government objective.[249]
After the Khartoum Peace Agreement, the government administratively combined its garrison towns with the rebel hinterland in each of the ten southern ministates delineated in 1994. In the southern state of Unity (al Wihda), or Western Upper Nile, the garrison town of Bentiu was folded in with former rebel territory.
The International Petroleum Company (IPC), a wholly owned subsidiary of Lundin, was granted the Block 5A concession in February 1997, two months prior to the signing of the Khartoum Peace Agreement but ten months after Riek Machar signed the Political Charter with the government. Lundin (IPC)'s operations began in Block 5A in late 1997-early 1998.
Contested Elections and Displacement by the Nuer Militias, 1996-98
The National Islamic Front (NIF) de facto ruling party scheduled gubernatorial elections in all the twenty-six states of Sudan for 1997. This did not really constitute an exercise in democracy. The electorate was extremely limited: only state ministers and others appointed by the central government, in the south less than forty people in each state, were to vote. The government held elections for the ten southern states on the same day in early December 1997. Not all the elections actually took place in the territory of the southern states, because the government did not even control a garrison town in several of them, which were entirely in SPLM/A control. Nor was the nominating process democratic-even though, to the outrage of some NIF members, Riek Machar did not endorse the NIF candidates for governorship, but ran a UDSF slate in opposition in many southern states. The UDSF candidates won several governorships, including that of Western Upper Nile/Unity State.[250]
The alliance dating from 1991 between Paulino Matiep and Riek Machar broke down in armed clashes in September 1997, during the campaign for the governorship of Unity State. Riek Machar's UDSF did not back Paulino Matiep's gubernatorial candidate for Unity State, Nuer NIF member Paul Lily. Riek Machar instead backed his own relative and close advisor Taban Deng Gai. Some Nuer faulted Riek Machar for starting this fight by moving in on what had been acknowledged to be Paulino Matiep's "territory" at the 1994 Nuer reconciliation conference at Akobo, Upper Nile (chaired by Riek Machar), where Paulino Matiep was confirmed as governor of Western Upper Nile.
At first Paulino Matiep responded to this incursion on his power by detaining five UDSF political representatives (who were also commanders) sent by Riek Machar from Khartoum to Bentiu to campaign for Taban Deng. They spent two days in jail on Paulino Matiep's orders in September 1997, before Riek Machar ordered their release.[251] Fighting erupted between the Paulino Matiep and Riek Machar forces days later when the Riek Machar group tried to free other of its members detained by Paulino Matiep.[252]
Civilians interviewed by relief agencies months later reported that Paulino Matiep's forces attacked the trading center of Rupnyagai (border of Block 1), Nhialdiu (Block 5A), and three other villages on September 17, 1997, and looted and burned everything. The 1997 harvest was not completed because of the fighting.[253] Cmdr. Paulino Matiep's forces pushed the Riek Machar SSDF forces back to the Duar area (Block 5A) south of Bentiu.[254]
In October 1997, Cmdr. Paulino Matiep sent a delegation from Khartoum to resolve the situation. Things stayed quiet for a few months. But when his candidate lost the December 1997 gubernatorial election, according to one observer, "Paulino declared war" on Riek Machar's SSDF.[255] Fighting started again. One news article reported that some 200 Nuer fighters were killed in pitched battles in Western Upper Nile/Unity State in January 1998.[256] According to Riek Machar, however, only thirty-eight people died in more than a week of clashes over the governorship of Western Upper Nile/Unity State that month.[257]
Rather than force Paulino Matiep to accept the results of the "election" and rein him in, the government seized on this rivalry for control of Unity State to stoke the fires of ethnic fighting among the Nuer. Sometime before 1998, the government promoted Paulino Matiep to the rank of major general in the Sudanese government army.[258] Maj. Gen. Paulino Matiep announced the formation of his South Sudan Unity Movement/Army (SSUM/A), based in Mankien, in March 1998. He built up his forces with government resources, including weapons and ammunition, and recruitment (forced and voluntary) of Bul Nuer boys and men from his own area. Paulino Matiep had training centers for new recruits in Nhialdiu and Koch. His troops numbered perhaps as many as 10,000.[259]
Since both Paulino Matiep and Riek Machar factions were southern, indeed both Nuer but of different ethnic groups, the government-having exacerbated the situation-publicly characterized the fighting as "tribal clashes," remote from the central government and not controllable by it. The government promoted the myth of the "ungovernable south" sure to plunge into anarchy that would end in a "Rwanda" scenario-without steady oversight from Khartoum.[260] By selectively arming ethnic factions-providing arms and ammunition to a Nuer government militia to fight another Nuer government-armed faction-the government's actions were actually making that scenario more, not less, likely.
Riek Machar appealed in writing to President El Bashir several times in 1998 and 1999 to stop arming Paulino Matiep, who was making war on Machar's forces. Riek Machar even appealed to international oil company executives to pressure the government to remove Paulino Matiep, whom Rick Machar described as "our problem."[261]
PART II: OIL FUELS THE WAR
OIL DEVELOPMENT AND DISPLACEMENT
IN BLOCK 5A, 1996-98
Overview
The situation in the oil concession area known as Block 5A is quite similar to the situation in the GNPOC concession, Blocks 1, 2, and 4, in that they are both oil-rich areas of Western Upper Nile/Unity State and the government has displaced civilians from them to clear the way for foreign oil operations. However, the oil companies investing in the two concessions are different, with one exception, Petronas. The time frame has been different, too. No oil-related forcible civilian population displacement took place in Block 5A until about 1998, when the new consortium led by the Swedish company Lundin started oil exploration there. Indeed, no war-related displacement at all took place there until 1998, according to relief agencies operating out of Ler for a decade.[262]
Unlike its counterpart in Blocks 1, 2, and 4, Lundin's security team at first worked with the local government officials who were Riek Machar loyalists. Lundin hired persons this local government recommended, including some police as security guards for its operations.
In 1998, Paulino Matiep's government-supported militia attacked towns and villages in Block 5A, weakening the position of Riek Machar. Riek Machar's SSDF, although also government-backed, was kept short of arms and supplies by the government and did not have adequate means to defend against the Paulino Matiep attacks. The latter's forces looted most larger villages and towns and burned down the main structures, including clinics run by NGOs. Residents, unused to any fighting in their area, fled to the toic during the wet season to wait out the fighting; many died of malaria there. Most returned home at the beginning of the dry season to salvage what they could and prepare for planting.
Lundin (IPC) Enters the Scene, 1996
Chevron had explored in Block 5A. The Nuer of Block 5A naturally were aware of its activities there. According to one Nuer chief, the company discovered oil in Bang (also known as Darchiem Chuol), four hours northwest of Koch, in 1982.[263] But shortly after the February 1984 rebel killing of three expatriate oil workers, the oil exploration activity ceased.
On February 6, 1997, the International Petroleum Company, a wholly-owned subsidiary of Lundin Oil AB, signed an exploration and production-sharing agreement with the Sudanese government, granting IPC (Lundin) rights to Block 5A, adjacent to and south of Unity oilfield in Block 1.[264] IPC, the operating or lead partner, held 40.375 percent of the Block 5A partnership. Petronas Carigali Overseas Sdn Bhd, owned by the Malaysian state oil company, held 28.5 percent; OMV (Sudan) Exploration GmbH, owned by OMV AG, one of the largest companies in Austria, held 26.125 percent; and Sudapet Limited, owned by the Sudanese government, held 5 percent.[265] Lundin (IPC) also owned 10 percent of Arakis' stock until Arakis was acquired by Talisman in October 1998.
In May 1998, IPC, a Canadian corporation, was folded into its parent, Lundin Oil AB,[266] a Swedish corporation owned by a "well-known name in the oil business, the Geneva-based oil and minerals investor Adolph Lundin and his family."[267] In 2002 a corporate asset shuffle with Talisman occurred, but the Sudan assets of Lundin remained in the control of and under the same family management as before 2002.[268]
The Significance of the GNPOC Pipeline
The development of Block 5A was related to the approaching completion of the oil pipeline facilities nearby in GNPOC's concession.[269] Without the pipeline, the oilfields in Block 5A would have remained as Chevron left them, undeveloped, attracting little military attention. This was an area the government had long ago conceded to the rebels as of no strategic interest and having a particularly difficult, swampy environment; but with the GNPOC pipeline only a short distance away, it became economically feasible to develop oil there. Block 5A shot up in strategic importance and became a military priority for the government.
Lundin's own promotional material stressed the value of the GNPOC pipeline to Block 5A[270]: the GNPOC export pipeline, with its large (100,000 barrels per day) reserve capacities available for third party users, was "the most important technical achievement for the future of the project," which lay approximately seventy-five kilometers southeast of the GNPOC Unity field.[271] Talisman also admitted that the pipeline was necessary to make development of Block 5A feasible, and that on several occasions representatives of Lundin had informally discussed tying production areas in Block 5A into the GNPOC pipeline.[272]
Block 5A Operations in 1998
The most visible early Lundin explorations in Block 5A took place in the toic, in a location the Jagei Nuer know as Ryer, [273] about ten miles west of the Nile and a distance east of Duar. Lundin gave this drilling site the name "Thar Jath"; Thar Jath is a village or port on the Nile not far away.[274]
The consortium also had a seismic operation based on a barge with containers on the Nile, in the vicinity of the port. The headquarters of Lundin's operations in Block 5A were at this port (Thar Jath) southeast of Ryer.According to local sources, the temporary center of these operations in 1998 had been in Guk,[275] with company buildings but no rigs.[276]
Lundin (IPC) sent out staff in October-November 1997, including security consultants from Rappaport, a private security company in London, to set up the operation some seventy-five to one hundred kilometers south of Bentiu, in Block 5A. They intended to start with seismic tests; although they had such data from Chevron, it was fifteen years old.[277] "Seismic acquisition commenced in 1998 and to date [October 2000] over 1,485 kilometres of data have been acquired," according to Lundin.[278]
Lundin had two exploration locations, called "highland" (Ryer/Thar Jath) and "lowland" or "swamp" (barges on or near the Nile). In 1998 and 1999, the oil company cleared a non-tarmacked road from Bentiu to Duar, Guk, and Ryer/Thar Jath. Ryer was forty minutes by car east from Guk over this road, according to a security consultant working for Lundin. He said that they built the road parallel to the old road but did not use the old road because it had been landmined. In 1998, the oil company began to use helicopters, which cut the travel time from Heglig to the Lundin Thar Jath/Ryer location down to one hour from five or six hours, and avoided the danger of landmines.[279] One Nuer observer reported that the government of Sudan put in a military airstrip to defend the oil company at Ryer/Thar Jath.[280]
Lundin and its subcontractors employed some Guk villagers for manual work but, according to one chief, Chinese and Arab workers were brought in "by the hundreds" to replace the Nuer.[281] Chinese subcontractors working for the Lundin consortium reportedly were doing surveys, explorations, and road-building around the Nile, east of Duar and Koch, starting in 1998.[282]
At different times security for this project was provided by practically everyone-the SSDF, local police, the government army, and private consultants-until May 1999, when the SSDF attacked the Ryer/Thar Jath facility.[283]
After the Sudanese government army retook the Ryer/Thar Jath drilling site in May 1999, the rebels never recaptured it. Nevertheless, that location has not produced any oil to date, on account of the war.
Fighting and Displacement of Nuer Communities in Block 5A, May-October 1998
In 1998, as the oil exploration was getting off the ground again in Block 5A, Maj. Gen. Paulino Matiep's government-backed militia pushed the civilians out of the main area of exploration. As his forces swept across Block 5A from north to south, temporarily displacing tens of thousands, there was some fighting with Riek Machar's SSDF (also allied with the government at this time but short on ammunition), but most fighting involved contact with unarmed civilians.
Paulino Matiep and Riek Machar were, on one level, continuing their struggle for the governorship of Unity State. At the bottom, however, the fight concerned whether Riek Machar's group would share in the rewards of the concession through providing security for oil companies working in oil-rich Block 5A.
The UDSF/SSDF was determined not to be passed over as it had been with Blocks 1 and 2.[284] Lundin's own mixed security service included guards selected by Khartoum and police from Bentiu (UDSF/SSDF). Lundin also had its own expatriate security consultants.
But the army and the Sudanese government's minister of mining in Khartoum were not happy with Lundin's association with the UDSF Unity State government, according to the governor.[285] It seemed that powerful persons in the central government and armed forces wanted forces under their direct control to be the exclusive security provider for all oil operations.[286] Khartoum's definition of security, as demonstrated later, was an extensive cordon sanitaire, cleared of all civilians, stretching for kilometers beyond each oil rig, oil road, and piece of equipment. Riek Machar's definition of security was to leave his constituents in their homes and provide local police with their ears to the ground to guard against attacks. Riek Machar lost this battle. The northern government used the Lundin presence on the ground as a platform on which to build its first military toehold in the oilfields south of Bentiu.
Government Depopulates Block 5A, 1998
After a Chinese subcontractor installed a large compound in Ryer/Thar Jath in 1998 and moved in its employees, the people living in the area were told to move by Maj. Gen. Paulino Matiep, who gave this message to the chiefs. As one of them reported, Paulino Matiep gave no reason other than that the oil "operations were going to be here so you have to go away, the cows will destroy everything."[287] Everyone left the Ryer/Thar Jath area and Paulino Matiep's men tore down or burned all but two houses, according to the same Nuer chief. Those who moved received no assistance with trucks or tents and no compensation of any kind. Maj. Gen. Paulino Matiep gave them only a brief time to leave, then burned the houses. The people were allowed to take only their cows, the chief said.
While a devastating famine among the Dinka in Bahr El Ghazal to the west was gripping the attention of relief agencies in Sudan in mid-1998, Maj. Gen. Paulino Matiep turned his Bul Nuer militia on Riek Machar's SSDF troops and on civilians, looting and engaging in scorched earth warfare. According to relief agency records, Paulino Matiep's militia attacked Nhialdiu (south of Rupnyagai) and two other villages in February 25, 1998. In April 1998 six other villages in the Nhialdiu area were burned and looted. This attack occurred before the May 7, 1998 NGO assessment was to take place in two villages to the west and south of Nhialdiu. The NGO assessment recorded these fact, and noted that the health center in Nhialdiu was looted, burned, and destroyed, along with all its health records.[288]
This fighting took place away from the Bul Nuer home area, and as described below much occurred where Lundin intended to drill and where Chevron had earlier explored, down into Ler and Adok, the Dok Nuer area. Bul Nuer, according to one Nuer chief, did not traditionally fight the Dok Nuer, except when women were raped or disputes arose between families. Yet the government continually attempted to pass off this fighting between Paulino Matiep and Riek Machar as "traditional tribal fighting," which the chiefs insisted it was not.[289]
The raids and looting continued. On June 27, 1998, , the civilians fled a Maj. Gen. Paulino Matiep attack on Duar town, a Jagei Nuer area. Paulino Matiep's forces burned the compound of the medical NGO Médecins Sans Frontières (MSF), the building housing the local authority (called the parish), and the school (assisted by UNICEF). The soldiers followed this pattern-looting and burning the important structures-in all Jagei Nuer locations, observed a local relief official. Maj. Gen. Paulino Matiep's troops raided three big Jagei cattle camps, taking all the cattle they found in the camps. They killed goats and cows for food; they stripped captured women of their clothes.[290] The WFP calculated that about 25 percent of the original population of Duar moved out of the area following this fighting and these attacks, some to islands in the Nile river,[291] thought safe because they were inaccessible.
Even oil company workers were not exempt: one night, Maj. Gen. Paulino Matiep's men ambushed one of Lundin's trucks and took prisoner the four Sudanese employees in it. Two escaped and two were summarily executed. The police found their bodies the next day: they had been stripped, bound, gagged, and shot in the back of the head. It appeared that Paulino Matiep's men had been looking for the two, who were "from the wrong tribe."[292]
People displaced from Koch, another Jagei Nuer area, said Paulino Matiep's forces attacked the area three times in 1998. In Koch, the troops burned churches, and in the surrounding villages they destroyed an estimated fifty small chapels, both Catholic and Presbyterian, four clinics, five schools, and six local government posts (called stations). This destruction began on or about June 28, 1998.
Some civilians fled just once, and stayed away during the wet season, from June to December 1998, in the toic not far from their homes. Families split up. Some family members, particularly the elderly, children, and adolescents, remained behind; in one family in the village of Patit, five to ten-year-old children were left in hiding with their grandmother, who was too old to move. Young men fled to avoid forced recruitment. Many young women, afraid of abduction and rape by Paulino Matiep's soldiers, ran into hiding.[293]
Government Army and Paulino Matiep Militia in Ler, 1998
In early 1998, the government sent its troops south into Riek Machar's home area in Ler. Up to that time Ler town had been untouched by the war and by combat, except for one instance in 1992.[294] A large brick hospital built by the British prior to independence still provided facilities for medical teams; MSF-Holland had worked in the region since 1988.[295]Everything south of the government garrison town of Bentiu, including the towns of Duar, Koch, and Ler, had been abandoned or lost by the government to rebel forces by 1986. Riek Machar had about 9,000 troops in this area of Western Upper Nile/Unity State.
An officer present in Ler town in April 1998 reported that he and Cmdr. Peter Paar Jiek of the SSDF heard at the last minute that a company of "Arab" (government) soldiers were on their way to Ler from Bentiu. On April 20, 1998, the SSDF forces intercepted the government army company (about eighty soldiers) three hours north of Ler, in Koch.[296] The northern army contingent, asked for written orders, could produce nothing but claimed that UDSF Unity State Gov. Taban Deng had cleared the troop movement and had assigned them a seventy-person SSDF escort. They said they were going to Ler in order to receive and guard a visit by President Omar El Bashir on April 21, 1978, the one-year anniversary of the signing of the Khartoum Peace Agreement.[297]
Around the same time some fifteen Sudanese government troops arrived at Lundin's "highland" location, Ryer/Thar Jath, where Lundin was readying to drill for oil. The soldiers demanded fuel to get to Ler so that they could protect President Bashir for his visit. The army contingent brought four-ton trucks and pickups with 50 mm canons. Lundin's security consultants gave them half a drum of diesel for their trucks to be rid of them.[298]
When government soldiers and trucks full of weapons arrived near Ler, the SSDF commanders assigned them an exposed place outside Ler town, in Payak (this since became the location of the military garrison and airstrip); they would not let the army occupy the Ler school as requested.[299]
President Bashir did not arrive in Ler on April 21, 1998, nor ever. Nor did Governor Taban Deng or Riek Machar arrive on that day.[300] The local SSDF commander then asked the government troops to leave Ler, but the second lieutenant in charge refused. According to one SSDF commander, "[t]hey tricked us: they said Omar Bashir wanted to visit Ler. . . . Our forces told them to go back to Bentiu and they refused."[301] Meanwhile, the local SSDF kept these northern troops under tight control. They would not let them deploy their guns, unload weapons from the trucks, go to the market, or mix with local women. The government soldiers were outnumbered and afraid. They radioed their commanders that they had been captured.[302]
SSDF Cmdr. Tito Biel then arrived with two northern army officers and said that the government soldiers could stay in Ler. He said that Gov. Taban Deng had promised they would be there only for the celebration of the signing of the Khartoum Peace Agreement.[303]
The local SSDF set a deadline for the government soldiers to pull out: ten days from April 27, 1998. The soldiers did not meet that deadline. They never left Ler, although for the first year they did not move from Payak, where they created an airstrip and a garrison. Upon noticing that northern troops would bring additional soldiers back with them when they were allowed to go to Bentiu for rations, the local SSDF forbade this, and the number of government soldiers was reduced back to seventy.[304] The army contingent, however, was strategically positioned to shelter and resupply General Paulino Matiep in his attacks on Ler that started two months later.
The SSDF regarded the location of Sudanese government troops in Ler as "a clear violation of the Khartoum Peace Agreement,"[305] under which the army's movement was to be restricted and coordinated by a joint military technical committee from Khartoum and the SSDF. But none of the military committees envisaged in the Peace Agreement had been established, according to the SSDF: "Not even a ceasefire committee was formed. Nothing was done regarding security arrangements as promised in the Peace Agreement."[306]
Ler town was attacked and captured three times in 1998 by Maj. Gen. Paulino Matiep's government forces, in June, July, and August, with considerable damage to the infrastructure, as well as burning and looting of homes. By July 1998, 250 houses, fifty shops, and 2,500 cattle compounds had been destroyed in Ler town, according to a government-run newspaper quoted by Associated Press.[307] Paulino Matiep's soldiers burned the roof of the large brick hospital (built by the British and run by MSF). They looted the hospital and NGO compounds. They burned the Catholic church and its grinding machine. A witness saw them put grass over an NGO car and set it on fire. The Paulino Matiep forces demolished seven permanent buildings and used fuel canisters, rocket-propelled grenades (RPGs), and 60mm mortars to burn down the market.[308] They also destroyed Riek Machar's brick house in Ler, according to a relief coordinator.[309]
A chief who stayed in Ler until his house was burned said of Maj. Gen. Paulino Matiep's soldiers:
They are Nuers like us. I saw them burn Ler. We know all their names. They were once with us, part of the SSIM [Riek Machar forces 1994-97], before. The reason why they have occupied our land is they do not want peace between Riek [Machar] and the jallaba [northerners], or peace between the Nuer and Dinka. The only government they know is the Khartoum government.[310]
The civilians fled rapidly while the attackers were looting and there was not a great loss of life. Paulino Matiep's government forces in Ler reportedly killed an old man, Amilo Chuol. A witness who saw the body, wearing a UNICEF water services uniform, said that he apparently had been shot in the back as he was fleeing. The bullet had pierced through his lungs and he had fallen on his face. Another observer saw the body a few days later, still face down.[311]
The SSDF, chronically short of ammunition, evacuated Ler, while the government soldiers stayed in their garrison. Maj. Gen. Paulino Matiep's forces did not remain in the area but withdrew after a few days of plundering and burning;[312] they looted the nongovernmental organizations of property such as generators, some of which were reportedly given to the garrisoned government soldiers to make their Payak barracks more comfortable.[313] The Paulino Matiep militia abducted women and girls, according to an Adok chief.[314]
Because of the fighting and destruction, and despite the need, relief agencies had to pull out of the Western Upper Nile/Unity State region on June 29, 1998.[315] An Operation Lifeline Sudan (OLS) security officer and several NGO representatives, who visited Ler on July 6, 1998 to inspect the damage to the NGO and U.N. compounds, confirmed that all had been looted and burned.[316] A relief worker observed that the Sudanese government sent Antonov aircraft carrying soldiers, weapons, and ammunition to Ler after the June fighting began. The government cargo aircraft came in two rotations with reinforcements after the SSDF fled the town.[317]
Lundin's security consultants had been accustomed to driving to Ler, where they made friends with some of the NGOs. They had supplied one medical NGO in Ler with gas for its refrigerators. Later, they returned to Ler and saw that the NGO facility had been destroyed and abandoned, and the Ler hospital had been razed to the ground. Similar destruction was evident in the other larger towns, including Duar. Many smaller villages had been abandoned.[318] A Sudanese relief worker estimated that fifty-nine villages outside Ler had been burned and looted; soldiers had forced women and girls to be porters, sometimes stripping them of clothing.[319]
With little delay, Riek Machar denounced Maj. Gen. Paulino Matiep's attack on SSDF forces in Ler and elsewhere,[320] describing the fighting as "fierce."[321] A Paulino Matiep spokesman claimed that Maj. Gen. Paulino Matiep had agreed to a ceasefire that Riek Machar had broken by preemptively attacking Paulino Matiep's forces at a camp near Bentiu; the attack, he said, had been repelled.[322] The spokesman denied that Paulino Matiep's forces had burned villages or caused loss of life.[323]
The SSDF later claimed that it had made a point of fighting against Maj. Gen. Paulino Matiep, but not against the government troops, out of a desire to maintain the 1997 Khartoum Peace Agreement. Paulino Matiep himself described the fighting as a disagreement between him and Riek Machar over the military leadership of the SSDF.[324] The Sudanese government sent a fact-finding mission to Western Upper Nile/Unity State in early July 1998 to investigate what it referred to as "clashes" between Maj. Gen. Paulino Matiep's forces and Riek Machar's SSDF. The delegation attributed the attacks strictly to southern rivalries, even though it found "vast damage was inflicted on government installations and development projects while 49 people have been killed."[325]
Yet the army garrison at Ler (Payak) had acquiesced in the assault, noted by witnesses who spoke to Human Rights Watch. Although the fighting was going on near their base, the Sudanese army made no move to intervene or stop the fighting. It was the war of their ally Paulino Matiep, and they benefited from Paulino Matiep's actions. One chief from Ler observed that the cattle stolen by Paulino Matiep's troops were kept in the army garrison,[326] and another chief reported, "When we were defeated, the government of Sudan soldiers found our cows, goats, and furniture when they were burning the houses. They brought these goods to the base. They [the army soldiers] profited from the fighting in 1998, and they did not even fight![327]
Maj. Gen. Paulino Matiep again attacked Ler on July 16, after many residents had returned and the WFP had arrived to distribute food. Two WFP workers had to flee the July 16 attack, wading waist-deep through mosquito-infested swamps at night, guided by members of the local community. They were evacuated to safety by OLS on the morning of July 17.[328]
The Sudanese government announced on July 21, 1998, that Paulino Matiep and Riek Machar had agreed on a "cessation of hostilities" and had pledged not to fight each other.[329] Some civilians who evacuated Ler on July 4 returned after July 26 when Maj. Gen. Paulino Matiep's forces pulled out. The wet season was well under way.
But Maj. Gen. Paulino Matiep's government-backed forces attacked Ler yet again in August, for the third time that year, despite the ceasefire. People reported abductions and random killings of livestock. "The Matiep troops had finished off all the goats in the area in three months," one young man complained. "It began with the bulls. They ate from them until the evacuation and took some as loot. They cut down crops for passage as they crossed, leaving." The older boys, taken previously for heavy portering, had gone into hiding. Maj. Gen. Paulino Matiep's troops therefore pursued others to serve as porters-boys as young as nine or ten, who had stayed behind because they thought they were safe.[330]
Conditions in the toic, where the civilians hid, were miserable during the wet season; it rained heavily and malaria-carrying mosquitoes thrived. The displaced often had to sleep on woven grass mats floating on the water. There was not enough food for everyone. One woman, who went into hiding in the toic that year with twenty family members, came out with fifteen: five died in the toic, three adults and two children.[331] The civilians did not rebuild houses in Ler because they feared Maj. Gen. Paulino Matiep's forces would burn them again. Instead, they settled for less rain-resistant coverings under the trees.
On October 12, 1998, the SSDF attacked Paulino Matiep's forces in Nhialdiu, "killing a good number [before they] fled across the river to a place six hours from Nhialdiu." Then Maj. Gen. Paulino Matiep declared peace, which lasted from October 12, 1998 until May 1999.[332]
Relief Agencies Note Forced Displacement and Devastation in Western Upper Nile, 1998
Witness accounts of the forced displacements were borne out by the reports of relief agencies. The WFP reported that the fighting around Nhialdiu, which it said lasted from June 1997 to November 1998, displaced around 70 percent of the Nhialdiu community, who went to Bentiu and Mankien. After the hostilities diminished, some returned to Nhialdiu, joined there by displaced persons from other areas.[333]
U.N. and private relief agencies also issued appeals and press releases to bring attention to the acute situation in the oilfield areas of Western Upper Nile/Unity State. On May 1, 1998, Oxfam announced that it was setting up an emergency program in that state "to respond to 25,000 displaced people through insecurity."[334]
On May 5, 1998, CARE, which worked in the government garrison towns of Bentiu and Mayom, reported that "20,000 Sudanese have fled the war-wracked towns of Unity State in Southern Sudan." According to CARE, Unity State had "been the center of fighting between rival factions of the South Sudan Independence Movement [Riek Machar forces]," while "[g]overnment-controlled Bentiu, Mayoum and Rubkona are mostly inaccessible to aid workers providing relief in the South."[335] On May 13, the Canadian International Development Agency (CIDA) announced that it was sending emergency aid to assist famine victims in Sudan, while the government would "continue to put pressure on all parties to achieve a negotiated settlement."[336]
On July 7, 1998, MSF-Holland declared in a press release that insecurity in Western Upper Nile/Unity State was seriously hampering the delivery of urgently needed food assistance. The fighting had forced MSF, the WFP, and other humanitarian agencies to evacuate the area, and looting of compounds by government soldiers had forced the shutdown of key programs, including the MSF hospital in Ler,[337] bringing MSF's kala azar, tuberculosis, and mobile clinics there to a halt.[338] Subsequently, the government of Sudan reported increased cases of kala azar, particularly in the endemic areas of government-held Mayom and Pariang.[339]
On July 10, 1998, the WFP made a special appeal to the "international community to take urgent measures and do everything it can to persuade all the combatants to put down their weapons and end this senseless suffering" in Western Upper Nile/Unity State. It said the fighting was preventing delivery of badly-needed food to thousands of people and in many areas it was so constant that WFP could not even gain access to assess how many people might be in need of food.[340] Fighting did not subside until a few months later.
The OLS reported in late July 1998 that Western Upper Nile/Unity State "experienced pre-famine conditions, in almost all cases as a result of military activity."[341] In Western Upper Nile/Unity State, the OLS warned, "where intra-factional fighting caused constant displacement, global malnutrition rates reached as high as 40 percent at mid-year."[342]
In December 1998, the WFP delivered the first food in more than four months to tens of thousands of hungry Sudanese in Ler and Mankien. A WFP representative observed:
Over the past months thousands of people have fled without food or belongings. They've been forced to hide for days at a time in the surrounding swamps and outlying villages, living in constant fear and surviving on just water lilies [a wild food] and fish. Their own villages have been burned down and their grain stores have been looted.[343]
The WFP said that Ler, once a hub for food and health services, "is now a ghost town." Although some residents were returning, they feared future attacks. The WFP confirmed that "militia factions have raided Ler three times since June [1998], looting and burning homes and destroying schools, a hospital and clinic. Crops have been trampled, burned and eaten by the raiders. Renegade forces have also stolen and slaughtered thousands of cattle." The WFP estimated that the fighting forces had stolen a total of 24,000 cattle, leaving families with no assets to trade or slaughter. The salvaged grain had been shared with others and was almost entirely depleted.[344]
The initial U.N. appeal for emergency funding for Sudan in 1998 anticipated that in Western Upper Nile/Unity State it would need to provide relief food for "27,290 displaced and war-affected beneficiaries during the hunger gap period from April to July."[345] Following the destruction and displacement caused by government and Paulino Matiep's militia's attacks on villages of the Leek, Jagei, and Dok Nuer, the appeal was revised upward and called for relief food to 151,850 beneficiaries in Western Upper Nile/Unity State,[346] more than five times the number of beneficiaries initially projected.
The United Nations Office for the Coordination of Humanitarian Affairs (OCHA) classified Western Upper Nile/Unity State as one of two "areas of acute emergency" in all of Sudan, the worst classification possible.[347] The other area was Bahr El Ghazal, where famine struck almost a million people that year.[348] And it was the area of Unity/Upper Nile/Jonglei that topped the list for more OLS personnel evacuated due to fighting than anywhere else in 1998. As a result, by the end of 1998, humanitarian coverage in this region was the lowest of all major OLS areas.[349]
This time of "acute emergency" was the very time Talisman was reviewing the possibility of becoming lead partner in GNPOC, which concession included Mayom, Bentiu, Rubkona, and Mankien, all affected by the displacement, disruption, and hunger caused by the fighting-funded on both sides by the government.
THE WUNLIT NUER-DINKA RECONCILIATION PROCESS, 1999
Overview
The resolve of the Sudanese government against sharing power with southerners was hardened by the novel civilian peace and reconciliation conference held in Wunlit, Bahr El Ghazal, under the auspices of the New Sudan Council of Churches (NSCC) in February-March 1999.[350] At Wunlit, the Nuer of the West Bank of the Nile agreed with their West Bank Dinka cousins to make peace and end that part of the south-south conflict, underway since the SPLA split in 1991.
Coincidentally, the Nuer of the West Bank attending the Wunlit conference were the Nuer from Blocks 1 and 2 (Leek ) and Blocks 5A (Jagei, Jikany, Dok) and 5B (Dok and Nyuong). The only West Bank Nuer who did not participate in the conference were the Bul Nuer, with minor exceptions.
Although the fighting forces prevailing in the territory of these Nuer and Dinka (SPLA and SSDF) did not end their military and political rivalry right away, the border war between the West Bank Nuer and Dinka ended at Wunlit, at civilian initiative. The civilians agreed to no more cattle raids, destruction of villages, abductions of women and children, or calling in their armed brethren to defend (and escalate) disputes. They covenanted that they would make sure that their people kept to the bargain, through pressure from the grassroots leaders, chiefs, and Christian and traditional spiritual leaders.
This was the Sudanese government's worst nightmare: its political strategy, which had been so successful in gaining access to the southern oilfields, was to divide southerners from each other and displace them from the oilfields for the benefit of northern Sudanese and foreign oil developers. But though the Nuer-Dinka break was partially mended, there remained many other targets for "divide and displace" strategies, chief among them the Nuer themselves.
The West Bank Nuer/Dinka People-to-People Peace and Reconciliation Conference, February-March 1999
Purpose of the Wunlit Conference
The successful Nuer-Dinka West Bank (of the Nile) peace and reconciliation conference held in Wunlit, Bahr El Ghazal, on February 27-March 8, 1999, manifested an idea whose time had come. The decision to hold it was unrelated to the development of the oilfields; indeed, it was held months before the completion of the pipeline and export of oil. Political and military geography in this case overlapped with petroleum geology: the Sudanese government was focused on stirring up ethnic divisions, especially where there was oil to be had. The Nuer from the Western Upper Nile oilfields had been stirred up against their Dinka neighbors, and peace between them eventually spilled back to the oilfields.
Taban Deng, then UDSF/Riek Machar governor of Unity State, summarized the UDSF/SSDF understanding of the reconciliation conference:
The original thinking about Wunlit was that it was useless for Nuer and Dinka to go on killing each other. This was not a conspiracy against the government of Sudan, but we decided there would be no more Nuer/Dinka fighting. Khartoum claimed this was a conspiracy against the government organized by American churches. . . . The government of Sudan thought that it could use the Nuer to destroy the SPLA. But we have to take care of what is in the interest of the whole south. For that we are termed separatists, Garang loyalists [by the government].[351]
Looking at Wunlit from the distance of Khartoum, Riek Machar possibly saw an opportunity to prove to the government that he and the UDSF still had a vital role to play. There was always the hope that the government would see the value of living up to the Khartoum Peace Agreement and awarding southerners, or some of them, a fair share of the oil revenues and benefits. The alternative threatened at Wunlit was a united south-united against the government. Hence, Riek Machar played a double or ambivalent role, supporting the meeting at Wunlit while hoping to benefit politically from the threat it posed to the government.
Riek Machar was walking a tightrope by supporting the Wunlit south-south reconciliation process so deeply distrusted by the Khartoum government-while at the same time insisting that his southern forces, not Khartoum's army, had the right to control the southern oilfields. He negotiated this tightrope by, for instance, telling the government that the conference was going to be held, but not identifying its correct location. The organizers and participants feared the government would bomb the site and so maintained a press blackout on the location and the event until it was over.[352]
Relationships between the top leaders of the SPLM/A and the SSDF, John Garang and Riek Machar, were bad. The two had been in open warfare since 1991. Efforts at reconciliation at this level had proved fruitless. Riek Machar made an open deal with the government in 1996 rather than rejoin the SPLM/A under Colonel Garang. The people-to-people movement that took off at Wunlit was designed to sidestep these "top dog" or "big man" personality clashes. This movement sought to make peace between neighbors, regardless of whether the top leaders were able or even wanted to reconcile. The movement was responding to the impasse at the top of southern leadership that had permitted the Dinka-Nuer border war to drag on and on, with increasing casualties, abductions, stolen cattle, abandoned and destroyed villages, displacement, and poverty.
One Nuer chief elsewhere expressed the view of many southerners, that the war between Nuer and Dinka was not a traditional conflict but a new type of war: the war of the educated elite, or "the war of the doctors," namely Dr. John Garang (agronomy) and Dr. Riek Machar (mechanical engineering):
They used to tell us that the reason why Nuer and Dinka fight each other was because we are ignorant. We don't know anything because we are not educated. But now look at all this killing! This war between the Nuer and Dinka is much worse than anything we experienced in the past. And it is the war of [the] educated [elite]-it is not our war at all![353]
As one Dinka former SPLA soldier said to another anthropologist, the Riek Machar-Garang power struggle was cloaked in the rhetoric of "groups under attack" in order to convince ordinary people to join the fighting:
Just imagine Riek or Garang going to their respective tribes to talk the Nuer and Dinka civilians into fighting one another so that Riek or Garang becomes the leader of South Sudan, do you think anybody would go to war? We don't care about their political careers, at least not to the extent of killing ourselves. They know this, and that is why they have to make it sound as if tribal wealth was under threat from the rival tribe in order to persuade the people to wage war.[354]
By the time their chiefs first met for reconciliation, in June 1998, there had been more serious clashes between the West Bank Nuer and Dinka than between the Riek Machar and Paulino Matiep Nuer factions-the burning of Ler did not occur until late June 1998-or the Nuer and the government. The Nuer-Dinka cattle raiding and fighting had been transformed from customary raids to military attacks upon the civilian support base of the "other" ethnicity by involvement of the SPLA soldiers (on behalf of their Dinka kin) and of Riek Machar's forces (for the Nuer).
Participants at the Wunlit Conference
The Wunlit conference did not include all Dinka and Nuer: large numbers of both lived on the East Bank of the Nile and elsewhere, but their complex relations were scheduled to be taken up after the resolution of Nile West Bank differences.[355] For the process to take place, however, the people on the ground had to be committed to it; where one side was not committed to resolving differences, meetings sponsored by the NSCC could not work and would not be held.
The Nile West Bank came first because the chiefs and local leaders had responded with more readiness to the initial peace feelers by the churches. Eight chiefs, Dinka and Nuer of the West Bank, met in the presence of church facilitators and foreign observers in Lokichokkio, Kenya on June 3-11,1998, for a small people-to-people reconciliation conference. They concluded that a larger reconciliation conference should be held inside the south, where the greatest number of affected people could participate.[356]
An area in Bahr El Ghazal under SPLM/A control seemed most likely to provide adequate security for all concerned. The organizers chose Wunlit, in Tonj County, Bahr El Ghazal, which was in Dinka territory but near the disputed Nuer/Dinka West Bank border. The Dinka represented at Wunlit were those whose counties bordered on Nuer territory on the West Bank, including Gogrial, Rumbek, Tonj, Twic, and Yirol counties.[357]
The Nuer represented at Wunlit included the Leek, Jikany (Western), Jagei, Dok, Nyuong, and a few Bul Nuer. (Maps C and D) The Bul Nuer, who shared a border with Bahr El Ghazal's Twic Dinka population, were invited to Wunlit, but because they were allied with Maj. Gen. Paulino Matiep at the time, only the Bul Nuer of Cmdr. Philip Bapiny's group (which had left Paulino Matiep and joined the SPLM/A several months before) attended.[358] Due to logistical problems, the Bul Nuer representatives came on foot, as the conference was adjourning, bringing with them a Dinka prisoner to free as a sign of good faith.[359]
The word of possible peace was excitedly spreading in the south because of confidence-building measures between the traditional leaders of the West Bank Dinka and Nuer, following the Lokichokkio meeting in June 1998. The NSCC arranged and funded special flights to take chiefs on visits to each others' territory. This NSCC ability to fund flights through access to international donations was crucial to the months' long confidence-building process, because transport on foot (the alternative) was dangerous, time-consuming, and for elderly chiefs not even possible.
The chiefs on both sides returned home with glowing tales of how their former enemies had welcomed them with respect, slaughtering bulls for them. Both Nuer and Dinka tried to outdo each other in hospitality: some visiting chiefs were carried aloft by a welcolming crowd from the plane, as women trilled traditional greetings and bulls were slaughtered at the airstrip for them to step across. As one chief remarked: "They washed my feet. Even my wife does not wash my feet!"[360] The chiefs exchanged pledges of security.
Riek Machar sent a political/military UDSF/SSDF delegation from Khartoum to the conference, a surprise to the organizers, who had sought Riek Machar's approval for West Bank Nuer to attend but had not invited him.[361] The Wunlit organizers refused to let the UDSF/SSDF delegation address the conference, on the grounds that it was a people-to-people conference only, and that the SPLM/A was neither attending nor invited, except for opening and closing remarks by the regional commander and the governor. The UDSF/SSDF delegation, however, was permitted to attend as observers. The members of the delegation sat up front, listening to what the Dinka and Nuer representatives had to tell each other about past misdeeds and the need to stop draining their populations in continual fratricidal conflict. The UDSF/SSDF leaders also circulated among the chiefs and others, renewing old acquaintances.
Presuming, as did the Sudanese government, that the hand of the SPLM/A was behind the conference, a UDSF member remarked: "What does Garang want? We want a program."[362] The political delegation was surprised again to find out this was not a Garang-planned conference. He, like Riek Machar, faced a grassroots movement that he had not created.
The SPLM/A had a minimal presence at the conference. SPLA Bahr El Ghazal commander Salva Kiir and the SPLM/A-appointed governor of the state, Nhial Deng Nhial, left after greeting the delegates and did not return until the closing ceremony. SPLA Cmdr. James Ajongo Mawut, whose headquarters comprised a couple of huts some twenty minutes from Wunlit, oversaw the protection of the gathering.[363]
Proceedings and Resolutions at the Wunlit Conference
The conference opened out of doors in multifaith style, with Dinka and Nuer spiritual leaders, masters of the fishing spear (Dinka) and earth masters (Nuer), forming in a big circle around a tethered white ox, Mabior (Dinka and Nuer for "white ox"), chanting their desire for him to take away all the bad blood between Nuer and Dinka. Then the ox, which fiercely resisted, was slaughtered in the traditional (Dinka) manner, horns wrestled to the ground by young men, and throat cut with a knife. Throughout the conference, Mabior and his sacrifice were referred to by the participants.[364] Inside the specially-built long hall of mud and thatch deemed necessary for the important meeting, a Christian pastor gave a long benediction.
Following the format of the earlier reconciliation conference in June 1998, the representatives of the bordering Nuer and Dinka counties were given the opportunity to vent all their grievances against each other. Each county had an hour and a half for its three representatives to speak. Under the rules, no one could interrupt the speaker. They all had to listen and try to understand the hurt that they had caused each other during the eight years of cross-border raiding, looting, and killing.
Next, the conference broke down into groups that would work on resolutions addressing the problems identified. The list of issues to be tackled illustrated how much harm had been done. One working group dealt with the all-important issue of cattle raiding; central to both Dinka and Nuer societies for nutrition, social relations, and trade, cattle remained the primary form of wealth. Another working group addressed resettlement of more than one hundred villages on the Nuer-Dinka border that had been abandoned due to raiding and insecurity. Those villages, it was decided, would be repopulated and rebuilt.[365] Another group addressed the problem of abducted women and children, working out procedures consistent with customary law to return the abductees or regularize the marriages of those previously unmarried women who freely (in front of their relatives) chose to remain with their abductor-husbands. This was to apply also to unmarried women who had been abducted by Nuer or Dinka rebel soldiers, including those whose abduction may have been carried out to avoid payment of the bridewealth.[366] Other working groups dealt with sharing of grazing lands and resumption of trade. These were some of the first resolutions to be implemented.
The resolutions passed at the conference were ceremonially signed by the participants, including female delegates, an important gain for women's participation in local government. In the weeks that ensued, events moved swiftly as the delegates returned home to inform their people of the agreements. Quickly, trade resumed: reportedly five to six thousand Dinka traders from the Yirol area, portering goods for sale on their heads, journeyed to Nyal and Ganyliel in Nuerland to restore trading relations. Food monitors then noted the product of that commerce: many cattle began to be sold from Western Upper Nile/Unity State through Dinkaland to Uganda later in 1999.[367]
Following Wunlit, pastures were formally consecrated for joint use, and Nuer and Dinka cattle were put to graze together. Many people returned temporarily to their abandoned villages well ahead of supplies needed to rebuild them. Planting would start with the rains in May, only two months after Wunlit ended, if the returnees had the seeds.
As promised, the NSCC in September 1999 held a follow-up conference to create a civilian governance structure that would make sure that the commitments of Wunlit were put into practice. Those attending that conference had been chosen by their communities to represent them, instead of being appointed from higher up; there, too, women took part, with the requirement that one of the three delegates from each county be a woman.
A watershed for southerners, the Wunlit conference ended some of the south-south fighting which had destroyed hundreds of villages and killed perhaps thousands of civilians from 1991 to 1999.[368] It gave many southerners hope that there was a way to surmount the conflict that had cost them so dearly.
OIL SUCCESSES FOR GOVERNMENT DESPITE REBEL MILITARY OPPOSITION: TALISMAN STEPS IN, 1998-99
Overview
In mid-1998, while the militia of Maj. Gen. Paulino Matiep was burning Duar, Koch, Boaw, and Ler villages and looting relief organizations in the oilfields of Block 5A, Talisman, the largest independent Canadian oil and gas exploration and production company, investigated the adjacent GNPOC concession and decided to invest. The deal by which Talisman bought out Arakis was completed in October 1998.
To the Sudanese government, it must have seemed in 1999 that its luck was finally changing. The pipeline was completed on schedule and inaugurated in May 1999, with great fanfare. An oil refinery for local use of Sudan's crude oil was completed near Khartoum, and inaugurated on the tenth anniversary of the NIF's coming to power, June 30, 1999. The first export of crude oil from Sudan took place on August 30, 1999, almost the same day the IMF lifted its nine-year suspension of Sudan.
Then the world price of crude oil began to rise, and rise, until it more than doubled, as Talisman continued to locate and drill new wells in its concession, generating even more government revenue.
Yet there were still some discordant notes. The first incident of pipeline sabotage occurred two weeks after the first export of oil. More importantly, in early 1999 the dispute-between the Sudanese government and its ministry of defense, and Riek Machar and his ex-rebel SSDF-over who would guard the Block 5A oilfields being explored by Lundin came to a head. Riek Machar opposed any army presence, insisting that Block 5A was in territory he brought to the government in 1997 under the Khartoum Peace Agreement and that his forces would and could protect Lundin's concession. He did not want a repeat of the situation in GNPOC areas, where his forces, military and political, were not allowed even a minor role, despite the peace agreement.
The government was also actively peeling away commanders from Riek Machar's SSDF; by directly arming and funding them it cut away Riek Machar's authority over them. The proliferation of ethnic locally-based militias, armed by the government to "protect" their areas from the SPLA, was not limited to Paulino Matiep's forces. Various militias, including from the Dinka, Murle, Toposa, and Mandari, had been directly armed as well, most under illiterate commanders. Many were reactive to early SPLA human rights abuses of their civilian population although they also committed serious abuses.
Since the government of Sudan had already seen some southern militias redefect to the SPLM/A, most spectacularly the Dinka commander, Kerubino Kwanyin Bol in January 1998,[369] it put greater faith in the army, reportedly dominated by northern officers, and non-southern militias, such as the Baggara muraheleen and the Popular Defence Force (PDF)-an Islamist force also called mujahedeen (holy warriors).
Talisman Becomes New Lead Partner for Blocks 1, 2, and 4, Mid-1998
Although Arakis had been in Sudan since 1992, by mid-1998 it had relatively little to show for it. The Sudanese oil industry remained in rudimentary form, producing limited amounts for local consumption. The country still imported most of its petroleum needs. A government-controlled newspaper, Al Anbaa, said that Heglig oil wells produced 2.5 million barrels of oil in one year, from June 1997 to July 1998-only 6,849 barrels per day (b/d).[370] Another oilfield near Heglig, Abu Jebra, came on stream in December 1992 and up until July 1998 produced 471,629 barrels of oil in total, an average of 173 b/d. After Talisman arrived, the 2000 production from the GNPOC concession soared to 200,000 b/d.[371]
In mid-1998, the British Columbia Securities Commission had reprimanded and fined the former chief executive officer of Arakis, James Terrence Alexander, and fined Arakis as well, for breaches of regulatory norms in 1995[372] and the company was unable to raise the U.S. $ 250 million required for its share of the Sudan venture. It suffered from a poor cash flow, low per share prices, and the threat of a takeover by a rival, Lundin, which had acquired a 10.8 percent share of Arakis.[373] On July 16, 1998, Arakis threw in the towel and announced that it planned to put itself up for sale.[374]
A month later, on August 17, 1998, Canada's largest independent oil and gas producer, Talisman Energy Incorporated, announced that it would acquire Arakis and Arakis' main asset, the Sudan project.[375] One analyst suggested that among Talisman's considerations may have been that it had no gas stations vulnerable to boycotts and therefore could "afford to go where better-known oil companies dare not invest because of the risk of bad publicity." In addition, it faced no competition from U.S. companies due to the United States embargo on U.S. companies doing business with Sudan.[376]
Three days after the takeover announcement, on August 20, 1998, the U.S. government launched cruise missile attacks against locations in Khartoum, Sudan and Afghanistan.[377] Persons at those locations were believed to have assisted or been associated with those who had bombed the U.S. embassies in Nairobi, Kenya, and Dar es Salaam, Tanzania, on August 7, 1998, killing several hundred people, mostly Kenyan and Tanzanian nationals. The U.S. cruise missle target in Sudan was the Al Shifa pharmaceutical factory, allegedly tied to chemical weapons production and to the embassy bombers. This attack killed one and injured eleven workers present.[378]
Talisman announced that it was reconsidering the Arakis acquisition because of the U.S. missile strikes,[379] but by the end of the month it declared that it would go ahead with the acquisition, and advanced Arakis approximately U.S. $ 22 million for the company to continue its Sudan operations pending the closing of the sale.[380] It made a second advance to Arakis of approximately U.S. $ 25 million on September 18, 1998.[381]
On October 8, 1998, Talisman announced the completion of the Arakis acquisition (purchase of all outstanding shares of Arakis Energy).[382] The purchase price was reported to be Canadian $ 277 million (equivalent to U.S. $ 180 million) in Talisman stock, which was paid to all Arakis' shareholders, including Lundin.[383] Talisman thereby acquired Arakis' 25 percent interest in GNPOC and Blocks 1, 2, and 4, covering 12.1 million acres, and in the incomplete pipeline and port, on which construction had just started in May 1998.[384]
Following Talisman's cash infusions and with its technically advanced and hard-working staff, project construction proceeded on schedule, although Talisman was sharply criticized, particularly by Canadian churches and NGOs, because of the project's human rights implications.[385] Nevertheless, due to a jump in crude oil prices led by the Organization of Petroleum Exporting Countries (OPEC), Talisman saw its and the Sudanese government's profits soar, as oil prices more than doubled from U.S. $ 14 per barrel in October 1998 to U.S. $ 33 in October 2000.[386]
Government Inaugurates Oil Pipeline in Heglig, May 1999
Pipeline construction proceeded apace. The inauguration of the GNPOC pipeline from Blocks 1 and 2 to the Red Sea took place, with great fanfare, on May 31, 1999-the same month that government forces and militias attacked and violently drove thousands of civilians from their homes around oil concessions near Pariang (see below). President Bashir, ex-President Nimeiri (just granted amnesty), and Islamist ideologue and party founder Hassan al Turabi were on the podium for the pipeline inauguration, also attended by foreign dignitaries such as Iraqi Oil Minister Amir Muhammed Rasheed.[387] An Iraqi newspaper reported that the minister was in Sudan for talks on boosting energy cooperation between Sudan and Iraq. It added that Iraqi engineers had participated in the construction of the Sudanese oil terminal on the Red Sea and had helped Sudan build an oil refinery prior to the 1990 U.N. sanctions on Iraq.[388]
Sudan's Deputy Energy Minister John Dor said that he expected crude output to increase from 150,000 to 270,000 barrels a day within two years.[389]President Bashir characterized the pipeline project as having successfully met the challenge of U.S. obstructions:
The oil was always here, but . . . it was in the hands of the American company [Chevron]-and the Americans said, 'We do not need this oil at this time. . . .' When told to dig it out 'for the benefit of the Sudanese people or we are bidding farewell,' the Americans left.[390]
Government Inaugurates Khartoum Oil Refinery, June 1999
In July, an oil refinery at Al Shajarah, south of Khartoum, owned by the Sudanese company Concorp, was completed by the Chinese company CNPC.[391] The first privately-owned oil refinery in Sudan, it cost U.S. $ 15 million and was projected to refine 10,000 barrels of crude oil per day from the government's share of crude brought from the GNPOC oilfields via the GNPOC pipeline.[392] The president of Sudan inaugurated the refinery on June 30, 1999, the tenth anniversary of the military-Islamist coup d'état, and he conferred the Order of Accomplishment on the general director of Concorp Petroleum Co., Mohamed Abdalla Jaral-Nabi, in recognition of his efforts to boost Sudanese oil production.[393] Only a few months before, a Sudanese environmental organization criticized the construction of the refineryand warned that overspills and oil dumping into the Nile would contaminate the river.[394]
In a letter to the Khartoum daily Akhbar Al Youm published on June 26, 1999, Talisman CEO Jim Buckee predicted that "there will be enough production to meet Sudan's needs for a long time and to export to meet the world's hunger for energy."[395] Talisman later estimated that, over the life of the Heglig and Unity fields alone, the government of Sudan would earn approximately U.S. $ 3 billion to $ 5 billion, depending on the international price of oil.[396]
First Oil Exports Flow from Sudan, August 1999
Before the oil project went on-line, Sudan's economy had been in dire straits. In 1990, the IMF had issued a declaration of noncooperation against Sudan due to the government's unpaid debt and debt service payments to the IMF. Sudan agreed to a schedule of payments to the IMF in 1997 and made progress in fiscal reforms that ultimately led the IMF to lift its declaration on August 27, 1999-just days before Sudan exported its first crude oil.[397]
While the people displaced from the oilfields struggled with on-going hostilities, disease, mud, rain, floods, mosquitoes, and lack of food in distant Bahr El Ghazal and Upper Nile, a ceremony to mark Sudan's first export of crude oil took place at the newly-constructed oil supertanker port on the Red Sea on August 30, 1999. The notables assembled at Masra al Bashair watched as the first 600,000 barrels of crude oil flowed into an oil tanker.[398] Its destination was Singapore, where the buyer, The Shell Transport and Trading Company planned to refine it.[399] Representatives from thirty Western companies and delegates from Chad, the Central African Republic, and Saudi Arabia witnessed the event.
The government-run radio described the export as a victory for the Islamist government: "We have defeated all the foreign enemies wishing to stop the export of the oil. We must now defeat the internal enemy who may try to halt the full utilisation of the oil revenue."[400] The press quoted President Bashir, who described the exports as a reward from God for "Sudan's faithfulness."[401]
Incidents of Pipeline Sabotage, 1999
Once completed, the pipeline formed an obvious target for rebel attacks. Yet sabotage of the pipeline occurred not in the south of Sudan but in the north-perhaps because so little of the pipeline is located within the south. In the first incident, saboteurs attacked the pipeline in an uninhabited area fourteen kilometers east of Atbara (north of Khartoum), at midnight on September 19, 1999, just a few weeks after the first export of oil. In response, Sudan's interior minister announced the deployment of more than 3,000 policemen along the pipeline. These "oil utilities police" would work in cooperation with the army and security forces already there to protect the oilfields, pipeline, and pumping stations.[402] The Popular Defence Force, the Islamist militia under army jurisdiction, again called on all mujahedeen to join militia brigades heading for zones of military operations.[403] There was confusion about which rebel force conducted the attack on the pipeline. Authorities said they found an emblem of the Umma Liberation Army (ULA) at the sabotage site.[404] The ULA was the armed wing of the Umma Party-one of the two largest political parties in Sudan and at the time a member of the National Democratic Alliance (NDA), the coalition of opposition parties and armed movements headquartered in Asmara, Eritrea.
The NDA defended the attack, calling the pipeline a legitimate military target. It argued the sabotage did not constitute a terrorist but a military action because the NDA was in a state of war with the government.[405] The SPLM also reiterated its position that the oil industry was a legitimate military objective.[406]
The government brought lawsuits for blowing up the pipeline against the NDA and Umma Party in exile.[407] The government sought the extradition from Egypt of Sudanese opposition leaders who gave press interviews in Cairo (where they lived) about the sabotage. The Egyptian government ultimately reached a "gentleman's agreement" with NDA leaders, and they left Egypt for Eritrea, thus rendering the issue of extradition moot.[408]
A month later, in early October 1999, two bomb blasts went off at a petroleum depot and service station in Kassala, a large town in eastern Sudan near the Eritrean border. Again, an emblem of the Umma Party reportedly was found at the explosion scene, but the Umma Party denied any involvement.[409] On November 28, 1999, an import pipeline from Port Sudan to Khartoum was sabotaged in Erkweit, about 120 kilometers southwest of Port Sudan. This did not affect the export of oil.[410] The government claimed that the attack was launched from "a neighboring state," meaning but not saying Eritrea.[411]
The oil export pipeline was sabotaged again on January 16, 2000. A bomb explosion, about 150 kilometers (ninety miles) southwest of Port Sudan, left a ten-foot rupture in the pipe.[412] The government blamed the Beja Congress,[413] a political party of the marginalized Beja people of eastern Sudan who took up arms in the 1990s and joined the opposition NDA.
In the early morning hours of May 1, 2000, the oil export pipeline was blown up again, some fifty meters from the site of the January blast, far from Western Upper Nile.[414] A representative of the Beja Congress admitted to Human Rights Watch that Beja forces had sabotaged that pumping station, known as Bramayo, thirty kilometers south of Sinkat. They had sabotaged it three times, he said, the last time in May 2000. In that attack, a small team of Beja Congress saboteurs came at night and laid explosives, according to their representative. They took two hours to set up the explosives and detonated them in the early morning, damaging the pumping station.[415]
According to the government, a camel chase took place the next day. Government soldiers and police chased Beja members across the Red Sea mountains, tracking the rebels' camels' hoofprints eighty kilometers from the scene of the blast. A brief gunbattle broke out and the government announced it had killed one and wounded and captured another of the suspects.[416]
The Beja Congress, however, said that its sabotage team, on camels, managed to get away but the government came after them with soldiers in a truck with a machinegun ("doshka") mounted in the back (known as a "technical"[417]). The Beja Congress, still on camelback, twice ambushed the government vehicle. One of its camels was injured in the exchange of fire and had to be put to death. The Beja succeeded in blowing up the technical in the second ambush, killing eleven soldiers. At that point the Beja left their three remaining camels near the truck and proceeded on foot into hiding. The Beja denied that the government had caught, killed, or injured any of the sabotage team. They lost only their camels, the spokesperson said.[418]
No further sabotage of the pipeline occurred from May 2000 through the writing of this report.
Government Relations with Southern Militias, 1999
Divisions in Paulino Matiep's Bul Nuer Militia, October 1998-September 1999
At a strategic location near the oil areas, within Block 4 and near Block 1, the government army had an important base at Mayom, in Bul Nuer territory of Western Upper Nile/Unity State. South of Mayom, Paulino Matiep's Bul Nuer government militia had its base in Mankien. In late 1998, divisions within Maj. Gen. Paulino Matiep's troops appeared, neither for the first nor the last time. His deputy commander, Philip Bapiny Machar, and about one thousand members of his government-sponsored militia, fled west into Bahr El Ghazal and joined the SPLM/A,[419] the second major defection of southern government militias to the SPLM/A in 1998 (Cmdr. Kerubino Kwanyin Bol's, in January, was the first).
Thousands of Bul Nuer civilians fled with their soldier relatives to Twic County, many living under trees and subsisting on wild foods and assistance from their kin. They did not bring their cattle because the animals could not cross the swamps.[420] Suspicious that the remaining civilians would provide help to Philip Bapiny, "a son of the area,"[421] Paulino Matiep responded by pushing more rural Nuer out of the villages around Mankien and Mayom, telling them to go into the garrison town of Mayom, supposedly as a safety measure.[422]
In early 1999, Nuer chiefs and other leaders (but apparently no Bul Nuer) tried several times to confer with Maj. Gen. Paulino Matiep about bringing peace to the Nuer. According to one chief, they could not convince the government loyalist to meet with them.[423] These chiefs were aligned with the Riek Machar forces.
Government Foments Division of SSDF Into Smaller Nuer Militias
Although it would neither rely on southerners as firm allies nor allow them to grow too powerful, after the Khartoum Peace Agreement the government also stepped up its direct ties with various Nuer commanders, winning several away from Riek Machar's SSDF by separately arming and funding them. This sapped the strength of the SSDF; apparently the government feared a strong SSDF might challenge the government for control of the oilfields.
When the UDSF/SSDF delegation members who had attended the Wunlit conference returned to Khartoum, their names were noted and their movements monitored daily by Sudan's security forces. The delegates began to fear that they would be targeted if the situation were to change. The government also blocked release of funds to the Southern States Coordinating Council, cutting off its officials and others who had been observers at Wunlit.[424] Riek Machar's southern rivals in Khartoum, some of whom joined the ruling National Congress Party (formerly the NIF) rather than Riek Machar's UDSF, called for his replacement as head of the SSCC. They said he should not hold government office because he was not in the government's National Congress party.[425] When Riek Machar backed the Wunlit meeting, those same enemies, led by Lawrence Lual Lual,[426] accused him of collusion with Garang.[427] Riek Machar and the UDSF resisted these demands and Riek Machar retained his position.
In addition to its close relationship with Maj. Gen. Paulino Matiep, the government separately funded the following Nuer militia leaders in Upper Nile: Cmdr. Gordon Kong Chuol (operating from Nasir, one of the three commanders who with Riek Machar had led the 1991 split from the SPLM/A); Cmdr. Gabriel Tanginya (Old Fangak, then Poum, Upper Nile); Cmdr. Simon Gatwich Dual (Motot-Akobo); and Cmdr. Garkoth Gatkuoth Hothnyang (Nasir).[428] The SSDF claimed that Tanginya had about 2,000-3,000 forces, the others less. According to the SSDF chief of staff: "We gave [Tanginya] the command, but if he is in Khartoum, he meets only with the government, not us."[429]
Riek Machar protested, to no avail, that this direct government support to his commanders constituted a violation of the Khartoum Peace Agreement. Gov. Taban Deng claimed that this was part of the government's divide and rule strategy, which targeted illiterate commanders.[430]
Dispute over Block 5A Oilfields between Government and SSDF, Early 1999
By early 1999, Riek Machar's tenuous pact with Khartoum was breaking down,[431] and the government had grown increasingly wary of its peace partner. The real crux of the disagreement concerned control of the oilfields in Block 5A. By early 1999, Talisman's expertise and cash had made a tremendous difference and the pipeline project appeared to be on track. Upon completion of the pipeline from GNPOC's wells to the Red Sea, it would only be a matter of a short link-up of some seventy-five to one hundred kilometers to pump the oil from a planned-for third party user, Lundin on Block 5A, to the main pipeline in Block 1.[432]
In February 1999, Sudan's minister of defense met Riek Machar in Western Upper Nile/Unity State. The minister reportedly insisted that the government's own forces must guard the petroleum, including the Lundin operations in Block 5A. Riek Machar disagreed, according to a witness, asserting that the SSDF had guarded Lundin since 1997,[433] which was true according to Paul Wilson of Rappaport, security consultant for Lundin during that period.[434]
One of the SSDF officers explained:
We were supposed to guard Heglig [Block 2], but we left it to the government of Sudan. They occupied it before we could do anything. Riek [Machar] said it would be solved through discussion. They rejected his request to pull out of Heglig.
The same thing was happening now in Guk [Block 5A]. The SSDF said no. The former minister of defense said no, then he compromised, said he would take it up with Khartoum, and you who are in the majority [Riek Machar's forces] take [Lundin].[435]
According to this version, the government at one point acceded to Riek Machar's insistence that his forces would be the ones to guard the Block 5A concession.
Riek Machar at this time told the Sudanese government of the upcoming 1999 Nuer-Dinka reconciliation conference at Wunlit in Bahr El Ghazal, and of his support for it. The government's initial reaction was that there should be no meeting without the government's presence. As always, the government opposed any civil society gatherings that were not in its control, even one to be held in rebel territory.[436]
One SSDF delegate returning from Wunlit in March 1999 observed the military build-up in Western Upper Nile/Unity State. The government had flown in new forces to the army bases in Heglig, Rubkona, and Bentiu, and he observed seven trucks carrying about 1,000 mujahedeen on the road from Heglig heading to Rubkona.[437]
Government Calls for Military Volunteers to Defend Oilfields, 1999
Despite its encouragement of a proliferation of southern militias, the government increasingly relied, for protection of the oilfields, on the regular army, Islamist militias recruited in the cities and colleges, and non-southern militias incorporated into the army through the Popular Defence Force (PDF). These forces were increasingly brought to the oil concession areas of GNPOC and Lundin starting in 1999.
On March 11, 1999, after the Wunlit meeting, First Vice President Ali Osman Taha called upon all young men and women in eastern Sudan to join the mujahedeen of the recently formed "Manifest Victory" (Al Fatih al Mubin) Brigade. "With the start of the oil exportation," he proclaimed, "we will score a decisive victory by liberating all positions and spreading peace and stability in all parts of Sudan."[438] On April 29, 1999, the second conference of the pro-government General Sudanese Union called on its branches nationwide to send mujahedeen to the battalion of "Petroleum Protectors."[439]
On May 5, the Popular Defence Force's coordination office announced the dispatch of the first batch of "Protectors of the Oil Brigade" (Liwa Hamma al Bitarol) to the oilfields. Sudanese TV announced that a major mobilization for the Brigade was underway in states throughout the country, with "scores of mujahedeen pouring into the assembly centers to join."[440] President Omar El Bashir appealed to young men to volunteer to defend their oil from foreigners, warning of "plots prepared by the U.S. and Israel to be executed by Uganda and other hirelings for preventing exportation of petroleum as of next June 30."[441]
A few days before the inauguration of the pipeline, on May 27, Sudan's official radio announced that the government was sending another batch of 2,500 volunteers, mostly youth and students, to protect the oil pipeline. The brigade was seen off by Defence Minister Lt. Gen. Abdul Rahman Sirul Khatim in Khartoum.[442]
The prize was growing: because of Talisman's successful exploration, the proven reserves in GNPOC grew steadily: for the years ending December 31, 1998: 403.6 million barrels; 1999: 528 million barrels; 2000: 562.8 million barrels; and 2001: 725.2 million barrels.[443] The government's figures were even higher.[444] An energy and mining ministry official told a youth conference that oil reserves explored in Heglig were expected to reach 1.2 billion barrels by the end of 1999.[445]
DISPLACEMENT AND DEVASTATION IN BLOCK 1, 1999
Overview
The year 1999 saw a significant escalation of conflict and displacement, as the pace of population clearance from oil areas quickened. In mid-May 1999, the Sudanese government launched an all-out attack lasting several weeks on Ruweng (Panaru) County in the eastern part of Block 1, which had already been battered by continued displacement efforts by the government but where, nevertheless, a spread-out Dinka community of tens of thousands remained. The assault commenced with aerial bombardment followed by ground troops who looted freely and burned everything as they withdrew to the garrison town. The SPLA's small contingent put up little resistance. Tens of thousands of residents were displaced, often for the second or third time. Although some returned, many were frightened off for good.
The displacement was not limited to Ruweng County. Many other areas were targeted, as the Talisman difference in oil development began to make itself felt. The pipeline was on schedule for use in a few months and more new wells had been located; some were already being drilled.
Government Campaign of Forcible Displacement from Block 1, February-July 1999
In early 1999, the Sudanese army began operations to displace those civilians still remaining around Pariang, Ruweng County, a much-besieged Dinka area where the SPLA had mobile troops from time to time, moving to and from a base in Atar southwest of Malakal. In February 1999, Maj. Gen. Paulino Matiep's government-sponsored forces began warning Dinka civilians there to move to the garrison town or to the north of Sudan, claiming they would be killed by the SPLA or the SSDF if they did not. Many fled soon thereafter. They were living only tens of kilometers away from some oilfields.[446] Some who owned cattle went to the Dinka in Twic County, Bahr El Ghazal, while many without cattle went to Liri in the Nuba Mountains, northwest of Pariang, following the road that ran north from Bentiu and on to Khartoum, according to an SSDF official.[447]
Reflecting the military operations, during the early months of 1999 the World Food Program declared Gumriak-part of Ruweng (Panaru) County in Block 1-a "no-go" area for its operations for security reasons.[448] As many fled from Ruweng County, other displaced persons arrived. In late April, WFP completed a distribution of food aid to 15,360 beneficiaries in Gumriak, where it found groups of Jikany and Leek Nuer arriving from the environs of Bentiu following Maj. Gen. Paulino Matiep's operations there.[449]
A small contingent of SSDF troops (Riek Machar's army) led by Cmdr. Paul Thon Roch had been conducting ambushes of government military vehicles along the Heglig-Rubkona road and Maj. Gen. Paulino Matiep's troops forced them to flee. Cmdr. Paul Thon's forces reorganized and attacked these enemy troops, but the attack failed, leaving Cmdr. Paul Thon boxed in. At this point he chose to join the SPLM/A rather than Maj. Gen. Paulino Matiep.[450] Thus, in addition to displaced civilians, there was a small rebel military presence of Nuer SSDF (SPLA) as well as Dinka SPLA in Block 1.
These February-April maneuvers and displacements were minor compared to what came next. Between May 9 and 23, 1999, the government army launched an offensive on Dinka villages from the Pariang garrison, moving to Tagil and then Gumriak. From there they went to Padit (Block 5A), all in Ruweng County, with the main intention of driving the villagers off their land, according to civilian survivors. The attack was an all-out effort by the Sudanese government. It first used Antonov bombers and helicopter gunships and then deployed tanks and armored personnel carriers backed by militia from garrisons at Liri in the Nuba Mountains and Pariang.[451]
Several, including SSDF officers, regarded the government's May 1999 offensive in Ruweng County as retaliation for the SPLA's March killing of three Sudanese government employees traveling with the International Committee of the Red Cross (ICRC);[452] others reported that the government army attacked because it had heard rumors of an impending SPLA strike on the oilfield from Ruweng County.[453] But a local SPLA commissioner of Gumriak said, "The reasons for the attack are clear: they want to exploit the oil in this area without fear of local resistance, so they are clearing the area and removing all the people."[454]
Whatever the reasons for the government military offensive, it improperly targeted and also indiscriminately hit civilians, and deliberately burned and destroyed civilian items necessary for survival: food, huts, and seeds. These are not legitimate military objectives under the rules of war.[455] The oil-clearance rationale was the most likely because of the extensive and targeted attacks on civilians and civilian objects, and later statements by government officers involved in the operations.
According to the report of the Canadian human rights delegation that visited the location a few months later, "Roads built by the oil companies enabled [ground troops] to reach their destinations more easily than before. The village of Biem 1 was destroyed, and the burning of tukls and theft of cattle ranged as far as Padit. Biem 2, which we visited, was badly damaged."[456]
The Canadian report added: "Heavy bombing occurred near the . . . river where many of the Dinka habitually reside in the dry season."[457] It found that the report of U.N. Special Rapporteur Leonardo Franco, initially challenged by Talisman,[458] actually understated the extent of the fighting. The offensive lasted two months, not ten days as Franco estimated, and "was characterized by bombing runs and helicopter gunships flying low enough to kill people, and make the survivors afraid to cultivate."[459]
A relief worker from the health NGO Medair, who was in Gumriak when the aerial attacks began on May 9 until his evacuation on May 12, witnessed bombings and frequent runs by government helicopter gunships.[460] After flying out the Medair staff, relief agency aircraft evacuated some wounded residents, before a government helicopter gunship went in and attacked again. According to a witness, it seemed clear that the government wanted to remove all NGO presence from the area.[461]
As a result of the offensive, the government army captured Padit airstrip and Gumriak in May 1999. Apparently, the SPLA fought them off at Tagil airstrip, to the north, but either was not present or retreated from the other locations attacked.
The daily government newspaper Al-Anbaa announced in late May that the government army and militias had destroyed a number of SPLA "camps" in Unity State. Lt. Khalid Ahmed al Bashari, commander of the Pariang government military area, said government forces had destroyed all the rebel camps that threatened the oilfields in the area. According to a government soldier, they "cleaned up the area completely from the rebels and secured the oil area." [462]
The army also claimed it had freed four Sudanese and a Chinese engineerworking in the oilfields area who had been seized by the SPLA[463] This appears to be the same group referred to by a Talisman oil company official who said that five members of a seismic crew- four Sudanese and one Chinese-were abducted by the SPLA from Munga in Block 1[464] (apparently on May 12). A soldier who was seized at the same time from the same location was killed, according to a Talisman security official at Heglig.[465] The oil workers were at liberty by 9:00 p.m. on May 17, although it was unclear whether they were released by the SPLA or "freed" by the army in the course of its operation.[466]
Another prisoner incident was alleged during this period, involving the capture of twenty-three Chinese oil workers at Bentiu on the border of Block 5A and Block 1. The SPLM/A was the sole source of this capture story but denied any direct involvement, attributing it to "armed Sudanese."[467] These captives may, or may not, be the same as the twenty-three Chinese workers the SSDF alleged it captured at Guk in Block 5A, when the fighting began there in early May, and released in Bentiu a few days later.[468]
Much of the war-caused civilian population displacement in the vast inaccessible rural areas of southern Sudan has not been witnessed or seen by outsiders. The May 1999 government assault to drive civilians out of the rural Pariang area in Block 1, conducted at the beginning of the rainy season before army vehicles became useless, was an exception. In this instance, the displacement and its aftermath were witnessed by some Medair relief workers still on the ground, quoted above, followed by: (1) a visit from U.N. World Food Program food monitors[469]followed by other WFP officials;[470] (2) a Christian Solidarity Worldwide team[471] traveling by chartered plane with a British journalist in June 1999;[472] (3) another aid organization with a Canadian journalist in November 1999;[473] and (4) the Canadian government human rights delegation in December 1999. Usually, military operations forcing displacement do not receive such extensive corroboration. But perhaps because this was in Talisman's concession, it drew more attention.
One observer who visited the location shortly afterward observed that the looting and burning covered the whole area from Tagil to Gumriak to Padit. Many saw the burned tukls, food, and seeds. This was "just after a food distribution and seeds and tools distribution before the planting season, what would be the worst time to drive the people out. . . . I could not believe the devastation."[474]
The Canadian human rights delegation likewise reported that the government soldiers had burned a large number of tukls, particularly along the road linking Tagil, Gumriak, and Padit, many with food stocks and seeds inside.[475] Civilian survivors told the visitors that some 1,200 government soldiers had swept through Ruweng County, killing scores of civilians and burning more than 6,000 huts (reportedly 60 percent of the individual homes in the area, both Dinka and Nuer). The looting and burning apparently took place as the government of Sudan forces withdrew to their garrison, leaving only scorched earth behind.[476]
The government's displacement effort succeeded in scattering residents south to the Nuer areas, north to the Nuba Mountains, and to Pariang town. The displaced were mostly Ruweng (Panaru) Dinka families, but included some already displaced Nuer who had sought shelter in that Dinka area. After the government forces withdrew, some civilians and the SPLA returned to the burned areas around Gumriak, but many did not.[477] Relief workers found that many who had fled these May 1999 attacks remained too frightened to come out of the swamps in July, and by November many had left the area altogether. A WFP official who visited the area in April and in July 1999 noted that before the attack, 32,000 people had been on the food distribution list in the nearby Biem area, an SPLM/A zone. At a food drop in November 1999, less than 10,000 people were left.[478] The governor of Unity State said the attack affected and at least partially destroyed an estimated two-thirds of the villages in the Pariang area (Ruweng County).[479] From April to July 1999, the decline in population in Ruweng County-caused by government-instigated displacement-was estimated to have been in the order of 50 percent.[480]
Relief organizations postponed food delivery to Pariang town in May at Sudanese government request.[481] The OLS (Southern Sector) reported government army attacks, including burning and looting, had occurred again at Padit, Gumriak, and Tagil on June 3.[482] Although these SPLM/A areas were approved for quick food delivery interventions, this did not suffice to prevent malnutrition from growing.[483] During the week of June 16, a U.N./government of Sudan/NGO team visited government-controlled Pariang town and reported the presence of 3,379 newly arrived internally displaced persons. About fifty displaced persons a day were arriving in Pariang as a result of the fighting in the surrounding areas.[484]
The WFP-the only OLS agency allowed to operate in the area because "the security situation is still very fragile"-distributed emergency food supplies to 40,128 people in Tagil and Gumriak in the middle of June. The WFP team reported "clear visual evidence of malnutrition in both locations."[485] Meanwhile, Bentiu itself was so insecure that the WFP relocated its staff from there during the week of June 30, on the recommendation of a Khartoum-based WFP security officer.[486]
WFP received reports from the Sudan Relief and Rehabilitation Association (SRRA), the relief wing of the SPLM/A, in late July 1999 of an estimated 42,000 persons in SPLA-controlled areas of Ruweng County who might require food and non-food relief.[487]
On July 24, 1999, the government of Sudan completely destroyed Bolyar village, north of Bentiu on a road between Pariang and Bentiu, apparently very close to Athonj and the El Toor oilfield. (Map C) Some 4,000 people fled south to Kueldit Payam (subcounty), which borders the Bahr El Ghazal (Nam) River.[488]
But even though these attacks involved the forcible uprooting of thousands, this clearance of civilians was dwarfed by the abuses simultaneously taking place in Block 5A.
BATTLE FOR CONTROL OVER BLOCK 5A,
April-June 1999
Overview
As the nascent Sudanese oil industry prepared to bear its first real fruits for the government, oil exploration in the south took on a new momentum. The projected completion of the GNPOC pipeline from Blocks 1 and 2 to the Red Sea in June 1999, with exports projected for a few months later, brought pressure on the developers of other blocks. Block 5A, adjacent to Block 1, immediately began to look not only commercially viable, since a hookup to the Block 1 pipeline only seventy-five to one hundred kilometers away was available, but also very attractive as Talisman continued to prospect for and find new wells in its concession.
The goverment of Sudan made clear its intention to move its troops, escorted by Paulino Matiep's Nuer militia, into Block 5A to protect the only Lundin exploratory drilling location in that block, at Ryer/Thar Jath. At the same time, the SSDF forces of Riek Machar reacted by attacking the Lundin exploratory site, permitting the one hundred person crew to evacuate but summarily executing three Sudanese government employees. The SSDF inflicted little infrastructure damage. Then it withdrew from the location to fight off the joint Paulino Matiep/government advance, which it failed to block for lack of ammunition.
The government/Paulino Matiep advance reached Ryer/Thar Jath, Duar, Koch, Ler, and the river at Mayandit, driving frightened civilians and SSDF forces before it, in a matter of days. Leaving the Paulino Matiep forces to guard Ler and Ryer/Thar Jath, the government forces withdrew north to Bentiu, having abducted women and boys to porter their loot, burned homes, raped women, and sowed fear.
The SSDF fled with the Dok, Jikany, and Jagei Nuer civilians in several directions-one large group fled into Dinka/SPLA territory to the west (an unheard of refuge prior to the Wunlit peace agreement a few months earlier). There, the SSDF entered into negotiations with the SPLA which gave the beleaguered commanders ammunition to fight the Sudanese government. The SSDF launched a surprise attack on the Paulino Matiep forces present in Ler on July 3, chasing them to the northern part of Block 5A before the government intervened with helicopters and Antonovs to stop the advance at the garrison town of Wangkei. The SSDF again ran out of ammunition again and retreated south to Nyal, a Nyuong Nuer site considered well protected by the sudd in Block 5B, south of Block 5A.
Maj. Gen. Paulino Matiep reportedly retaliated in anger against this SSDF surprise attack on Ler. His men detained many and killed some SSDF/UDSF civilians, among them state ministers, in Bentiu on July 11-12, 1999. This provoked a civilian exodus from Bentiu. The government announced a flight ban on most of Western Upper Nile/Unity State in the middle of July 1999. The civilians, who had fled the main towns and villages for safety ahead of Paulino Matiep's advance, were cut off without food or emergency supplies.
But the freshly-defected SSDF/Riek Machar rebels had succeeded in their goal: they had shut down the Lundin operation.
Battle for Control of Block 5A: First Rebel Attack on Oil Operations Since 1984; Lundin Evacuates, May 1999
The events of April-May 1999 marked the beginning of the real battle between the government and former rebels over control of Block 5A oilfields in Western Upper Nile/Unity State.[489] Once again, the fighting was about which armed group would control the Nuer area and "protect" and benefit from the oil operations: the government army and its loyal Nuer allies, or the Nuer ex-rebel SSDF under Riek Machar, who aspired to participation in the oilfields in Nuer territory as a result of the Khartoum Peace Agreement.
On April 8, 1999, Lundin announced its first exploratory well in Block 5A, at Thar Jath (the locals called the location Ryer). In short time, Lundin discovered a "substantial" oil deposit there, containing as much as 300 million barrels.[490] (In 2002, a reserve study showed that the Thar Jath Field in Block 5A had proven and probable recoverable reserves of 149.1 million barrels of oil.[491])
The central government already had a few agents assigned to Lundin's security team at Ryer/Thar Jath, as did the SSDF. But the "substantial" find there added a sense of urgency to the government's desire for military control; it wanted to post its own troops to guard the oilfield. Lundin's security representative was said to be negotiating with both Maj. Gen. Paulino Matiep's militia and Cmdr. Tito Biel of the SSDF about the company's future operations.[492] The oil company reportedly had evacuation plans in place for Ryer/Thar Jath, just in case.[493]
Following the withdrawal of most of Maj. Gen. Paulino Matiep's forces from Ler and other areas in October 1998, residents had returned from the toic and started rebuilding. In February and March 1999, the government warned the people of Ler not to build too near its army barracks at Pajak. When the chiefs tried to discuss this, the government rebuffed them: "Forget about it. No further talks."[494] By late March 1999, some 30,000 people received food relief in Ler, most of them displaced from other parts of Western Upper Nile.[495]
According to participants, representatives of the Khartoum government and UDSF/SSDF held a meeting in Bentiu, state government capital, on or about April 24, 1999. The government had already started negotiating with Gov. Taban Deng, Riek Machar, and local field commanders to expand Khartoum's presence in Ler and put regular Sudanese army troops at Duar.
At the Bentiu meeting, ministry of defense representatives told Riek Machar and his colleagues that the government army would protect all the oil areas in Western Upper Nile/Unity State. There was no agreement on this, however. Cmdr. Tito Biel, whose SSDF forces controlled the area south of Bentiu, insisted that he would retain responsibility for "protecting" these oilfields.[496] Another SSDF commander described the discussion:
We said the oil workers can go there, but not the government of Sudan. The government of Sudan refused this. We said the presence of two armies would involve problems. They said that the [government] army should be free to go anywhere in Bentiu [Unity State]. This is a violation of the Khartoum Peace Agreement, [we said,] which requires [our] consultation and approval.[497]
After these UDSF/SSDF officials again refused the government request to position government troops south of Bentiu, Gov.Taban Deng was removed by Paulino Matiep. On April 29, Maj. Gen. Paulino Matiep wrote a letter to Taban Deng, expressing government lack of trust in the UDSF/SSDF and accusing it of posing obstacles to oil development: "Your meeting with Garang's movement in the area of Wunlit [the NSCC People-to-People conference] was meant to delay the process of petroleum refining, and to disrupt peace in the area,"[498] he charged. The government apparently feared that the grassroots reconciliation effort would jeopardize its war plans to divide and displace, and capture the prize: oil.
Maj. Gen. Paulino Matiep then gave Governor Deng and other UDSF supporters three hours to leave the state, under threat of arrest.[499] Taban Deng left on April 30, having negotiated a slight extension of his three-hour deadline. According to the governor, the Bentiu security committee initially sympathised with him:
Paulino [Matiep] ordered me to leave. He came to Bentiu with 200 troops. The government of Sudan army had a battalion in Bentiu with tanks and they did not do anything. Paulino sent me a note telling me to leave in three hours. The security committee met; it was composed of the army commander, the police commander, security, and intelligence (all northerners). They said this was against the law. I received the order in writing from Paulino on 6:00 p.m. At 7:00 p.m. I met with security and they went to talk to Paulino. . . .
According to Taban Deng, the security officers returned and informed him that Paulino Matiep had the backing of the government in Khartoum, so he (Taban Deng) should leave Bentiu. The deposed governor then went to Khartoum and met with First Vice President Ali Osman Taha and President Omar El Bashir, who claimed they could not control Paulino Matiep, and would look into the situation; but nothing happened. Taban Deng marks the beginning of the 1999 fighting from the time of his expulsion: "When I left, everything was all right, tranquil. After that, Tito Biel and Paulino started fighting. Many were displaced."[500]
The governor was not the only person to be expelled from Bentiu town. Maj. Gen. Paulino Matiep also required SSDF soldiers to leave, replacing them with his own militia, while reportedly detaining other pro-Riek Machar officials:
Seventy-five officials were arrested from Bentiu in April [1999] by Paulino with the help of the army. Some have probably been killed. We talked to everyone from the minister of defense to the president, who promised to send a committee to investigate. Up until now [August 1999, four months], nothing has happened.[501]
According to Makuac Youk, UDSF spokesperson in Khartoum, Paulino Matiep removed the seventy-five captives to his military base at Mankien, and the UDSF feared for their lives.[502]
By early May 1999, the power-sharing provisions of the Khartoum Peace Agreement had been abandoned in all but name. President Bashir issued a decree on May 8 canceling recent decisions issued by the UDSF governor of Unity State, Taban Deng, all relating to office holders.[503]
Fighting Begins As Army Troops Attempt to Occupy Oil Rig
Following the expulsion of Taban Deng, the government ordered Paulino Matiep to go from Rubkona to Bentiu with his troops and from there to serve as an escort for the army overland to the Lundin oil exploratory rig at Ryer/Thar Jath, and on to the Ler (Payak) garrison.[504] The government meant business. A convoy of fifteen trucks with almost 400 troops and heavy weapons moved south from Bentiu into the area in late April, flanked by an escort of more than 1,000 of Paulino Matiep's militiamen and others.[505]
After being warned by five SSDF soldiers stationed in Guk of the troop movement, an SSDF contingent from Koch moved up and ambushed the government troop convoy at a place two hours south of Bentiu and one and a half hours from Guk. Supported by government artillery, Maj. Gen. Paulino Matiep's forces broke through the ambush.[506]
Before government forces could reach the location, however, Cmdr. Tito Biel's SSDF forces hit the camp where the oil workers slept at Ryer/Thar Jath at about 2:00 or 3:00 a.m., most likely on May 2. A small SSDF contingent sought out and summarily executed two northern Sudanese government employees found there, and fatally injured a third.[507] The three northerners worked for the government oil production monitoring agency, the Organization of Exploration and Production Authority (OEPA).[508] The rebels sought out these three men for what several UDSF/SSDF officials later alleged was retaliation for torture of local Nuer civilians.[509]
Regardless of whether the three government agents had tortured anyone or not, the summary executions of the three men constituted a violation of international humanitarian law by the SSDF. Cmdr. Tito Biel, when asked about the three by Human Rights Watch, said they had not been killed but were prisoners of war.[510]
In addition, the SSDF claimed it captured twenty-three Chinese nationals in Guk and released them in Bentiu. Francis Gatlouk, deputy operations commander for Paulino Matiep, said that the SSDF rebels had captured and released oil workers, four of them Chinese, in Koch.[511]
Lundin evacuated all its employees (estimated at more than one hundred, many of them Chinese employees of Chinese subcontractors to Lundin): several rotations of planes flew them to Bentiu, twenty minutes away.[512]
The SSDF rebels withdrew. Before leaving the site, they shot up the oil camp at Ryer/Thar Jath (the employees had already gone) and the exploratory rig. The rig, not far from the workers' accommodation, was not badly damaged but reportedly was later dismantled and moved from the area by Lundin.[513]
Shortly after its press release announcing a major find in Block 5A, Lundin issued another press release, stating that its operations were being "suspended" because of the "rainy season."[514]
A second SSDF attack was launched on the same day, May 2, 1999, on the Ler army garrison at Payak. This Sudanese army position at Ler had been a thorn in the side of the SSDF since the army entered Ler in April 1998 and refused to leave. Its presence pertained to the same underlying issue: who controlled Block 5A.[515]
The government had been resupplying and reinforcing its garrison at the Payak airstrip by helicopter from Bentiu. Clashes between the SSDF and government forces occurred at the Payak airstrip on May 2, 1999, as a helicopter arrived, apparently with reinforcements.[516]
The government troops withdrew into their garrison,[517] taking no further part in the fighting in this round. When Maj. Gen. Paulino Matiep's forces entered Ler, the government garrison accepted their wounded but did not let the noninjured into their garrison.[518]
Government Army Occupies Lundin Drilling Site; Militia Forces Chase Civilians and SSDF Rebels to a Distant Corner of Block 5A
Meanwhile, Paulino Matiep's pro-government militia forces and a large government army and muhajedeen contingent were moving south from Bentiu to Ryer/Thar Jath and Ler. After pushing aside the SSDF ambush north of Guk, Maj. Gen. Paulino Matiep's militia clashed with SSDF forces until the SSDF pulled back. A force of more than 500 regular government army troops joined by some 1,000 mujahedeen occupied Guk, which was then garrisoned with mujahedeen.
After the mujahedeen occupied Guk, the rest of the government and militia troops proceeded east to Ryer/Thar Jath the same day,[519] occupying the slightly damaged drilling location unopposed. It has not been recaptured by any rebels to the date of this writing.
Maj. Gen. Paulino Matiep's forces proceeded southwest to Koch,[520] with Riek Machar's SSDF not putting up much resistance. Running out of ammunition, the SSDF fighters withdrew,[521] or "retreated defending," warning the civilians that they were out of ammunition and the government forces were close behind. Many civilians fled on the tail of the SSDF, before they could be captured or killed by government forces.[522]
The SSDF withdrew to the Ler area but did not stay there long. When Maj. Gen. Paulino Matiep arrived in Ler, he occupied it without a fight as government soldiers had been reinforced by air and SSDF forces retreated southwest to Mayandit. The main SSDF forces-with thousands of civilians behind them-ran further south to Nyal and Ganyliel in Nyuong Nuer territory (Block 5B), protected by the sudd and seasonal flooding of the Nile. At Mayandit, some SSDF forces, led by Cmdr. Peter Paar Jiek, retreated west to the Dinka area of Tonj County in Bahr El Ghazal (the far western corner of Block 5A), with the civilians not far behind.
Mujahedeen militia arrived in Ler to join Maj. Gen. Paulino Matiep, and a regular army battalion reinforced the army troops already there.[523] According to the SSDF chief of staff Elijah Hon Top who was in Khartoum at the time, Nuer pro-government militias were sent in from elsewhere in Upper Nile to support government forces.[524]
The army said that it destroyed the air strip in Nhialdiu (Block 5A) and thus denied the SPLA air supplies "from foreign organizations."[525] On June 12, Sudanese government bombing reportedly killed twenty-four civilians and soldiers as they crossed a river in that area, according to the SPLM/A.[526]
Each Side Accuses the Other of Instigating Fighting in Block 5A, May 1999
The UDSF spokesperson in Khartoum blamed government troops for provoking the fighting on May 2 "by replenishing their armed forces at Ler."[527] SSDF Cmdr. Tito Biel similarly claimed that government troops, escorted by Paulino Matiep forces, were the ones to initiate the hostilities when they moved south from Bentiu into his zone of operations without SSDF consent.[528]
According to the government army, however, its forces were attacked when engaging in a normal deployment to a part of the south where they had the right to be, protecting the oil which was a national asset. The army had prepared for a large deployment south of Bentiu in Block 5A to safeguard oil installations Lundin planned to build.[529] First Vice President Ali Osman Taha stressed that protection of the oil production was a national duty. Although production facilities were not seriously damaged, the government claimed it was the intention of the rebels to destroy the government's gains.[530] The armed forces spokesman Gen. Mohamed Osman Yassin claimed that his soldiers had repulsed SPLA rebels (not the SSDF), who attempted on May 2 to attack government troops guarding "petroleum sites" at Ler.[531]
Maj. Gen. Paulino Matiep's militia spokesman accused the SSDF forces of attacking Paulino Matiep's forces in a coordinated attempt to seize the oilfields with SPLA help, attributing this to plans formed "during Wunlit."[532] Cmdr. Tito Biel, he alleged, "has been working with the SPLA since the Wunlit conference of February and March this year [1999] and one of the secret documents of the conference was the seizure of the oilfields."[533] Tot Galwak, a southern member of Khartoum's parliament, also claimed that Cmdr. Tito Biel's alleged realignment with the SPLM/A was in implementation of "a secret part" of the Wunlit agreement.[534]
It does not appear that the SPLA was acting jointly with the Nuer SSDF anti-government forces at this time. That came later, briefly. The SPLM/A had no presence in Nuer areas of Western Upper Nile/Unity State at this time, nor anywhere near the oil concessions or fighting, except in the Dinka enclave in Ruweng County in Block 1.[535] It responded to the fighting in Block 5A by expressing its view that "the exploitation of oil resources at present will not be of any economic benefit to the Sudanese people but will rather lead to the escalation of the civil war."[536] The SPLM/A issued congratulations to Cmdr. Tito Biel for his "patriotic action" in fighting the government in the oilfields.[537]
As for the civilians living in Block 5A, one Dok Nuer chief, when asked who began the hostilities in 1999, responded rhetorically, "Who started the fighting? The one who defends his own land? Or the one who tells the people to move away from their own land?" The same displaced chief lamented, "The Arabs give money to Paulino [Matiep] to fight, and arms. . . . Thejallaba[northerners] have captured our area."[538]
In mid-May, the Sudanese government announced that the fighting had been contained and that the parties involved were working on a solution.[539] The UDSF, the political wing of the SSDF, met but decided not to cancel the Khartoum Peace Agreement despite what it regarded as a government breach of the agreement.[540] A committee was formed of seven UDSF members and seven government members; the government characterized their negotiations as "intensive." The UDSF spokesman said that the Peace Agreement was "in a coma in an intensive care unit and it is up to the government to revive it,"[541] then announced that on May 20, a six-hour heated discussion had reached "a deadlock."[542]
On May 25, 1999, Riek Machar sent another letter to President El Bashir outlining the ways he said the government had violated the peace agreement.[543] Yet, despite more challenges,[544] Riek Machar still held on to his position as head of the Southern States Coordinating Council as Western Upper Nile/Unity State went up in flames.
Civilians Displaced from Block 5A, May-August 1999
Nuer Civilians Flee to Mayandit, then to Dinkaland
Fighting between the government troops and militias, and the rebel forces over control of the oilfields caused great hardship to the civilian population of those areas. The intent of Maj. Gen. Paulino Matiep's militia (under Zonal Cmdr. Peter Gatdet) to drive away civilians was evident from the looting and destruction of the civilian economy-not only the usual cattle looting, but also destruction of grain, granaries, animals that could not be carried off by the militia, and homes. Civilians who lagged behind were captured or killed; some were forced to act as porters, many women were raped, and underage boys were forcibly conscripted.
Not all civilians fled immediately after the attacks on Ler. Some hid outside the town as they had done in 1998, although it was the wet season. Many stayed in the toic for long periods, waiting to see what would happen, and suffered rashes on their bodies and swollen legs because of the water, as well as malaria, from which several of those in hiding died.[545]
One woman who escaped to the toic from Ler returned to her tukl at night to check on her four children who remained at home, because "the soldiers do not move at night." She did not take her children to the toic because there were too many mosquitoes there. In her absence the four, unaccompanied by other family members, had to flee from soldiers and she became separated from them, like countless other displaced families.[546] Another woman returned to Ler secretly to look for her daughter, who had just given birth, but could not find her; it was reported that her daughter had fled toward then-government-occupied Koch.[547]
When the SSDF withdrew from Ler in early May, many civilians fled with them. Maj. Gen. Paulino Matiep took one day to organize his forces and chase them on foot, following on the heels of the civilian stragglers. Civilians recalled the flight as very difficult: "People were killed around me; the Paulino [Matiep] forces were close behind as we fled to Mayandit. The Paulino soldiers chased us five hours to Mayandit from Ler."[548]
This witness remembered seeing the body of one victim, Peter Yu Yut, a Presbyterian church elder, shot by Paulino Matiep's forces, and sixty head of cattle stolen from him. A woman, Ayong Tap of the Sudan Women's Association, was killed. A sixty-year-old man, Bulthiep, was tied to a tree and beaten to death, also by Paulino Matiep militia.[549]
When those displaced who could move faster reached Mayandit, they collapsed into sleep. While they were asleep, Paulino Matiep's forces attacked Mayandit. Out of ammunition, the SSDF commanders and troops crossed the River Neang on the other (west) side of Mayandit. A female resident of Mayandit observed: "There was never such destruction in Mayandit as this year [1999]; there is no Arab garrison in Mayandit,"[550] meaning that without a government garrison neaby, the people had been left in peace. She continued, "I saw the Paulino soldiers and the bad things they did. Those who did not run for their life were shot on the spot." She saw bodies with gunshot wounds. She saw people running away who were shot outside their houses: "All were running, shooting was all around them. They were caught in the early morning. This was when they [Paulino Matiep's forces] had already defeated [Cmdr.] Peter [Paar]'s forces, killing the civilians who were left behind. They were using mortars for some of this killing."[551]
Buar Kueth and his brother Kui Kueth, both young unmarried civilian men, were killed running away in Mayandit, according to witnesses.[552] Many others were separated from their families in the confusion.[553]
This was not combat but a mad dash by Nuer combatants and civilians alike across the river. Those civilians who could not find dugout canoes swam, as did the cattle.[554] But "so many drowned, and cattle drowned too."[555] Maj. Gen. Paulino Matiep's forces did not cross the river. After a few days of looting in Mayandit, his troops returned to Ler.
The enemy stopped chasing us when we crossed the River Nearig. Those able to swim crossed; others had canoes and rafts of grass for the children. The river is very close to Mayandit. I crossed over in a canoe with my children.
The enemy was far away, shooting at those who were running behind us. The river was as wide as from here to the compound. Some children drowned and those who did not know how to swim drowned.[556]
The people crossing the river thought their best bet was to keep running from Maj. Gen. Paulino Matiep and the army. The SSDF and Nuer civilians in the thousands, once across the river, kept walking through the swamp and rain for days until they reached safety in Dinkaland to the west, or in Nuer towns of Nyal and Ganyliel, to the south. Some of those who fled described the terror and hardship of their experience:
When we crossed the river, we continued walking. It was 5:30 p.m. when we were chased out and crossed the river, then it got dark and we continued going to the Dinka area. We knew where we were going, to the neighboring Dinka. I have been to the bordering cattle camps and toic.[557]
Some walked seven days to reach safety in the Dinka area of Makuac in Tonj County, Bahr El Ghazal: "There was so much water on the way, and we were walking with children, that it took a week."[558] Different groups formed and continued walking together; usually the men could walk to Makuac in three or four days, without women and children, but this trip took longer. Once it was clear they would be safe in Makuac, they sent word back so that other displaced Nuer could join them. The displaced Nuer brought few possessions because they were carrying their children.[559]
[W]e left behind goats and chickens. We took only a few cattle. At the beginning we got a little milk from them but by the time we were in the middle of the toic, they had no milk. They were tired, lacked proper feeding, and were attacked by insects. The small calves died, pregnant cattle miscarried.[560]
There was hunger and sickness, such as relapsing fever,[561] malaria, and skin diseases. "The main thing was the mosquitoes eating us alive, leaving rashes, scabies. We drank the water from the road and toic. There were rivers with water lilies and fish; we ate both."[562] According to another, "Hunger was the main problem."[563] Twenty-three people from one group died of hunger and disease on the way.[564]
The cattle that were too exhausted to keep up and straggled behind were attacked by lions, which the displaced saw behind them as they traveled by day and night. One man survived a snakebite on his heel.[565] There was rain, sometimes erratically, starting on one day and continuing to the next. But they were grateful. "The rain saved our lives. It stopped them from chasing us, and we kept walking through the rain. Small children died of cold on the way, and had to be left on the road."[566]
We slept on the grass, outside. This is what killed some children. A boy aged eight and a girl of ten years were lost on the way. I do not know if the wild animals got them. When they were missing we searched for them and could not find them. We lost both in the toic after crossing the Dinka border, near the cattle camp Ngot. The girl's name was Nyanit Biel.[567]
Dinka Warmly Welcome Displaced Nuer, Slow International Relief
In keeping with the covenant at Wunlit in March 1999, the Dinka from Makuac had returned to resettle the border communities deserted because of the Nuer-Dinka war. Building in this floodplain was seasonal, starting in October, with thatching grass for roofs not available until after the rainy season ended and vegetation dried out, starting in December. So the Dinka planted sorghum and other crops in Makuac and stayed in Paliang, Bahr El Ghazal, five hours away by foot.[568] They had not even settled in when the Nuer arrived seeking refuge, starting in May 1999.
The Nuer stayed around Makuac despite the lack of shelter, because it was near the toic and fishing camps, sources of food. They had almost nothing. A Nuer chief from Mayandit said, "We are lacking so many things because our houses [in Western Upper Nile] were looted and burned. We have no mosquito nets, nothing for cooking, no blankets, and the cows were looted. We are being helped by this Dinka population."[569]
According to Dinka chief Lino Madut of the Luak-jang Dinka, who was present at Wunlit: "We the Dinka slaughtered eighty-three bulls for the Nuer because they had no rations."[570] The Nuer confirmed that the Dinka also shared their WFP relief food with them.
In Makuac, the Nuer were not associated with or related to forces that belonged to the SPLM/A but they were nevertheless welcomed by Dinka chiefs and other traditional leaders because of the Wunlit agreement. The friendship that grew up between Dinka chief Lino Madut and Nuer chief Isaac Majok at Wunlit made the decision to flee to Dinkaland easier. Chief Isaac Majok said: "We are here because peace was signed in Wunlit. Also because that peace led to an escalation of fighting by the jallaba [northerners], stirring up fighting between us Nuer."[571]
The Nuer flight to Makuac, and the Dinka welcome of them there, thus marked another important step in the demilitarization of Dinka-Nuer relations on the West Bank of the Nile.
The Dinka welcome of the Nuer was all the more generous because these Dinka had been displaced themselves-by the Nuer now seeking their help. Chief Lino Madut, one of the Dinka who fled Nuer raiders, said Makuac was evacuated by its Dinka residents "during the war with the Nuer, which lasted from 1993 to 1999." He continued, "I'm glad I was in Wunlit. . . . They [the Nuer] devastated Makuac and today we are brothers. We had a quarrel with our brother but the dispute is over. Today we and they are one."[572] As to why the Nuer chose to flee to a Dinka area, the Nuer chief said:
Why did we come here? We were a bit doubtful, but we had some hope in Wunlit to put to trial the peace accord, to see if it was effective. Those who doubted went to Nyal [where the Nyuong Nuer live]. They did not know it would be as good as it is now [relatively]. Those who believed came here.[573]
The WFP conducted an assessment of the area in early August 1999, several months after the first Nuer displaced arrived. By that time, in mid-rainy season, the mud was deep and passage for vehicles was impossible. The Makuac airstrip had been waterlogged for weeks. The WFP team had to slog on foot several kilometers to Makuac. About a dozen trucks carrying relief food from WFP warehouses in Uganda had been stuck for weeks in Paliang, not able to get any closer to Makuac. By mid-August, the agencies decided to ask the displaced Nuer in Makuac to walk the five hours from their makeshift shelters to the bogged down trucks in Paliang for the first relief food distribution. The displaced gladly complied, and the Nuer women carried fifty-kilo bags of maize and sorghum back on their heads, along slippery muddy paths.
Nuer Chief Isaac Magok commented to a Human Rights Watch researcher:
You are from America. We want you to see the location [in the fishing camp where we have to live]. I have seen on TV a village bombed in Kosovo . . . . The U.N. brought camps and cooked food and then in little time everyone was laughing. Why do they not do the same to us? Because we are black? What is wrong with them? You will see our conditions and then we will talk to you.[574]
Other Displaced Nuer Embark on Hazardous Journey to Nyal and Ganyliel
Some Nuer who fled Block 5A due to fighting and forced displacement were closer to the Nile and turned south along this waterway, which flows north. They escaped using primitive river transport into the territory of the Nyuong Nuer in Western Upper Nile, to their main towns of Nyal (on the sudd) and Ganyliel (formerly a port on the Nile). The OLS (Southern Sector) assessment team visited Nyal and Ganyliel in late May 1999.[575]
These displaced, who carried little but their children with them, optimistically planned "to cultivate in Nyal and Ganyliel and return to their original homes when the fighting stops."[576] They may have brought tuberculosis and kala azar with them, however, which were newly reported in both towns.[577]
One Ler man left his wife, one child, and an infant born on May 30 hidden in the toic southeast of Ler. He went to look for transport. As he went north down the Nile, he could hear firing on the fishing camps and villages near the river, and artillery shelling on an island. He, his younger brother, and a guide spent almost two weeks looking for a canoe; at this time of year the rivers were too deep to swim. They located his family (which had fled the government troops) and then in a canoe made of a hollowed-out palm tree, they paddled south upriver with his wife, child, and newborn baby for three days, through mosquitoes and rain, arriving in Nyal on June 16.[578]
Others to the north, the Bul Nuer, fled to Bulyom, a Dinka area in Bahr El Ghazal, where they stayed in an area for internally displaced people and received emergency relief as part of the Maper distribution. In June 1999 there were 3,426 new Nuer arrivals in Maper.[579]
Other Human Rights Abuses Linked to Displacement, 1999
The forcible displacement of the population from strategic areas of Western Upper Nile/Unity State involved wholesale theft of cattle, rape, underage recruitment, use of landmines, and summary executions. During the 1999 fighting, as usual, civilians were preoccupied with protecting their main asset, their cattle. As one Ler chief described:
When Peter Paar's men ran out of ammo and withdrew, I left, in May. During the above fighting, we were moving the cattle to Mayandit. Those who were able to move their cattle were those living south of Ler. Those on the north side had their cattle raided by Paulino Matiep. My house was north of Ler, and my cattle were captured.[580]
During 1999, until he defected to the SPLA in September, Cmdr. Peter Gatdet was zonal commander of Paulino Matiep's Western Upper Nile/Unity State forces; in 1998 he was assigned elsewhere. This period of heightened abuses by the Paulino Matiep forces coincides with Cmdr. Peter Gatdet's command, although the abuses did not diminish after his defection.
In 2000, increased abuses by SPLA forces operating in Western Upper Nile/Unity State-under then SPLA Zonal Cmdr. Peter Gatdet-were reported, including summary execution of prisoners.
Rape and Other Abuses Against Women
In 1999, civilians in Western Upper Nile/Unity State were especially horrified because the enemy soldiers murdered women, something these civilians were not used to:
Soldiers did not kill women like this in 1998. . . . this year [1999] they were seriously searching for women by name. They were looking for those whose husbands are in the SSDF, who are in [the Sudan Women's Association], [and] who worked in the hospital.[581]
The witness said Paulino Matiep's soldiers knew the names of their victims because the soldiers "were born in Mankien, and were living in Ler from 1991 to 1996 when Paulino [Matiep] was governor."[582]
One underage soldier forcibly recruited by Paulino Matiep's militia observed that the militia, together with government soldiers, beat and abused civilians, including women. "They would remove a lady's skirt and petticoat. When she cried, they beat her more," he said, and "If they captured you and then took your sister as a wife, if you were angry, they would beat you. . . . They are serious about raping.[[583]] The Arabs are serious, they bring girls from far off to the garrison."[584]
Shortly after the boy soldier was sent to Maj. Gen. Paulino Matiep's base at Ler, he said the "Arabs," northerners, asked Maj. Gen. Paulino Matiep's forces to accompany them to remote places: "The Arabs feared going there alone. When they go, they abduct young ladies. They sleep with them today and tomorrow send for a plane to take them away."[585] He was sent in a mixed Nuer and "Arab" government platoon to the village of Ger:
When the Arabs go out by themselves they could be ambushed. . . . The Arabs . . . did not sleep outside. . . . On this trip they captured up to twenty ladies, making them take off their clothes. The women who refused were beaten. They did not find people other than ladies there. There were no men and no boys. All were in the toic.
This patrol did not attack any military objectives, according to the boy participant. Its purpose was to look for-kidnap-young women and loot cattle. The soldiers, both Nuer and northerners, raped all the captured women before taking them back to the garrison. None of the soldiers objected to this mistreatment of women. The boy soldier said he "did not do anything" to the women. He was forced to beat one woman who resisted rape, under threat that if he did not beat her, it would mean that he did not belong to "our side," and would be killed. He therefore "beat her with a stick."
The boy recruit knew four Nuer women among those captured and held at this base, locked inside a house. The soldiers and officers were prevented from going inside. "The women who were beautiful to the commanders were kept for them. The others were shared among some soldiers, both Nuer and jallaba." He did not know how many women were locked up there. As far as he could tell, there were no children with the women. The captive women were taken outside the house, six at a time, to urinate while three soldiers held them at gunpoint. On one such occasion, the boy saw his cousin in the group. She was unmarried, a few years older than he. There was no way to talk to her. She saw him and immediately started crying. She was wearing a sheet; in the village she had worn a T-shirt and a skirt. The young unmarried girls wore sheets and the older married women wore skirts.[586]
A young woman who had never been captured described her fear. "They are abducting girls and making them their 'ladies'," said Nyanchar, to explain why she had been in hiding before leaving her village of Ger. She knew some of the young women and girls who were abducted in 1999, including Chuoy Wat Keah who was about her age-eighteen. Chuoy Wat was taken with three girls from a village one hour from Ger. "Their mother came to our house and told us of the abduction by the renegades [Maj. Gen. Paulino Matiep's forces]. No one knows what happened to them. Their mother tried to follow but she could not find them. They were taken away this month [August 1999]," she reported.[587] Nyanchar had been hiding in the forest and going home at night to sleep. After hearing of the abductions, she fled to Nyal.[588]
Nyacuot, age twenty-five, had seven children and was born near Mayandit. Maj. Gen. Paulino Matiep's forces stole her property and her family's cattle, and abducted her in May 1999. They held her for four months at their camp in Boaw, more than fifty roadless kilometers north of Mayandit, before she managed to escape through a friend who had married into the clan at Boaw. Most of the time in captivity she did not do any cooking, cleaning, or carrying water. When she refused orders, however, the soldiers beat her. She said she was not a "wife" to them. Some of the men tried to take her as a wife (rape her). "Did you marry me before?" she told them. "I'm not your wife." She told them they had not paid any cattle to her father (as bridewealth) so she could not be their wife. For this, too, she was beaten.
Nyacuot saw no other captive women in the Paulino Matiep camp at Boaw, but she did see captive boys and girls. She talked with one girl and two boys, all about five or six years old, who said they were from the Bul and Dok sections of the Nuer. They talked only once before they were interrupted by the guards.[589]
Two Nuer women who fled from Ler to Nyal, Elizabeth N. and Martha N. (no relation), described the changing nature of the conflict in Western Upper Nile/Unity State and in particular the generalization of attacks against whole communities. Elizabeth N. echoed a familiar lament among those displaced:
When the fighting started at first [in 1998], it was only for men, but today [1999] it involves even women. If there is fighting, women and children can now be shot . . . .
Women who live here wonder if there are women in other countries who care about us. We are not ourselves now. We are victims. If there are women elsewhere in the world who can talk, they can assist us. Until now, women might decide not to give birth because the children do not reach maturity because of the fighting.
Martha N. added:
Because women give birth in places where there is no shelter, some die giving birth. They retain the placenta and are in great pain, and die.[[590]] Even the child born in a place without shelter dies of cold and other conditions in the bush. Even if you escape, the child could die because there is no food and you cannot carry him or her on your back. You must leave that child behind, and they die.
Some women have to carry the children because they have no husband [often killed or away in the fighting]. We are taking care of the children. If not, they become underage soldiers and are killed. Today there are no blind people here [a displaced persons area] because no one could bring them. The disabled also remained behind and did not move.
All these caretaker burdens go to the women because women take care of the blind, the elderly, and the disabled. The men take care of themselves, are armed, and can run.
We women did not cause the war. It's these men, but the worst of the war comes to us. Women have given birth to deformed children because of all the running up and down. I have seen three deformed children.[591]
Government Use of Antipersonnel Landmines
The Sudanese government began to use landmines in this area when its army advanced into Block 5A in 1999 and sought to protect outposts from rebel assault.[592] When the SSDF retook locations in Western Upper Nile/Unity State from the government in July 1999, it encountered landmines that the government had just laid in Ler (outside the Payak garrison), Adok, and Piling. One SSDF soldier participating in an attack on the government army garrison in Ler on July 3, 1999 saw three SSDF soldiers near him die when one of them stepped on an antipersonnel landmine outside the garrison. The mine was connected to a large antitank mine and caused it to detonate, killing the three immediately.[593] Another source noted that this deadly government practice of connecting antitank mines to antipersonnel mines had occurred in this area on other occasions.[594]
In July 1999, a landmine killed Kuis Boh, a civilian, and his fourteen-year-old son, John Kuis, on a road that passed by the Piling garrison. The chief reporting these deaths said government troops would go to Piling from Ler for ten days or a month, and while there would surround the Piling garrison with mines: "They put up no warning signs, because they are our enemies."[595] A Presbyterian pastor by the name of Day Yout, age thirty-two, was also allegedly killed by a landmine near Ler that July. As he was taking his cattle to graze, he reportedly stepped on a mine on the road that passed by the government garrison at Payak and led to the grazing area.[596] In Adok, a landmine killed three women and five cows on the road to the government garrison on or about July 20, 1999, when the women were going to look for food.[597] The deaths of six women in one group around the garrison in Ler-following landmine explosions-were reported in August 1999.
None of the six women died immediately, but there was no treatment for them in Ler, and they could not be medically evacuated by ICRC plane to the ICRC hospital across the Kenyan border because the Sudanese government had imposed a flight ban, which made the Western Upper Nile/Unity State area inaccessible to all agencies.[598]
Rebel Treatment of Prisoners
The SSDF and SPLA treatment of "Arab" prisoners, the "main enemy," as they put it, was sometimes in violation of the captives' human rights. As one SSDF soldier said: "if we capture, we kill them because they are taking our petrol."[599] The execution of three government employees who were seized at Ryer/Thar Jath in May 1999 is an example of summary execution based on political affilitation and ethnicity. There were other cases in 2000, but summary execution, even of northern or "Arab" prisoners, did not appear to be the rule, despite the quote above.
The Nuer rivals in the fighting in Western Upper Nile/Unity State reportedly tended to treat fellow Nuer prisoners with respect. None of the SSDF, SPLA, or Maj. Gen. Paulino Matiep forces killed captured Nuer combatants at this time, according to the SSDF, preferring to release them or use them as their own soldiers. One high-ranking SSDF officer stated:
We do not kill our own people. We come together as brothers. Some [of Maj. Gen. Paulino Matiep's soldiers] came to the hospital with us.[600]
The Sudanese government is fond of killing captives. We tried to keep our [Nuer] captives alive and send them back. We could not give them to the Arabs because they [Nuer captives] are Africans.[601]
Many times, however, SSDF officers and soldiers told Human Rights Watch that if they captured a Nuer combatant, he would be required to fight with them, i.e., switch sides. The fate of those who refused is not known. Requiring a captured combatant to change sides is a violation of international humanitarian law because of the inherent coercion involved.[602]
Unfortunately, as the Nuer-Nuer fighting heated up in 2000 and after, the Nuer could no longer claim that they did not kill their "own people" whom they captured. (See below)
Rebel and Government Militia Recruitment of Child Soldiers
The escalation in fighting in Western Upper Nile in 1999 resulted in increased recruitment of child soldiers by all sides.
By the Paulino Matiep Militia
The displaced Nuer complained in 1999 that-unlike 1998-Maj. Gen. Paulino Matiep's militia forces were recruiting boys[603] as soldiers by force on the spot, without going through the chiefs, the usual practice. "They did not take boys or young men in 1998. The jallaba [northerner] does this. It arms the Bul Nuer [Maj. Gen. Matiep's forces] to come and cause destruction."[604]
In 1999, witnesses observed that there seemed to be an explicit policy among Maj. Gen. Paulino Matiep's forces of abducting and recruiting boys by force. One young boy who had been abducted into Maj. Gen. Paulino Matiep's forces returned home to Ler and told local authorities and families that there were many other young Dok Nuer men who had been forcibly recruited by Maj. Gen. Paulino Matiep.[605] Once a group of recruits had reached platoon size (thirty-six) or company size (two hundred), all including the underaged boys would be sent for training.[606] During 1999, Maj. Gen. Paulino Matiep trained them in Boaw, unless there was insecurity there. During this time, the training lasted about fourteen days, and the youngsters and young men were taught how to shoot, load, and clean guns. Maj. Gen. Paulino Matiep organized them into fighting units by section or ethnic subgroup. Each unit was headed by a section leader who would be responsible for all members. The boys were generally used for guard duty and to occupy captured locations.[607]
By the SSDF
The recruitment practice in Nuer and Dinka areas, when carried out by the armed rebels of the same ethnic origin as the recruitment pool-that is, Dok Nuer commanders in the Dok area of Western Upper Nile/Unity State-was based on appeals to the chiefs to cooperate with the rebel movement. The chiefs would in effect serve as conscription officers, designating boys from the village to serve with the rebels. These conscripts often complained they had no choice. One Bul Nuer man said that when he was sixteen, in about 1998, a local commander went to the chief of his village, who selected for soldiers the first born and the youngest brother of the families. This young man thus was forced to go against his will.[608]
This "chiefs' system" of recruitment applied to all recruits, not just the underage ones. In about 1996, a Jagei Nuer man with two wives and several children was ordered by his chief to join the Riek Machar forces. Cmdr. Gatluak Damai, a Jagei Nuer commander then with Riek Machar, threatened that if this married recruit tried to escape, the commander would seize his cattle[609]-an extremely effective way to force compliance.
Many visitors noted the presence of underage soldiers (under eighteen years of age) among SSDF troops. SSDF leaders denied they recruited children and said they released young Nuer combatants they captured to their parents. This proved to be untrue.
Fighting Disrupts Demobilization of SSDF Child Soldiers in Ler, May 1999
The SSDF under Riek Machar admitted that it had some child soldiers in its ranks, and in 1998 agreed to participate in a UNICEF/Rädda Barnen program to demobilize its child soldiers. Rädda Barnen (Swedish Save the Children) collaborated with the Relief Association of South Sudan (RASS), the relief wing of Riek Machar's forces, in running a transit camp in Thonyor near Ler for demobilized child soldiers originally from the Ler area.[610] Most child soldiers had been "given" to Riek Machar's local commanders by the chiefs, so the commanders knew where the boys came from.
The Thonyor camp held some 280 boy soldiers, all of whom were interviewed and registered by social workers. Just before the fighting started in Ler in May 1999, staff working with these children were evacuated because of insecurity; all 280 boys in the transit camp scattered. Of this 280, an estimated one hundred to two hundred were redrafted by Maj. Gen. Paulino Matiep and Riek Machar in mid-1999, defeating the purpose of the demobilization. By August 2000, about 200 of the original group of 280, plus eighty-eight new child soldiers, had been reunified around Nyal and were under the supervision of Rädda Barnan and RASS.[611]
Cmdrs. Peter Gatdet and Riek Machar said they would demobilize the boy soldiers but they did not know what to do with them. Cmdr. Peter Gatdet, by then with the SPLM/A in the Bul Nuer corner of Western Upper Nile, demobilized the boy soldiers under his command in exchange for the promise of UNICEF school materials.[612]
OIL-CAUSED REALIGNMENT OF SOUTHERN REBEL FORCES AND ESCALATION OF WAR, LATE 1999
Overview
From May to September 1999, the government continued to fight behind its Nuer militia headed by Maj. Gen. Paulino Matiep and his zonal commander Peter Gatdet. This militia received weapons and other assistance from the government army. Their enemy, Riek Machar's SSDF, in turn received ammunition from the SPLA as of June 1999, marking the first material rapprochement between the SPLA and Riek Machar's forces since the SPLM/A split in 1991.
The SSDF forces did not then join the SPLM/A, but their realignment to an anti-government position in Western Upper Nile/Unity State marked the first step in what took two and a half years to become a formal reconciliation with the SPLM/A. It was only one of many realignments of Nuer forces that are ongoing as of the writing of this report.
At the time, this first step was significant. The second significant realignment of Nuer forces took place only a few months later, also seemingly provoked by the government's attempts to monopolize oil pumped from Nuer territory. Cmdr. Peter Gatdet, who beginning in early 1999 led Paulino Matiep's marauding pro-government militia through Block 5A, mutinied from Paulino in September 1999. Peter Gatdet captured the Mankien base, with its stores of ammunition and weapons. Most of Paulino Matiep's Bul Nuer soldiers mutinied with him, leaving Paulino with a shell of a militia.
Cmdr. Peter Gatdet's mostly Bul and Leek Nuer troops, poised in Block 4, their home area, were in an excellent position to take the war to the GNPOC oilfields-as Paulino Matiep had been to block Dinka/SPLA forces from reaching these oilfields. In late 1999, Peter Gatdet's troops turned around toward the oilfields and conducted ambushes that took the lives of several Sudanese, both oil workers and government soldiers, as army displacement from Block 1continued. Cmdr. Peter Gatdet did not consistently attack the oilfields, however, but became distracted by intra-Nuer fighting in which the government armed one side and the SPLM/A armed the other.
In early November 1999 many Nuer commanders made peace, including Peter Gatdet and Tito Biel, and formed an Upper Nile Provisional United Military Command Council (UMCC). Only Paulino Matiep and three other commanders remained of the pro-government Nuer militia in Upper Nile at the end of 1999; only one of them, Gabriel Tanginya, was in Western Upper Nile/Unity State, on the far eastern edge.
Rapprochement Between the SPLM/A and SSDF 1999
The government oil offensive of 1999 pushed some previously opposing southern forces back into alliance with one another. In his speech marking SPLA Day in May 1999, John Garang spoke of his willingness to welcome back all those who left the movement in 1991:
I wish to inform you that early this week, I personally talked over the HF [high frequency] radio with Cdr Tito Biel [of Riek Machar's SSDF], who is leading the resistance against the NIF [National Islamic Front, referring to the National Congress party in power in Khartoum] in Bentiu, and I have given him, and all those with him, my personal assurances and congratulations for the patriotic action they have taken to stop the robbery and vandalization of the Bentiu Oil by the NIF regime.[613]
When the SSDF commanders were defeated by the government and its Paulino Matiep militia in May 1999 and pushed out of Western Upper Nile/Unity State, Cmdr. Peter Paar Jiek was sent to Bahr El Ghazal to see if the SPLM/A could assist them against the government.[614] The SPLA provided ammunition on two occasions in 1999 to the SSDF Tito Biel forces.[615]
This was a significant development because, since the split in the SPLM/A eight years earlier, the two forces fought against each other much more than they had fought against the Sudanese government. Now, the SPLA was providing ammunition to the breakaway faction-that was technically on the government side-to attack the government.
This realignment was the result of many factors, chief among them that the SSDF, its political wing the UDSF, and its leader head Riek Machar no longer trusted the government to live up to its agreement and share resources with them. Despite this new cooperation, however, SSDF Cmdr. Tito Biel did not join the SPLM/A but maintained a separate SSDF command. The SPLA did not send any forces into the Nuer area to participate in the fighting, for political/ethnic reasons-until Nuer Cmdr. Peter Gatdet joined them in early 2000 and the SPLA had "its" sizeable Nuer forces.
When Human Rights Watch asked Cmdr. Tito Biel if Riek Machar, still in Khartoum, knew and approved of the new relationship with the SPLA, he stated that Riek Machar had not been asked about this SPLA cooperation because "when we are facing a problem in the field we cannot wait for Dr. Riek. We go to our brothers [southerners in the SPLA] and share our problem."[616]
Obviously, deniability was important for Riek Machar, the assistant to the president of Sudan, who remained in Khartoum with SSDF Chief of Staff Elijah Hon Top, ostensibly not fully informed of the activities of their commanders in the field-although their spokesmen were engaged in a war of press releases with the government on the progress of the fighting.[617] They fully understood the big picture, however, as Elijah Hon Top made clear: "[T]he Arabs want Paulino [Matiep] to be in control of the oilfields. He is the only loyal one. With our forces, they suspect we will not provide the necessary security. The current fighting came because of that. We claim the oil should be exploited with our participation."[618]
Renewed Fighting in Block 5A, July 1999
As the government was gearing up for the first export of crude oil, the fighting flared up again in Block 5A, which the government had just cleared of "rebel" SSDF. In a surprise move, Cmdr. Tito Biel of the SSDF, having secured ammunition from the SPLA, launched an offensive on July 3, 1999, in an effort to roll back Paulino Matiep's pro-government militia occupying strategic parts of Block 5A. As Agence France-Presse noted on July 6: "Fighting has resumed between two pro-government factions in a dispute over the right to guard oilfields in southern Sudan's Al-Wihda [Unity] state, one of the rivals said Tuesday."[619]
Within a week, Cmdr. Tito Biel's forces pushed their opponents back almost to their headquarters in Mankien. The fighting was in the opposite direction from its southerly May trajectory: in July, the SSDF went on the offensive north to Ler then to Duar, Koch, Boaw, and Nhialdiu, all in a matter of days.[620] On July 9, Maj. Gen. Paulino Matiep withdrew to Wangkei, and then to a place four hours from Mankien, safe in Bul Nuer territory.[621]
On July 8, 1999, the outbreak of fighting prevented the delivery of food to all 16,000 civilians deemed needy in Bentiu. On July 10, WFP and NGO personnel were evacuated from Bentiu for security reasons.[622]
The WFP feared "a worsening humanitarian crisis as it is unable to deliver urgent relief assistance to tens of thousands of people trapped by the fighting" further inside Western Upper Nile/Unity State. The WFP said:
WFP is extremely concerned for thousands who left their homes last month [June 1999] for safety and moved further inside Western Upper Nile as they are now even more difficult to reach. WFP is also worried that thousands who moved towards the bordering areas of northwestern Bahr El Ghazal and Jonglei will put extra strain on these areas still suffering from last year's [1998] devastating famine and floods.[623]
At the same time, the medical emergency agency Médecins du Monde (MDM), which had a long history of working in Mankien, evacuated its staff from that town as a precautionary measure.[624] As a result, it was able to immunize only 2,000 children against a measles outbreak, a small proportion of those exposed.[625]
At that point, with Maj. Gen. Paulino Matiep withdrawing to his home area, the government army intervened. Wangkei is a key garrison town in Block 4 where two tributaries of the Nile meet southwest of Bentiu.[626] These tributaries have been geographical obstacles to a military attack from the south (Bahr El Ghazal) on the GNPOC oilfields, and vice-versa, to a military attack from government bases in Western Upper Nile/Unity State on Bahr El Ghazal.
The government used Antonov aircraft and-for the first time in Western Upper Nile/Unity State-helicopter gunships to push the SSDF back from the garrison at Wangkei.[627]
At the same time as the agencies were pulling out of Bentiu and government planes were brought in to stop the rebel advance, Paulino Matiep's forces moved to "clean up" Bentiu. The UDSF/SSDF alleged that Maj. Gen. Paulino Matiep's forces went through another round of killings and abductions or arrests of UDSF civilian supporters in Bentiu on July 11-12, 1999. According to former Gov. Taban Deng and others, Maj. Gen. Paulino Matiep's agents abducted two UDSF (Riek Machar) state ministers from Bentiu: Choge Kiir de Juch, Minister of Social Affairs and Information (Pariang Dinka), and Lewis Keah Madut, Minister of Engineering Affairs (Bul Nuer). The agents were also alleged to have abducted Tang Gatket, a chief; Zaki Yarang, the (Dinka) commissioner of Pariang province; and two Dinka traders. All were reportedly taken from their homes at midnight on July 11-12. The two state ministers were allegedly killed by army or Paulino Matiep forces; the commissioner of Pariang was said to be wounded and in the hospital.
The Riek Machar camp believed that these UDSF/SSDF followers were killed in retaliation for, or anger because of, Cmdr. Tito Biel's July 3 surprise attack on the government/Paulino Matiep forces in Ler in Block 5A. Maj. Gen. Paulino Matiep's spokesperson denied the charges of assassination.[628] Human Rights Watch interviewed a former captive, (Simon) Magwek Gai Majak, appointed in 2000 by Riek Machar as governor of the area. Governor Simon said many of the captives were killed and that only he and ten others had survived. They were freed in September 1999 by Cmdr. Peter Gatdet when he mutinied and captured the Mankien base.[629]
The SSDF, again out of ammunition, started the long run south back to Nyal, chased by the government's Antonovs and gunships through Nhialdiu, Boaw, Duar, and Koch, on July 11 and 12, 1999. At least eleven civilians reportedly were killed, including two children, and many cattle. Taban Dengin Khartoum denounced government bombing on BBC radio,[630] which either stopped then or was already over.
On July 10, after it began its rollback of SSDF Cmdr. Tito Biel's forces at Wangkei, the government imposed a relief flight ban on Western Upper Nile/Unity State with disastrous consequences for the civilian population.[631] Meanwhile, the continued fighting in Block 5A during July 1999 forced thousands more civilians to flee to remote areas where the OLS (Southern Sector) was not able to investigate or assist them.[632] Nor could relief officials from the northern sector help, as Bentiu and Rubkona, and the Bahr El Jebel river along the Adok corridor, were declared no-go areas for all U.N. staff.[633]
Cmdr. Tito Biel managed one more military round with the government forces/Paulino Matiep militia in August 1999, with the same results: running out of ammunition, he had to fall back again and the cycle of displacement continued.
Khartoum Peace Agreement Talks Fail Again
On August 17, 1999, a UDSF spokesman said that talks to salvage the Khartoum Peace Agreement had only widened the gap between the government and Riek Machar's forces. He threatened that Riek Machar would leave the government unless the situation improved.[634] The Khartoum Peace Agreement's Southern States Coordinating Council , of which Riek Machar was president, had been unable to pay the salaries of its employees for three months, because the government had kept it short of cash; the government also terminated the incentives promised to former rebels, about 50,000 Sudanese pounds each.[635] Cutting off Riek Machar's ability to pay his many followers and their dependent large families seemed designed to pressure him to bring his forces into line.[636] Neither that nor a "national dialogue" conference worked.[637]
Pro-Government Militia Commander Peter Gatdet Mutinies Against Paulino Matiep and Government, September 1999
In September 1999, the government's most active Nuer proxy, Maj. Gen. Paulino Matiep, whose militia had borne the brunt of the 1998-1999 fighting against the SSDF on behalf of the government, was deserted by most of his SSUM/A troops. His number two, Zonal Cmdr. Peter Gatdet,[638] mutinied, capturing the Paulino Matiep garrison and arms depot at Mankien and taking several thousand officers and troops (Bul and Leek Nuer) with him. Cmdr. Peter Gatdet was said to have withdrawn the government-supplied ammunition and weapons to Rupnyagai and Nhialdiu. Paulino Matiep's prisoners held in Mankien-some captured during July 1999 from their homes in Bentiu-were freed by Cmdr. Peter Gatdet, according to one of them.[639]
Coupled with the SSDF (Tito Biel)'s quiet realignment with the SPLA, the Peter Gatdet mutiny radically changed the military and political equation in Western Upper Nile/Unity State, causing a sizeable increase in the number of anti-government Nuer forces and leaving the government with far fewer Nuer troops to act as its proxies in this oil area.[640]
Once again, conflict over oil was implicated in the new fighting. Reportedly, the Gatdet mutiny was blamed in part on Maj. Gen. Paulino Matiep (that is, the government) for "not giving pro-government militias salaries and part of the oil revenue."[641] Cmdr. Peter Gatdet told the London-based Financial Times that:
The government of Sudan is occupying our land and destroying our people because of this oil. . . . Wherever oil is found, they refer to it as an asset for the whole country; then they remove it from the people. There is complete displacement. . . . I made this move so I can attract the attention of other South Sudanese, so we can all come together and face a common enemy . . . . We have given enough warnings. If the oil companies don't leave, we will attack the fields and make them go.[642]
Cmdr. Peter Gatdet's shelling of Bentiu in September 1999 forced the WFP to suspend food distributions in the government garrison town for the week of September 19-25, adversely affecting thousands of needy civilians both in the town and as far as Ruweng County, where planned aid deliveries from Bentiu were canceled.[643]
The WFP and OLS received reports of bombings of Mankien on September 18 and 19,[644] most likely part of a government effort to retake the base. Civilians were injured and some killed, including some who had already been displaced from Mayom and were sheltering in Mankien. The government of Sudan denied flight access to Mankien and Nhialdiu from September 23 until the end of the month,[645] an indication that it did not control either town. The fighting forced many families to abandon cultivation of their lands. Families depending on small family granaries outside of Bentiu found their granaries burned down.[646]
Cmdr. Peter Gatdet targeted Mayom also, a government garrison town with a shrinking civilian population. On September 29, shelling was reported there, and civilians fled. Peter Gatdet's forces shelled Bentiu again in late September, fighting to within three kilometers of that garrison town, where Peter Gatdet's former commander, Maj. Gen. Paulino Matiep, put up resistance.[647] Relief organizations suspended all food aid to Mayom, and rations began to run out in special feeding programs for children in Bentiu and Rubkona.[648]
Clashes between Cmdr. Peter Gatdet and the government in October 1999 caused civilians to continue to flee from the garrison towns of Bentiu (Block 1) and Mayom (Block 4) to Rupnyagai (Block 4), Nhialdiu, Boaw, and Dorkhan (all Block 5A).[649] Even after arriving in these areas, these and other internally displaced people were unable to cultivate because of spreading insecurity.[650] The relief agencies predicted a severe food deficit would arise, starting with the hunger gap period-the time between planting and harvest-of April to September 2000.[651]
Fighting was heating up further south in Western Upper Nile/Unity State. On September 28, 1999, SSDF forces remaining around Ler (which they gradually lost and never managed to retake) claimed that they had wiped out a company of Sudan armed forces at the Piliny bridge between Ler and Adok, capturing two non-commissioned officers.[652] In early October, Chief Magai Reat Wuor, a Nuer chief elected to the Dinka-Nuer West Bank Peace Council at the Wunlit conference, was summarily executed between Koch and Ler by government troops under the command of Paulino Matiep, according to the New Sudan Council of Churches.[653]
Cmdr. Peter Gatdet's Troops Attack Oil Areas and Oilrig in Block 1, October 1999
Cmdr. Peter Gatdet had in the past blocked the advance of rebels to the oil areas. Now he turned his troops around and used the strategic position of the Bul Nuer to threaten the GNPOC oil operations. Relief agencies reported fighting in several locations in Western Upper Nile/Unity State in the week of October 11-17, marking a deterioration in security conditions. OLS security put almost all Western Upper Nile/Unity State locations off limits ("red no-go").[654] Then, after attacking a number of government positions in Blocks 1 and 4, Peter Gatdet lived up to the threat that he would target oil facilities there. In mid-October 1999, Cmdr. Peter Gatdet's troops attacked an oilrig in Talisman's Unity field. According to the SSDF, this was a diversionary strike to lure reinforcements to the rig. Among the reinforcements was a military vehicle that ran over an anti-tank landmine in the road laid by Cmdr. Peter Gatdet's forces. The landmine killed three Sudanese government soldiers, two of them officers.[655]
Neither Talisman nor GNPOC issued any statement regarding the military attack on what Talisman later told Human Rights Watch was its "Mobile Rig 15" inside the concession. A few months after the incident, Talisman's CEO Jim Buckee essentially agreed with the rebel version of events. He said it was his understanding that the attack on Mobile Rig 15 occurred on October 15, 1999, at night. Twenty or so intruders opened fire and the army soldiers stationed at the rig responded, according to Buckee. The shooting lasted about twenty minutes, and the intruders withdrew, leaving one of their own dead behind. Also killed were two Sudanese oil workers, employees of a subcontractor. Another Sudanese employee was injured in the buttocks by a bullet. Buckee confirmed that two or three Sudanese military men died when their vehicle ran over a landmine nearby, as they came to reinforce the soldiers at the rig.[656]
The OLS noted fighting on October 15 near Mayom.[657] An SSDF press release announced that Cmdr. Peter Gatdet's forces had badly beaten the Protectors of the Oil Brigade (Liwa Hamma al Bitarol) when it tried to come out of Mayom garrison on October 19. The SSDF claimed most government soldiers in the brigade were killed or wounded, some being drowned in the river.[658]
Meanwhile, the OLS reported that shelling was "ongoing" in Bentiu and surrounding areas,[659] and travelers arriving in Khartoum from Bentiu on October 21 told the press that Cmdr. Peter Gatdet was "bombarding" Bentiu. But Talisman said that its oil output was unaffected by the reported attacks on Bentiu and other garrison towns in its concession.[660] In a further denial, CEO Buckee said, "I don't know anything about it, and it seems unlikely because nobody down there has got any artillery."[661] But both the Sudanese government and the SPLA had artillery, as reported by agencies, travelers, and weapons experts.[662]
Government Recruitment and Diplacement in the Oilfields, October 1999
Government Army Displaces Athonj and Other Villages Near El Toor Oilfield, Block 1, 1999
Beginning in or before 1996, the army and government militias had gradually displaced the Athonj-Pagoi line of villages closest to Heglig, where Talisman had its base, in an area known as the El Toor oilfield (Block 2). By May 1999, according to a report of the Canadian government human rights delegation led by John Harker, these villages had been destroyed and their residents dispersed. Athonj/El Toor village itself was reportedly moved a few kilometers north of its original location.[663]
When personnel of the California-based nongovernmental organization Safe Harbor and a journalist flew into the relief airstrip in the rebel-held area of Biem in November 1999, they found about 2,000 ragged, starving, and disease-stricken displaced people, who said the army had recently forcibly "evacuated" them from Athonj and Gumriak. These areas, located northwest of the Biem relief airstrip, were within thirty-seven kilometers (seventeen miles) of Talisman's rigs, according to the residents.
"Government officials came and told us, 'We don't want anybody here, this is not your place any more because we have business to do here,'" according to Dhunya Chan, an ex-resident of Athonj. Chan said that three days after the warning, the army arrived on foot and in helicopters and started dragging people out of their homes. His mother-in-law was killed during this October 1999 attack, along with seven others in the village. The government troops then burned the villages to make way for the oil development, the former residents said,[664] despite the fact that many Athonj residents had already been displaced one time before for the same reason.[665]
Talisman's own report bears out the destruction of Athonj village. Talisman commissioned satellite images that purported to prove that there was no displacement from its areas. The image-reader of satellite images taken between 1965 to 2000, however, specifically noted that in the Athonj/El Toor area in Block 1, early images showed a human habitation at Athonj-but few traces of it were observed in the 2000 satellite photo of the same site. Another new indigenous strip village was located in 2000 for the first time, in another place in the same oil region, tending to bear out the testimony that the village was removed.[666]
Calls for Mujahedeen Volunteers
In response to the threat posed by Cmdr. Peter Gatdet's mutiny, and before the wet season ended in 1999, the government began recruiting more young "volunteers" from universities for the Popular Defence Force (PDF) militias, keeping its Islamist rhetoric high and its coercive tools sharp.[667] At a PDF ceremony in October 1999, President Bashir warned against anarchy and vowed to continue in the path of jihad[668] and martyrdom. PDF coordinating director Ali Ahmad Karti read out the names of the brigades that had been sent to the field, including the"Protectors of the Oil Brigade," and promised that more brigades would be created.[669] The minister of defense, as well as other high-ranking military officers and police, attended the ceremony.[670]
The same month, the president waved the nationalist flag and warned of expected U.S. aggression, accusing the U.S. of trying to block Sudan's development. He claimed that the exploration of Sudan's oilfields did not please the U.S. Every ministry and institution therefore had to provide a certain unspecified number of people to the PDF.[671]
Nuer Peace Talks; Formation of the Upper Nile Provisional Military Command Council, November 1999
In an attempt to end the fighting once and for all between Bul and other Nuer in Western Upper Nile/Unity State, a New Sudan Council of Churches peace team met with civilian and military leaders in Wicok, Western Upper Nile, on October 10, 1999. Cmdr. Peter Gatdet, recently defected from the Paulino Matiep militia, was present, as was Cmdr. Tito Biel of the SSDF, his former rival. Their discussions reportedly made progress. This was to be a prelude to a longer meeting. Maj. Gen. Paulino Matiep was not present. Shortly after the international press on October 15 reported this peace meeting in Wicok, the government bombed Wicok, despite a government ceasefire with the SPLM/A that covered this area.The OLS contemporaneously noted that the Wicok airstrip was hit and rendered unusable on October 17.[672]
In late October, there were further peace talks which included Paulino Matiep. The Riek Machar UDSF/SSDF, however, accused Paulino Matiep of summarily executing twenty-five SSDF officers in Bentiu on October 31, 1999, during ceasefire discussions. Paulino Matiep denied these allegations and said that some SSDF forces had died in combat when they attacked the town.[673]
In November 1999 there were further peace talks among the Nuer. One effort to reconcile the Lou Nuer was sponsored by the New Sudan Council of Churches. The Lou Nuer are the most numerous Nuer ethnic group, and live on the East Bank of the Nile.[674] After six months of prepatory work that culminated in a seven-day peace and governance conference in Waat, Upper Nile, from November 1-7, 1999, the conference issued a number of resolutions. The participants elected the Lou Nuer Peace and Governance Council to rebuild the entire civil administration structure from the bottom up, in theory surpassing what had been done at Wunlit.[675]
Separately, there was a meeting of Lou and non-Lou Nuer military commanders on November 2-4 at Waat.[676] They formed a military command council, the Upper Nile Provisional United Military Command Council (UMCC), which was to have supreme military authority over all their forces in Upper Nile. Participants included commanders or former commanders of Riek Machar's SSDF,[677] the SPLM/A,[678] and pro-government militias including that of Paulino Matiep. This group included some forces that had already been informally cooperating with each other.
According to the joint statement that followed the meeting, these Nuer commanders discussed the fighting in Western Upper Nile/Unity State and the Sudanese government's on-going production and export of oil from southern Sudan. The SSDF "de-linked itself from the . . . government" as of November 4, 1999. The commanders declared war on the government and a willingness to join forces with others fighting against the government. Their platform, unlike that of the SPLM/A, called for an independent south. Regarding Riek Machar, they "recognised the fact that he can no longer play any role" in the Upper Nile military situation, as he remained in Khartoum.[679]
Participants also formed a new political arm of the UMCC; it was named the South Sudan Liberation Movement (SSLM) after a similar political movement supporting southern independence during the Anyanya war (1955-72).[680] Dr. Michael Wal Duany became chair of the Interim Executive Committee of the new SSLM.[681] Although he spoke for the SSLM as early as December 1999, its existence was not formally announced until January 31, 2000.[682]
Fighting Continues between Southern Rebels and Government in Blocks 1 and 4, November 1999
While peace talks were taking place among Nuer on the East Bank of the Nile, fighting between Nuer government and rebel groups continued on the West Bank, around the oilfields. An SSDF military source claimed that SSDF forces killed at least 300 government soldiers in the two weeks starting November 10, 1999. Allegedly, government troops fired on the SSDF "without provocation" in Rubkona, a Block 1 garrison town, killing ten civilians and wounding twelve. The SSDF retaliated by ambushing government forces in Fangak on Zeraf Island (Cmdr. Gabriel Tanginya's area), some sixty-two miles east of Bentiu, on November 12.[683]
The situation in Bentiu was deemed "tenuous" by the OLS, and intensified conflict occurred around Wangkei and Mayom garrison towns. The U.N. told northern sector agencies to stay inside Bentiu and Rubkona and scale staff down to a minimum.[684]
In mid-November 1999, Cmdr. Peter Gatdet's troops attacked three military barges proceeding upriver from Malakal with reinforcements for Wangkei-a key garrison protecting GNPOC installations. Despite precautions, the barges were stuck in the sudd, or thick vegetation, in the river three hours east of Bentiu.[685] Peter Gatdet's rebel troops attacked them there.[686]
The barges were escorted by pro-government Nuer militia forces led by Cmdr. Gabriel Tanginya, based in Fangak, and Maj. Gen. Paulino Matiep. Their troops walked on both sides of the river, looting civilians of cattle and goods. The barges finally made it to their destinations, government army troops disembarked, and food was offloaded for the garrison. Cmdr. Peter Gatdet nevertheless claimed that his forces inflicted heavy losses on the government side.[687] The militias stayed in Wangkei some weeks and on their return set fire to vegetation at several places along the river to clear civilians and rebels away from the river's edge. Because of prior displacements, few residents remained on the north bank of the river (formerly Leek and Western Jikany Nuer territory). The troops dislodged and burned the tukls of many people living along the more populated south bank of the river.[688]
The Canadian human rights delegation led by John Harker visiting Sudan in December 1999 interviewed twelve head chiefs who had fled that area with their people. The team interviewed them near Nhialdiu in Block 5A, just over the line from Block 4. They were all certain about the reason for their plight: "We are going to lose our lives for oil," one civilian predicted.[689] Referring to their displacement, burned houses, disease, and dead children, he said:
The discovery of oil has caused these problems-before, in the 1970/80s, the Arabs weren't able to exploit the oil but now they can with the help of the west. The Arabs are united against us and want to push us out. We blame the Christian community because the war is being made a religious war. Why is the Christian world not helping us?
He also asked: "Aren't we included in the human rights of the world?"[690]
Another simply stated to the Canadians, "By the time your report is out we will be dead. The [government of Sudan] will kill us because you visited."[691] Indeed, government attacks on Nhialdiu (Block 5A) continued, and it was burned to the ground-again-in 2000 and 2002, when it was captured by the government.
THE OIL ROAD: NUER DISUNITY AND OIL DISPLACEMENT INCREASE, 2000
Overview
Faced with the new alliance created by Nuer disgust with his partnership with the government, and having little to show for this almost four-year collaboration, Riek Machar left Khartoum. His personal maneuvers in early 2000 to retain a significant political and military role in the affairs of southern Sudan played straight into the hands of the government. Just when it seemed that Nuer rebel unity was becoming a possibility, Riek Machar resigned from the government and returned to the south, where he created yet another political/military movement, the Sudan People's Defence Forces/Democratic Front (SPDF), which destroyed the nascent unity.
In February 2000, Lundin announced that the lack of a road had delayed its drilling operations in Block 5A. The government's dry season offensives of 2000 in Block 5A appeared designed precisely to capture land for, construct, and secure a road leading to Lundin's Ryer/Thar Jath fields and the garrison at Ler. A bridge linking Bentiu to the northern side of the Bahr El Ghazal (Nam) River had been completed in early 2000, surmounting a natural barrier that had protected Nuer from Baggara for centuries.
Cmdr. Peter Gatdet, rather than join Riek Machar, joined the SPLM/A. He was nevertheless cooperating with the (Nuer) SSDF, now SPDF, forces under zonal Cmdr. Tito Biel and Cmdr. Peter Paar Jiek. Together, they were trying, unsuccessfully, to stop the construction of the new oil road in Block 5A as well as further roads in Blocks 1 and 4.
But the Riek Machar and the Peter Gatdet forces fell to fighting each other again in late June 2000. In the ensuing months of fighting, where the SPLM/A armed one side and the government of Sudan the other, tens of thousands of civilians in Block 5A and 4 oil areas were uprooted. While the two Western Upper Nile Nuer forces were slugging it out, the oil companies completed construction of the all-weather road from Bentiu to Ryer/Thar Jath, Ler, and Adok by January 2001.
Riek Machar Resigns from Government and Forms Sudan People's Defence Forces/Democratic Front, February 2000
Riek Machar, who had been formally allied with the Sudanese government since the Political Charter of 1996, formally resigned from the government on January 31, 2000, from Koch in rebel-held Jagei Nuer territory of Western Upper Nile/Unity State.[692] He summoned his commanders and Nuer chiefs to meet with him there.[693]
Several commanders, chiefs, and apparently all the officials he appointed to the movement's relief arm, the Relief Association of Southern Sudan (RASS), answered his call and rallied to his side, splitting the Nuer of Western Upper Nile and throughout Sudan once again.[694] Cmdr. Peter Gatdet, said to be in Bahr El Ghazal meeting with the SPLM/A, was the most important commander who stayed away from the Koch gathering.[695]
At or after the Koch conference, Riek Machar announced the creation of the Sudan People's Defence Forces/Democratic Front (SPDF).[696] The leaders who had created the UMCC and SSLM in Waat just three months before could not hold these young organizations together in the face of Riek Machar's return. Indeed, at Koch Riek Machar was under the protection of commanders Peter Bol Kong and Tito Biel, both signatories to the newly-formed UMCC.[697]
The SPDF remained anti-government for several months in 2000, sometimes fighting together with the SPLA (under Cmdr. Peter Gatdet) against the government.[698] But the SPDF/SPLA alliance in Western Upper Nile/Unity State broke down in late June, with disastrous results for t7he civilians of that area.
Riek Machar's resignation dealt a severe blow to the government's Khartoum Peace Agreement and to its alliance with southern militia forces, of which his loyalists were the largest force. But it was not a death blow to the Peace Agreement, as Riek Machar had assumed it would be. Khartoum held out an olive branch to him, neither denouncing him, nor bombing his location in Koch, nor declaring the Khartoum Peace Agreement dead.[699] In time Gen. Gatluak Deng, the highest-ranking Nuer officer in the Sudanese army, was appointed head of the SSCC and the SSDF, whose chief of staff, after the death of Elijah Hon Top in the Khartoum military hospital, became Brig. Gen. Paulino Matiep.[700]
The government still had the loyalty of the commanders of Nuer anti-Riek Machar militias it directly funded: Paulino Matiep, Gordon Kong Chuol, Gabriel Tanginya, Simon Gatwich, and others. But the Riek Machar resignation, coming as it did after the mutinies of Philip Bapiny (1998) and Peter Gatdet (1999), was something for the government to worry about. Riek Machar remained the most prominent Nuer leader, nationally and internationally.
In late March 2000, Riek Machar, with several of his top military commanders, flew by private charter to Kenya, where they remained for several months.[701] These commanders included Peter Bol Kong, James Yiech, and Tito Biel. Peter Paar Jiek then became Western Upper Nile zonal commander. They all met with U.S. embassy officials in Nairobi. The purpose of the meeting seems to have been to demonstrate Riek Machar's following and viability. The U.S. embassy officials, however, did not react.
Government Offensives in Support of Road Building for the the Oilfields, 2000
In late February 2000, Lundin announced that the lack of a road had delayed its drilling operation at Ryer/Thar Jath.[702] The whole stretch of road from Bentiu south into Block 5A was passable in the dry season.[703] During the rainy season, however, April to October, and until the soil dried up in December, flooding and rains made it impossible for vehicles to pass, especially vehicles with the heavy equipment needed for oil exploration and production.[704]
Lundin announced a further delay in activity on Block 5A in late March 2000, this time "due to continued logistical difficulties and safety considerations."[705] In neither case did Lundin disclose that the war going on in Block 5A-in which several factions had recently switched sides and were against the government-posed the biggest practical barrier to resuming operations.
The Sudanese government was trying to remedy these problems: its initial 2000 dry season military objective appeared to be to capture land for, protect the construction of, and secure two all-weather roads for oil operations. The roads were built by the companies' consortia, which often used Chinese subcontractors with Chinese labor.[706]
It was vital for Lundin to extend the road from Bentiu south into Block 5A. It first built a bridge over the Bahr El Ghazal (Nam) River between Yoinyang and Bentiu in early 2000,[707] then a road-with a spur to the Ryer/Thar Jath exploratory well-from Bentiu almost reaching Ler and Adok. On this road it would be possible to drive from Khartoum straight to the Ryer/Thar Jath well site.Provisioning would be much easier. The government also sought to use the road to rotate and reinforce its troops in the Ler and Adok garrisons, where some troops tarried for a year under siege and food had to be flown in.
The oil road passes by Kuey, or rather what had been the village of Kuey. A U.N. official overflying the area saw the road that cut through what was a U.N. relief airstrip for Kuey. Her interviews with chiefs from the area who had taken refuge in Nimne, protected by several rivers from the oil road, confirmed that it cut through the village and relief strip for Kuey.[708]
The second area of roadwork was in the GNPOC blocks. It was necessary to build a road from Bentiu to Wangkei garrison (Block 4). This would eliminate the need to resupply Wangkei by river, where sudd and ambushes impeded delivery. More roads were also needed further west, into Block 4's Kaikang oilfields where more wells were to be drilled by GNPOC.
And more roads were needed inside Block 1, where oil work was expanding. In January 2000, the government announced: "Oil drilling has started in a newly discovered oilfield in the Unity State"[709] and construction work "has started on a 90-km road linking the field with Bentiu oilfields to the north of it."[710] A celebration reportedly was held at the site to signal the beginning of road construction, attended by the country's energy minister, Awad al Jaz, who urged the local population to help the company's staff.[711]
Fighting Along the Oil Roads, April 2000
In late March 2000, the combined SPLA/SPDF forces of Peter Gatdet and Peter Paar succeeded in forcing the government/Paulino Matiep militia troops back into the town of Bentiu, reversing some successes of the government's 1999 campaign. This led to government/Paulino Matiep alleged killings (again) of suspected SPLM/A/SPDF supporters in Bentiu in retaliation. Many Bentiu civilian residents then fled to Nimne, a rebel-controlled town northeast of Bentiu, to escape this persecution; some 1,430 were reported to have arrived in Nimne from Bentiu on April 4, 2000 alone. One head chief of the Leek Nuer in Bentiu told a relief official at Nimne that the revenge attacks killed at least 160 people and prevented 4,335 members of his community from leaving Bentiu.[712]
In April 2000, Khartoum undertook an offensive supported by hundreds of muraheleen (Baggara militia) on horseback. Backed by artillery, gunships, and Antonovs, they advanced from the garrisons in Wangkei and Mayom on Mankien and other locations controlled by Cmdr. Peter Gatdet. He succeeded in repulsing this offensive, but at a cost in casualties, villages, and cattle.[713]
On April 15, 2000, the combined rebel forces of the SPLA's Peter Gatdet and the SPDF's Peter Paar ambushed a military convoy from Bentiu heading to the government position in Ryer/Thar Jath with material and personnel for the oilfield, including many unarmed Chinese.[714] The first three cars in the convoy were civilian cars, driven by Chinese. After they passed by, according to one combatant present, the rebels attacked the military vehicles in the convoy, which included tanks. Many jumped out of the vehicles and started running. The convoy hastily turned around and went back to Bentiu. "No Chinese were wounded or killed," said the soldier. "They were wearing white shirts, no uniforms, and they did not have guns. We never saw them shoot."[715]
Another, larger convoy returned the next day. "Present were some Paulino Matiep troops, Arabs, mujahedeen-no muraheleen [Baggara]," according to the same soldier. The fighting continued for three days. On the last two days, the government forces faced only Cmdr. Peter Paar's SPDF forces, after Cmdr. Peter Gatdet recalled his troops to fight government troops in Rang (north of Bentiu). The Paar forces triumphed long enough for their soldiers to go into a vacated Ryer/Thar Jath location, see the trench that had been dug for what they thought was part of a pipeline, and destroy a twelve-inch-diameter pipe found at the site.[716]
Other ambushes on government of Sudan convoys between Ryer/Thar Jath and Bentiu during April-May 2000 had less success. As one participant said:
We did not capture any government soldiers or weapons. We attacked the convoy with thirty-nine vehicles-some of these carried rations and all carried soldiers. It turned and went back to Bentiu and reorganized. The second convoy had eighty vehicles, all military. We did not attack because we did not have sufficient troops. All the military on the convoy was government of Sudan.[717]
Reportedly, the rebel forces also attacked a bulldozer used for road work.[718]
According to the rebels, there was also road construction to Rang in Block 1, located north of Bentiu en route to Riik, an army garrison. As was often the case, among the rebels attacking Rang was a young Nuer man whose family had been displaced from nearby Riik years ago. The Sudanese military protected the road construction.[719]
One attack on Rang occurred on April 21, 2000. The rebels arrived silently at night and slept nearby. Early the next morning they crossed the swamp and went to a shallow river (water to the knees only) for the attack. As one of them described it:
The soldiers were going in front, clearing the way. The Chinese were building the road. We saw no southerners building the road. . . . Paulino Matiep used Chinese as recruits, soldiers, but I never saw the Chinese fighting. We are not really sure the Chinese are soldiers. They build the road with the support of the soldiers.[720]
The rebels opened fire on the government military convoy that morning, and claimed, "We won the battle at Rang."[721]
According to a press report citing a Nuer survivor, during this period government soldiers attacked and burned a Rik village north of Bentiu (Block 1), shooting all males older than fifteen or sixteen. The women and children, by this account, fled towards Bentiu; some drowned while being chased across the Bahr El Ghazal (Nam) River, while others were captured and taken in cars in the direction of Bentiu.
This witness said he escaped to the village of Guk, a day's walk south, and the army followed close behind. He hid and saw the soldiers kill two families, both known to him by name. In both cases, the men were killed with nails hammered into their temples and other body parts after an interrogation. The women were shot and children had their throats cut.[722]
An experienced journalist interviewed a Nuer from a village near the former market town of Rupnyagai-not near any of the ambush locations referred to above-who said that his sister and brother-in-law had been killed in an attack on Rupnyagai (Roub Nyagai) and several other villages near the Unity oilfield in 2000. His mother and brother were surrounded and killed when they tried to flee. He said: "All the soldiers wore the same uniforms. I saw no black person among them, only red [a word used by southerners to describe lighter-skinned northerners]."[723]
These Nuer made their way as far south as Pagarou, in the Dinka area of Rumbek County, Bahr El Ghazal. An SPLM/A relief official there said the number of displaced reaching his county had doubled from March to April 2000. They arrived in terrible condition, sometimes one to two hundred a day, many suffering from malaria and diarrhea, and all starved.[724]
In late June 2000, Peter Gatdet's forces set up an ambush for military lorries (trucks) as they passed through Rang en route to building the Bentiu-Wangkei road.[725] Military vehicles on this road had been ambushed before. One of the rebel soldiers described it:
They came in a convoy. The Chinese were with them, to build the road. We shot at the convoy. All were in lorries, with the soldiers in front, the Chinese at the end. The Chinese did not shoot.
When the shooting started, some soldiers ran, some stayed in the lorries. The soldiers in the lorries had big guns. [With our shooting] we stopped [the ones] on foot. They got back in the lorries, shooting. They were new army recruits combined with Paulino Matiep forces. We captured and burned two lorries. One lorry had a twelve mm gun, which we burned. The soldiers in the lorries were already dead.[726]
Five of the Peter Gatdet troops were wounded. One government soldier, a northerner, surrendered and was taken to Cmdr. Peter Gatdet's headquarters at Buoth.[727]
Twelve wounded government soldiers were captured. The rebel soldier continued, "An officer told us to kill the twelve who were captured because we could not carry them. . . . This is the first time I was ordered to kill the wounded."[728] This eyewitness was rotated out of the field early in the day but another combatant who remained there after participating in the ambush appears to corroborate aspects of his testimony (numerical differences may be attributable to time of day):
The [government] convoy was formed to chase people away so the government could build a road from Riik to Wangkei. We knew the Arabs [government soldiers] were coming and we laid an ambush where it looked like desert, Rang.
We captured twenty. Also some military vehicles and some lorries that were bringing food for the garrison at Wangkei. Most of the lorries were for the military and were empty. The soldiers jumped out and ran away. They were new recruits. They were all northern army, no militia. There were Chinese mixed in with them, because they were building the road.
The Arabs fought and then retreated to [the garrison at] Riik. Some used horses, some used cars, so we killed a lot of Arabs on horses. These were soldiers, not muraheleen. We do not know if the Chinese had arms. We captured two unarmed Chinese in Land Cruisers. They were released after they were shown to Peter Gatdet in Nhialdiu.
We captured some Arabs, mostly new trainees. We collected sixty in Rang. It was very sad. They captured our people and killed them, so we killed them in Rang.
We captured them, [then we] ran after those who went to Riik. [We] came back in the evening and killed the sixty prisoners. They were lined up in Rang. There were not enough clothes for us. So they were not blindfolded and not buried. They were left in the bush.
It was "very sad" because normally we fight over oilfields daily. They bring in reinforcements to take our oil. . . . This was the first time we captured such a big number. Usually we did not capture anyone. This was the first time we killed anyone after capture.[729]
According to the SPLA soldier, before the ambush, when Cmdr. Peter Gatdet heard that this army convoy was on the move, he told his forces, "They capture our people and kill them, so if you capture them, kill them."[730] Despite training in international humanitarian law, Cmdr. Peter Gatdet reportedly ordered his forces to summarily execute captured soldiers in clear violation of this law.[731]
In mid-March 2001, Christian Aid, a London-based charity funding relief, education, health, and community-building activities in southern Sudan, issued a report, The Scorched Earth: Oil and war in Sudan. Christian Aid researchers interviewed civilians from several of the villages south of Bentiu in Block 5A: Chotyeil, attacked in October 1999; Dhorbor, attacked in March 2000; Guit, attacked in May 2000; and Kuach, also attacked in May 2000. Helicopters were used in the first two attacks, in addition to the government troops that were used in all the attacks. On July 15, 2000, the town of Nhialdiu, then controlled by SPLA Cmdr. Peter Gatdet, was attacked by government militias, who burned everything down (again) and displaced all the residents, including the estimated 11,000 displaced persons from the oil road who had sought refuge there.[732] This is consistent with other reports and interviews, cited above.
Some civilians were displaced many times within Western Upper Nile/Unity State, until they finally left for Bahr El Ghazal or elsewhere outside the oilfield state. Some of the same displaced persons found in May 2000 in Nhialdiu had been burned out by the government's militia in the July 2000 attack, and displaced for a second time. Many then fled all the way to Bahr El Ghazal.[733]
Nuer Forces, Armed by Others, Return to Fighting Each Other, July-October 2000
SPDF Forces Receive Government Ammunition to Fight SPLA, June-July 2000
With the reemergence of Riek Machar as a rebel leader, fighting in the south between different Nuer militias heated up. There are many conflicting accounts of what happened immediately prior to the resumption of hostilities and the destruction of unity between the SPLA/Peter Gatdet and SPDF/Riek Machar/Peter Paar forces in Western Upper Nile/Unity State in June-July 2000-otherwise known as the "war of the Peters."
The SPDF claimed it was attacked in Nimne on June 26 by SPLA/Gatdet forces "for no reason."[734] The SPLA claimed that SPDF Cmdr. Peter Paar executed nine of its (Peter Gatdet's) soldiers in Nimne, which was the last straw after thirteen SPLA (Peter Gatdet) soldiers had been executed by Paar's SPDF troops in Koch in December 1999. For good measure, the SPLA/Gatdet added that Cmdr. Peter Paar was already cooperating with the government and for that reason had not stopped the bridge construction at Bentiu or the road to Ryer/Thar Jath, nor had pushed the government out of Ler.
Whatever the motivation, Cmdr. Peter Gatdet's forces moved on the SPDF location at Nimne, less than twenty miles east of Bentiu.[735] His surprise attack occurred not on June 26 but early in the morning of July 7, according to another eyewitness.[736]
It appears that Cmdr. Peter Paar's SPDF troops received ammunition at a place near Bentiu from the government militia under Maj. Gen. Paulino Paulino Matiep at this time,[737] although the SPDF denied it.[738] Peter Paar used this ammunition to push Cmdr. Peter Gatdet far back into his home Bul Nuer area, and was reportedly joined in this counterattack by Maj. Gen. Paulino Matiep's forces, who came out of Bentiu with 400 men to fight against his former deputy, Peter Gatdet.[739]
Riek Machar denied that his SPDF Peter Paar troops had conducted joint operations with the government/Paulino Matiep forces. He claimed instead that on June 21, 2000, some 150 of Maj. Gen. Paulino Matiep's troops had defected from the government and joined the SPDF south of Bentiu.[740] The SPLM/A, however, claimed to have radio intercepts between SPDF Cmdr. Peter Paar and the government commander in Bentiu proving that Peter Paar Jiek sent his commanders to the government in Bentiu to ask for help.[741] The latter is the more likely scenario, in light of later developments.
Government Completes All-Weather Road to Ryer/Thar Jath
The Western Upper Nile Nuers' absorption with revenge against each other, one side fortified by government ammunition, the other by SPLA supplies, served a useful purpose for the Sudanese government and, by implication, the oil companies. Lundin's nine-month report as of September 30, 2000, said the road construction was progressing well and testing operations should resume in first quarter 2001, with no mention of the war.[742] With the army heavily patrolling the road and no interference from rebels for months, the greatly improved road to the Lundin site was completed between September and December 2000.
A Journalist Travels the Oil Road, April 2001
In April 2001, Lundin invited Anna Koblanck, a Swedish journalist from DagensNyheter (Stockholm), on a trip down the oil road from Bentiu. The invitation was extended after the March 2001 publication of the Christian Aid report, The Scorched Earth: Oil and war in Sudan.[743] The report and accompanying publicity in Sweden condemned Lundin's role in Sudan.
The Swedish journalist subsequently wrote: "The people in southern Sudan do not catch a glimpse of any oil money."[744] She went on to say that while Khartoum was pumping billions of kroner worth of oil with the help of Lundin, "the displaced in Bentiu are starving to death."[745] She found that displaced persons were careful about openly criticizing the government, and that "international relief organizations do not make any official declarations out of fear of being forced to leave the area."[746]
The journalist quoted one woman as saying that her friend had died together with her four children when the (government) bombs landed around her, and noted that she was far from alone in her story. Others complained to the journalist that the oil companies did not hire any southern Sudanese, even as security guards.
The journalist traveled with Lundin's head of public relations Maria Hamilton and Lundin's head of security Richard Ramsey in an army car with four soldiers "to guarantee our security" along the oil road south. It was Hamilton's first visit to Sudan.
Anna Koblanck noted that "many villages along the road are empty. There are groups of gray grass huts where not a person can be seen." Lundin's head of security informed her that it was because the villages were not used during the dry season (April is at the end of the dry season), but according to the local population, no village is ever entirely abandoned. "If you see a completely empty village then something is wrong," the journalist was told by a young man from the area west of the road.
A chief displaced into Bentiu told the Swedish journalist that his village was burned down by government militias before the road was built, and that the road goes straight through the area that used to be his village. Three other villages had been burned along the road, one of them Dorang, which the journalist was shown on her Lundin tour. "It is not more than a pile of grass and branches on the ground right now, and the village itself is not much more than an army camp," she wrote, confirming the chief's testimony. "But under a tree there is a group of young boys wearing bright white shirts with Lundin's logo," she noted.[747]
The Lundin security officer explained to Koblanck that Lundin did not have any control over how its military partners conducted their operations. He said that SSIM (the name used generically for SSDF forces, which he described as the government-loyal militia) and the government army were in charge of security in the whole concession area. According to the security officer, Lundin ""was not allowed to talk to SSIM, for some reason I do not know. As a result we can not know exactly when they are going to attack somewhere, and most often we don't find out the reason until afterwards." [748]
Halfway down Lundin Oil's road was the village of Kuach, which the Swedish journalist visited. At one time, Kuach had reportedly been the home of 8,000 residents, but she observed a place that was "mainly just a camp for the SSIM militia. Hundreds of men are sitting in the shade of the trees with their automatic rifles close by. Many of them are just boys." Next to water wells that Lundin had set up she finally met civilians in Kuach: a few women who walked several hours to fetch water in that village. One said that her village was burned down a month before, forcing her family to live under a tree. When asked who burned it down, three SSIM soldiers quickly interjected that it was the rebels.
The journalist found out that a village "on the map located in the middle of the old road close to Lundin Oil's road" reportedly had been leveled to the ground. Some claimed that government forces had destroyed the village, while others said that guerrilla forces had burned it down. The journalist's translator was from that village, which he said was attacked eight months before (September 2000), at the same time that the road was being built. The attackers had abducted his wife and seven-year-old daughter.
In another location, near Lundin's second drilling location, Jarayan, journalist Koblanck saw that the drilling equipment was being moved to a third location in Thar Jath accompanied by the government soldiers. A local man said that women were raped by the government soldiers at the temporary army base at Jarayan. At her last stop, in Ryer near the third drilling location, Koblanck was told that the civilians there had fled to the small group of yellow huts because of hunger and needed a doctor, which the head of security had reportedly promised on his last visit to bring, but did not.[749]
Government-Armed Offensive Leaves Tens of Thousands of Civilians Uprooted, 2000
The situation of the displaced in Bentiu town, on the border between Blocks 1 and 5A, was already acute in early 2000. A December 1999 survey showed Bentiu had a global malnutrition rate of 26.3 percent, and the subgroup of displaced children (coming in from the fighting) had a malnutrition rate of 51 percent.[750] Some 2,000 newly displaced persons, most from Ler, arrived in Bentiu during two weeks in February 2000.[751] But renewed fighting limited WFP to rapid interventions, and only 26 percent of its planned distribution target for Bentiu was met in February 2000.[752]
The ICRC runs a large surgical hospital in Lopiding, Kenya, for Sudanese war wounded and others needing surgical care, including those from Western Upper Nile/Unity State. It announced that renewed fighting in various parts of southern Sudan had brought a heavy influx of wounded into its hospital. By May 2, 2000, the 560-capacity hospital had 646 patients. "This is the largest number of people we have ever had to care for" in Lopiding, said the ICRC Sudan coordinator.[753]
The July 2000 fighting between pro-government and anti-government Nuer forces left an extensive stretch of territory between Nimne and Nhialdiu burned to the ground and tens of thousands of civilians displaced. By July 28, 2000, thousands of civilians had fled with SPLA Cmdr. Peter Gatdet's forces as a result of the SPDF Cmdr. Peter Paar and Maj. Gen. Paulino Matiep's forces' attack.
Observers in a relief plane flying over the area between Nimne and Nhialdiu (some fifty kilometers or 22.7 miles) saw few people, huts, or cattle, and saw that a wide swathe of land had been burned to the ground as far as the eye could see. Many civilians from the area fled or were driven west and north; many thousands were seen to the west, with their cattle and mats (but no other possessions) camped on the banks of the Jur River (also called the Bahr El Ghazal (Nam) River) flowing north to Wangkei in late July 2000, during the rainy season. Those who could manage to swim across this swollen river with their cattle did so. Once again, Nhialdiu and its market were burned to the ground.[754]
There were an astounding number of displaced-up to 60,000-who fled with their cattle into Bentiu, counted by agencies assisting the displaced in the garrison town. Those who fled to the Jur River instead were neither counted nor fed, as the area was deemed too unsafe to assess and the government banned flights in to this SPLM/A-held area.
The fighting continued from Wicok, to Buoth, to Boaw, to Koch during the July-August period. The Peter Paar/Paulino Matiep government forces pushed the Peter Gatdet forces west over the Jur River, leaving only one Peter Gatdet toehold on the east side of the Jur River, in Buoth. Then, after being resupplied by the SPLA, Cmdr. Peter Gatdet proceeded in August and September 2000 to retake much of the area lost to Peter Paar's government-supplied SPDF forces.
Peter Gatdet's offensive turned south and took Koch in late September. In the course of capturing the village two experienced health workers, Stephen Gatdet and Paul Tap, were killed by the Peter Gatdet SPLA forces. When the SPLA attacked, the two, unarmed, tried to escape from the clinic, carrying the community medical supplies with them. The SPLA soldiers shot Paul Tap dead, seriously wounded Stephen Gatdet, and stole the medical supplies. Stephen Gatdet died the next day of his wounds, as did the mother of an infant. One man, shot during interrogation, also died that day.[755]
An assessment by a Sudanese NGO in early November 2000 noted that thousands of civilians from Bul and Leek counties ran to Bahr El Ghazal (Twic County) between July and September 2000, on account of this fighting between the Peters.[756] This NGO, Organization for Relief and Community Development (ORCD), with roots in the Bul and Leek Nuer communities, had access to two payams (subcounties) in Bul and Leek areas, and met displaced civilians and community leaders from Jagei and Jikany counties as well. They observed large numbers of displaced people returning to their homes, or what was left of them, months later from Bahr El Ghazal. In many cases such displaced people remained displaced; with nothing left of their homes they migrated to locations where they had a better chance of survival because of relatives, relief airstrips, or fishing.
The ORCD team estimated that the population of the Bul and Leek counties was between 430,000 to 500,000, based on their interviews with community leaders and local authorities.[757] The team also observed that there had been extensive burning of homes in the areas visited, and heard reports that other small towns such as Chaang and Boaw were burned down completely.[758]
There had been schools in the area, but they were reportedly destroyed or burned down in the series of attacks in 2000. Before the war came to this area in 1997, Bul County had more than eighty primary schools, with an estimated number of about 75,000 students, and Leek County had more than sixty primary schools with a scholar population of about 50,000. After the war's destruction, most of the older boys reportedly joined the rebel forces, willingly or unwillingly, and the girls resorted to marriage due to lack of schools.
The team noticed "conspicuous" numbers of child soldiers with the Peter Gatdet forces during their visit. The local authorities said there was no place else to keep them since there were no schools. They claimed that they had demobilized four hundred child soldiers in June 2000 but when full-scale conflict resumed in July 2000 they were taken back into the rebel forces.[759]
To the south, an MSF survey conducted in July 2000 sounded the alarm about malnutrition in the Padeah district of Western Upper Nile/Unity State, near Ler. This nutritional survey, in an extremely isolated and inaccessible area (due to its location between the Nile, swamps, and major tributaries) of 40,000 people, showed a pocket of four villages where the children surveyed suffered from more than 35 percent global malnutrition, and half of those were severely malnourished. It found that the recent armed conflict in Padeah had displaced almost 75 percent of the population, and 95 percent of the population reported cattle losses, also because of the conflict. The team also discovered that:
there has been virtually no NGO presence since June 1998. Insecurity surrounding the oilfields and Operation Lifeline Sudan's failure to clear the airstrip, which would open up this isolated area, have led to the lack of NGO access to this civilian population.[760]
According to MSF, even if the airstrip were cleared, the WFP did not have the food to respond immediately due to an undersubscription by donors. "'This makes the situation even more tenuous for the populations we are trying to serve.'"[761] In such situations, where not just one thing goes wrong but adversities cascade, famine is most likely to occur.
The U.N. noted that the conflict had intensified in this area in 2000, with many needy civilians inaccessible to relief agencies.
While humanitarian needs, in the wake of displacements and human rights violations, are very high, accessibility to populations remains problematic on the grounds of security and denial of access. Populations fleeing the conflict are assisted [when they arrive] in Bentiu and Northern Bahr El Ghazal, but cannot be reached in the initial stages of their displacement.[762]
As diseases such as tuberculosis and meningitis spread in Western Upper Nile/Unity State, the WFP predicted increasing food shortages for the whole state in 2000 due to a failed harvest and "insecurity."[763] It was worse than that; the U.N. concluded, "During 2000, the main conflict area has been in Unity State (Western Upper Nile) around the oil rich areas, with devastating effects on the populations of these areas."[764]
MORE PEACE EFFORTS, MORE FIGHTING IN THE OILFIELDS: 2001-2002
Overview
The government's highest-ranking Nuer army officer, Brig. Gen. Gatluak Deng, united the various southern pro-government militias under one command in Juba in April 2001, while the rebel movements remained fractured. An attack on Riek Machar's (and the U.N.'s) relief hub at Nyal, Western Upper Nile/Unity State in Block 5B by SPLA Cmdr. Peter Gatdet in February 2001 threatened the 1999 Wunlit peace agreement, but, following an emergency meeting of the peace council, no further attacks or reprisals were reported in that vicinity.
In Block 5A, the army and the SPDF local troops under Cmdr. Peter Paar guarded the road to Lundin's new well at Ryer/Thar Jath, and Lundin made progress in oil development until Peter Paar switched allegiances in August 2001. The two Peters-Peter Paar (SPDF) and Peter Gatdet (SPLA)- reached a standstill agreement in August 2001. Riek Machar formally joined what was left of his SPDF forces with the SPLM/A a few months later, in January 2002, after nearly eleven years of strife between predominately Nuer troops and the heavily Dinka SPLA; several of Riek Machar's officers joined the government rather than the SPLM/A.
In response to rebel military activity, the government called for further militia recruits, and also deployed the army, in particular in the GNPOC area. In Blocks 1 and 4 more oil roads were being built for new oil rigs, and at the Wangkei garrison the government hoped to build another bridge across the Bahr El Ghazal (Nam) River. In Block 4, tens of thousands of civilians were displaced in government army/helicopter attacks on the population in October 2001. When they had been cleared out, GNPOC located a drilling rig in the immediate vicinity, and the road from Heglig was extended to that rig.
In the December 2001-April 2002 dry season in Block 5A, the situation worsened for civilians after the John Garang (SPLA) and Riek Machar (SPDF) factions united and ambushed several convoys. The government launched a counter-offensive with Antonov bombers, helicopter gunships, Baggara horsebacked militia, Nuer militia, and government troops to drive civilians from the oil road and from the area of Lundin's desired operations. Lundin was forced by these conditions of insecurity to suspend work in Block 5A on January 22, 2002.
By that time, developments elsewhere seemed to hold out the possibility of peace in Sudan. An initiative led by former U.S. Sen. John Danforth, appointed U.S. envoy for peace in Sudan by President George W. Bush in September 2001, led in January 2002 to a six-month internationally-monitored humanitarian ceasefire in the Nuba Mountains, signed by the government and the SPLM/A. In March 2002 these two parties signed an agreement advocated by Senator Danforth to refrain from targeting civilians or civilian objects in the conflict.
In the course of newly-invigorated peace talks sponsored by the regional Intergovernmental Authority on Development (IGAD), the two parties surprised all but the mediators (led by a Troika of the U.S., U.K., and Norway) by signing a protocol in Machakos, Kenya, on July 20, 2002, agreeing to a southern referendum on self-determination with independence as an option after a six-month pre-interim and a six-year interim period. They also agreed that law of southern choosing, not shari'a, would be applied in the south and shari'a would be applied in the rest of the country during that period.
Political Developments Related to the Oil War
Southern Efforts to Unite Southern Militias in Government Territory
In April 2001, the southerners in the Khartoum government-appointed to fill the gap created by the January 2000 defection of Riek Machar and others-brought the different pro-government armed groups of southern Sudanese into one unified force. A conference of these militia (or armed groups, as they later preferred to be called, considering the term "militia" too derogatory) was convened in Juba on April 24, 2001, by chairman of the SSCC, Staff Brig. Gen. Gatluak Deng Garang, a long-time Sudanese army officer (of Nuer mother and Dinka father), who had never been in the SPLM/A or Anyanya. More than one hundred commanders attended.[765] The Juba 2001 conference concluded with the unification of the former rebel armed factions under the general command of Maj. Gen. Paulino Matiep-the government's most loyal proxy in the south. These forces continued to use the joint name of South Sudan Defence Force (SSDF), the name used by them when Riek Machar was their commander-in-chief from April 1997 until January 2000.[766]
The loyalty of the pro-government southern political and military forces to Khartoum was never a sure thing, and contradictions in the relationship with Khartoum abounded. SSCC Deputy Chairman Dr. Theophilous Ochiang, addressing the closing session of the unification conference, said that the objective of the conference was to unite the south for peace. He appealed to the army and security forces to cooperate with the southern state governments to this end.
The SSCC Deputy Chairman also criticized the Sudanese government army and security forces. He denounced rampant arrests by security agents of civilians in southern Sudan, and said that Juba security agents should not keep detainees in large metal shipping containers, as these were unfit for human accommodation[767]-an abuse long practiced in Juba and long denounced.[768] Even the southerners who were government loyalists criticised the government's treatment of their people, and the Nuer pro-government militias were often more strident about southern self-determination than was the SPLM/A.
The government of President Omar El Bashir was not enthusiastic about this new southern unity. The SSDF forces and the state governments in the south experienced prolonged periods of nonpayment of salaries and other expenses by the central government.
Wunlit Threatened by Continued Intra-Nuer SPLA/SPDF Fighting, February 2001
While southerners in government made efforts to unite their military forces, an attack on Nyal, an OLS relief center in Western Upper Nile/Unity State, in February 2001 by Nuer forces of the SPLA under the command of Peter Gatdet threatened to destroy the West Bank Nuer-Dinka peace agreement reached at Wunlit.[769] It was initially feared that the Peter Gatdet forces included Dinka. Fighting between West Bank Nuer and Dinka would imperil not only the Dinka civilians who had moved back to their border villages on the West Bank, trusting in Wunlit. It would also expose the tens of thousands of internally displaced Nuer who had taken refuge in Dinka areas in Bahr El Ghazal, likewise trusting in Wunlit, to danger of retaliation. The SPLA attack on the relief hub drew wide condemnation, including by the U.S. government.[770]
An emergency conference called by the Wunlit West Bank Peace Council was held in the Nyuong Nuer territory of Ganyliel, Western Upper Nile/Unity State in April 2001. The meeting was under the protection of Riek Machar's SPDF forces led by Governor Simon (Magwek Gai Majak) of Western Upper Nile/Unity State; he and his troops wore very new government-style uniforms. The conference ended with peace council support for continued peace and adherence to the Wunlit covenant. The civilian leaders present called on Cmdrs. Peter Paar and Peter Gatdet to meet with the West Bank Peace Council, speak out on and resolve their grievances against each other, and enter into a lasting ceasefire agreement.[771] Neither commander heeded the call to meet with the Peace Council, but no further attacks across the West Bank Nuer-Dinka border occurred. In August 2001 the two "Peters" came to an agreement to cease hostilities, and in late January 2002 the two commanders finally entered into a peace covenant with each other and the people of Western Upper Nile/Unity State.
SPLM/A and SPDF Talks and Merger, 2001-2002
SPDF Cmdrs. Riek Machar and Tito Biel left Nairobi in early 2001 and went to Eastern Upper Nile to rally support for their SPDF forces.[772] Riek Machar traveled to many areas of Eastern Upper Nile. He spoke to gatherings of his followers and urged them to join the SPLA, although his negotiations with the SPLA were far from concluded. One local leader who attended a meeting held by Riek Machar in his village in March 2001 said that Riek Machar urged that when they "had two factions they could not reach their goal of defeating the jellaba," so they should join the SPLA. When the people objected and said that they did not like the SPLA, Riek Machar insisted that they had to, they had "to have one government."[773]
Therefore many local SPDF forces and communities switched their loyalty to the SPLA. Some waited until the SPLA forces were close enough to make a switch without subjecting them to retaliation by the progovernment forces. Others participated in staged "attacks" on villages which resulted in SPLA "captures" of former SPDF locations-"attacks" in which there were no casualties.[774]
The reasons that local SPDF forces gave for switching loyalties were that the SPLA was "the first government of the South, the SPDF is doing nothing for our liberation;"[775] "I had decided that when the SPLA was near, I would go to it, it was in my heart. . . . there were many deaths between southerners and the one who really fights the 'jellaba' is the SPLA."[776]
When Riek Machar left Nairobi in early 2001 for Eastern Upper Nile, Taban Deng Gai, former Unity State governor and spokesman for Riek Machar's faction throughout its many incarnations, stayed in Nairobi and entered into negotiations with SPLM/A officials in order to settle the differences between the SPLM/A and the SPDF. A statement issued by both the SPLM/A and SPDF dated May 28, 2001 announced that they had agreed on the "organic unity of the two Movements under the SPLM/SPLA," an immediate ceasefire between their two forces, and a referendum for self-determination, among other things.[777] This was later challenged by anti-SPLA members of the SPDF, who claimed that those involved in the negotiations, Taban Deng Gai, Thomas Duoth Giet, and James Kok Ruea, had merely defected to the SPLA.[778] Immediately, a group called the "SPDF Peace Committee" issued a press release "clarifying" the declaration, characterizing it as "premature" and asserting that the two SPDF signatories were "not authorized by the leadership" to speak because consultations within the SPDF were not complete. Some of the leadership called an emergency SPDF convention to discuss the matter, scheduled for June 28, 2001, in southern Sudan.[779] Meanwhile, the SPLM/A spokesman Yasir Arman said that the merger had been achieved two weeks prior to the signing via a reconciliation meeting between Cmdr. Peter Gatdet (SPLA) and Taban Deng (SPDF) in the presence of Dr. Justin Yaac (long a close advisor to SPLM/A leader Dr. Garang). Then both Peter Gatdet and Taban Deng met with Dr. Garang.[780]
In the August-September 2001 period, Cmdrs. Peter Gatdet (SPLA) and Peter Paar (SPDF) ceased their fourteen-month hostilities by oral agreement. The agreement was finalized in writing during January 26-February 1, 2002 in Koch, Western Upper Nile/Unity State. This covenant, the product of the "people of Liech," although it was not clear that any communities were represented there, declared amnesty for all offenses against people and property committeed during the intense conflict between the two commanders, including the agreement that property looted and cattle raided were not to be claimed back. This covenant, reached under the auspices of the New Sudan Council of Churches, did not mention abducted women and children.[781]
On January 6, 2002, the talks between the SPLM/A and SPDF at the top level were consummated and John Garang of the SPLM/A and Riek Machar of the SPDF publicly signed the Nairobi Declaration of Unity, thereby merging the two forces. This new formation retained the name of SPLM/A. It retained the key goal of self-determination for the people of southern Sudan and, toward this objective, intended to "conduct immediate military operations against forces of the NIF regime, as well as to intensify all other forms of struggle."[782]
In contrast to the attempt at unity of May 2001, this merger appeared genuine. Garang and Riek met again on February 5 and 7, 2002, and signed another document with multiple provisions,[783] including creation of a Special Joint Committee to integrate the forces in command, rank, and organization. It also provided for the cooperation of civilian and relief agencies associated with the two movements. On February 8, the two commanders instructed their respective units to begin integrating on the ground. Garang declared that "[t]he way forward is . . . to defeat the NIF and achieve final victory."[784] These developments represented a clear threat to Khartoum.[785]
The SPLM/A had already concluded agreements with other opposition groups. On February 16, 2001, the Popular National Congress (PNC), a breakaway faction from the governing National Congress Party led by Islamist ideologue and NIF founder Hassan al Turabi, reached an agreement with the SPLM/A, to the surprise of most observers: the two had long been enemies. Garang, receiving criticism from his own supporters, downplayed the announcement, stating that it was "not an alliance, it's a dialogue."[786] The agreement resulted in the Khartoum government immediately jailing Dr. Turabi and many of his PNC officials. He remains in prolonged arbitrary detention with no charges against him as of the writing of this report.
On March 1, 2002 the predominantly northern Sudan Alliance Forces (SAF), an NDA member, announced its merger with the SPLM/A.[787] This brought to the SPLM/A the infusion of a small but experienced number of northern politicians and army officers whose platform supported a referendum for southern independence.
In early February 2002, however, Cmdr. Tito Biel, rejecting the Garang-Machar unity agreement of January 6 and Riek Machar's alleged failure to consult with the SPDF on it, defected from Riek Machar's forces and rejoined the Sudanese government.[788] His former oppponent Peter Gatdet joined him in late 2002.
U.S. Peace Initiative Under Senator Danforth, September 2001-May 2002
On September 6, 2001, U.S. President George W. Bush appointed John Danforth, a former senator, as his special envoy for peace in Sudan. Danforth was to report to the president as to whether the two main parties to Sudan's lengthy civil war-the Sudanese government and the SPLM/A-were ready for peace negotiations. Senator Danforth and his team of U.S. State Department and U.S. AID officials visited Sudan and the region in November 2001 and again in January 2002; team members made additional visits during this period.
Senator Danforth proposed four tests for the two main parties to the conflict to prove their commitment to a peace process: (1) a humanitarian ceasefire agreement in the Nuba Mountains, with international monitors; (2) an agreement by both sides not to target civilians or civilian objects in the war in the south; (3) the appointment of an international "eminent persons" commission to investigate and make recommendations for practical solutions to the problem of slavery/abductions in Sudan; and (4) respect for "zones of tranquility" in the conflict areas, enabling humanitarian agencies to carry out polio immunizations and campaigns against other diseases.[789]
Although fighting in Block 5A and continued government aerial bombardment of civilians throughout the south threatened to derail the talks, by late March 2002 both the government of Sudan and the SPLM/A had agreed to the four points. In particular, the Nuba Mountains ceasefire agreement was signed by both parties January 19, 2002, in Switzerland, and the agreement not to attack or target civilians or civilian objects was signed March 10 by the government and March 25 by the SPLM/A.
Senator Danforth's report to President Bush was made public on May 10, 2002. It summarized the state of compliance by the parties with the four agreements and concluded that the parties had shown sufficient commitment to finding a negotiated end to the war that the U.S. should continue its engagement.
This led directly to increased U.S. engagement as mediator, forming a "troika" with its allies the United Kingdom and Norway, in the peace negotiations starting in June 2002 in Machakos, Kenya. Those talks produced a protocol on July 20, 2002, that sought to dispose of the troublesome issues of self-determination for the south and the relationship between religion and the state. The second round of Machakos negotiations, stalled for weeks by what appeared to be power struggles within the ruling party in Khartoum and the SPLA capture of Torit, started in October 2002. As of the date of finalizing this report, the negotiations are on-going.
Military DevelopmentsBlocks 1, 2, and 4: GNPOC
The SPLM/A continued to announce military successes within the GNPOC consortium's territory, in 2001 scoring more attacks than in previous years. The first attack, according to Cmdr. Peter Gatdet, was on an exploratory drilling rig, the Tamur rig, in Block 4 on January 5, 2001, operated by CNPC. He claimed that the rig was located near Rumrum, and was abandoned after the attack because the rebels destroyed the containers that were used to house company employees.[790]
The Tamur rig was described as thirty kilometers north of the Bahr el Arab River (south of the river being the "fief" of Peter Gatdet), and in the highest risk location operated by GNPOC. It was assigned 400 Sudanese army troops with "technicals" to guard it. After the attack, more drilling was done, but the well was dry.[791]
Panaru, an area of Ruweng County in the Dinka enclave in Block 1, continued to be a target for the Sudanese army in 2001. Dinka chief Simon Thor from Panaru told a U.N. investigator that Panaru had been attacked by the Sudanese army and bombed at the end of January 2001, and again in the next few days.[792] This was not the first attack on Panaru; an earlier attack drove these Dinka to Nimne (Block 5A). Most moved back to Panaru in July 2000 because of the fighting that broke out then in Nimne between Gatdet/SPLA and Paar/SPDF/government forces.
The situation in Panaru then became insecure again. The chief said that the Chinese were building a road near Panaru and the army had installed a generator in the location. He reported that nearby was an oil installation and drilling was proceeding, with six wells.[793] The erosion of the population of Ruweng County by military means continued.
The SPLM/A claimed that it captured three wells near Bentiu on January 26, 2001.[794] Observers noted that SPLM/A claims did not always reflect reality on the ground: for no apparent reason the SPLM/A did not claim credit for each one of its attacks on oil infrastructure, while at times exaggerating the achievements of failed forrays.
SPLA Cmdr. Peter Gatdet said that his forces succeeded in closing down the Kaikang oilfield (which spans Alor Dinka and Leek and Bul Nuer territory north of Mayom, in Block 4) on February 25, 2001, where he claimed a Norwegian company was operating. Cmdr. Peter Gatdet's forces also reportedly seized the oilfield in Boaw (Block 5A), thirty kilometers from Buoth (then Peter Gatdet's headquarters, in Jagei territory) in March 2001. These were operations where the rebels attacked and withdrew, not trying to hold territory.[795]
Then, during the rainy season (May-November), SPLA attacks on oil-related targets in the GNPOC concession seemed to pick up. The SPLA claimed to have "annihilated" a military convoy in June 2001 escorting oil industry equipment, at a location between Wangkei and Mayom in Block 4. The SPLA claimed it fought for five hours and inflicted 244 casualties on government forces, and destroyed significant military and construction equipment, including four bulldozers, five motor graders, forty-six trucks, two water tankers mounted on trucks, twenty-one Land Cruiser and Nissan pickups belonging to the oil company, and other equipment.[796] The government denied the attack.
This attack was largely confirmed by a foreign journalist. On June 8, 2001, Swedish journalist Peter Strandberg watched from the sidelines as Cmdr. Peter Gatdet, whom the SPLM/A press release said had directed the attack, and his 800-man force ambushed a government convoy at night on the road between Wangkei and Mayom in Block 4. The journalist reported that Peter Gatdet's forces killed 360 government soldiers and ten oil workers while sustaining the loss of only ten SPLA soldiers. The rebels also destroyed thirty vehicles and looted the dead of all their possessions, returning to Buoth to celebrate their victory. Buoth was at the time a town overpopulated by thousands of civilians displaced from their home villages in the region by government soldiers.[797]
An SPLM/A press release said that on July 1, 2001, SPLA forces ambushed and destroyed an oil convoy only thirty kilometers out of Bentiu town. The SPLM/A said that three days later, on July 4, it attacked another government convoy en route to Wangkei garrison from Bentiu. After three days of fighting, this convoy, consisting of an infantry brigade and local militia groups, was reportedly "completely routed" and forty-eight soldiers were killed, thirty-five wounded, and many more taken prisoner. The convoy was said to have been going to Wangkei with a military engineering company to build a railway line to northern Sudan. Various military materiel was captured. The government denied that any such attack took place.[798] There was no independent confirmation available of these attacks.
When the SPLA attacks stepped up in mid-2001, President Bashir rallied workers to send their militias to the oil front, vowing "never to relinquish the oilfields," and that the government would "continue going along the path of jihad and martyrdom."[799]
The most significant attacks, in publicity terms, occurred on August 4-5, 2001. An SPLA unit attacked the GNPOC consortium field headquarters at Heglig, damaging an oil storage tank and a helicopter on the ground[800] that probably belonged to an oil company.[801] At the same time, the Gatdet/SPLA forces attacked the government garrison at Wangkei. Both attacks were initially denied by the government, but Talisman admitted that Heglig had been targeted, with minimal damage. It said it halted pumping of oil for a few hours as a routine security precaution.[802] Heglig, however, is far north of Peter Gatdet's usual territory.
Following the oral standstill agreement between the the two "Peters," SPLA Cmdr. Gatdet and SPDF Cmdr. Paar in August 2001, the SPLA stepped up its attacks on the oilfields. It claimed to have killed 429 Sudanese soldiers during October 12-19, 2001 attacks on Pariang and Bentiu towns in Upper Nile (Block 1) and Fom al-Zaraf in Bahr El Ghazal (Block 5A). The SPLM/A said it temporarily occupied the armed forces' headquarters in Bentiu before withdrawing. Apparently the SPLA did make an incursion into Bentiu, because the governor claimed that the SPLA had killed seven people in this attack on the capital. The SPLM/A also stated that a 105-soldier pro-government militia switched sides during the fighting in Fom al-Zaraf, Bahr El Ghazal, providing the SPLA with 191 Kalashnikovs and ammunition.[803]
Meanwhile, also in October 2001, the Sudanese government launched another offensive in the GNPOC oil concession, in the southeast part of Ruweng (Panaru/Pariang) County (Blocks 1 and 5A). It attacked the villages between Jukabar and Bal from the air and followed up with ground troops. Helicopters flew low enough that the wind from their blades parted the bush and enabled their gunners to see and fire at civilians hiding there, according to witnesses. Children as well as adults were killed in these attacks. Others were killed by "technicals" riding into their villages. The government attackers encountered no armed resistance but caused the population to flee to two areas of swampland in northeast and southeast Ruweng County, according to investigators for the advocacy NGO European Coalition on Oil in Sudan (ECOS). An estimated 80,000 persons were so displaced.[804]
One month later, in November 2001, GNPOC moved a drilling rig into Pakier, just to the west of the depopulated area, suggesting that the military attacks were intended to clear the way for the expansion of oil production in that sector. Witnesses still in the area saw the light on the top of the GNPOC rig at night. In March 2002, Chinese workers started building an extension of the Heglig road to Manawal in the direction of Bal and Jukabar, the new government garrison. Civilians who attempted to return to the Pakier area found anti-personnel landmines around the watering points and pathways to areas where women collected wild food, leading to reports of deaths of animals and some people, and deterring the residents from returning.[805]
Use of GNPOC Airstrips
In April 2001, a Canadian and British nongovernmental investigation team visited the rebel-held areas of the GNPOC concession, having failed to secure a visa to visit the government side. The team found:
an intensification of armed attacks on civilians in Sudan's contested oil region in Western Upper Nile during the past year [2000-2001]. These attacks have been carried out by government forces and pro-government militias and also by rebel forces. A significant new development is a higher number of direct attacks on civilians by the armed forces of the Government of Sudan. In particular, the team found that government forces launched increasing numbers of helicopter gunship attacks on civilian settlements in or near the operational area of the [GNPOC] oil consortium that includes Canada's Talisman Energy. Some of these helicopters operate from facilities built, maintained and used by the oil consortium. These attacks appear to be part of a renewed Sudan government strategy to displace the indigenous non-Arab rural population from rural areas of the oil region in order to clear and secure territory for oil development.[806]
Many civilians in the oil areas interviewed by press and human rights investigators have reported that they were driven from their homes by helicopter gunships.[807] Many such helicopters were based at oil company airstrips. After visiting the Talisman project in early 2001, the Canadian consular official based in Khartoum reported that two Hind helicopter gunships had been stationed at Unity Field (GNPOC) for about a month, flying sorties almost every day, taking on large amounts of ammunition and unloading none. A third Hind had been put out of action by excessive dust in its air intake. (These three helicopters constituted perhaps one-half of the government's fleet of combat helicopters.)[808] This was corroborated by two young southern men who defected from the government army base at Heglig in April 2001. They reported that two helicopter gunships were based at Heglig, the location of the GNPOC long air strip and field headquarters as well as the site of the large Heglig army base.[809]
The combat range of a Hind helicopter gunship, when fully loaded with weapons, is about 160 kilometers, according to Jane's.[810] This range is ideal for helicopters based in Heglig or Unity projects in the GNPOC concession. Heglig to Mayom or Unity airstrip is roughly one hundred kilometers. On the Block 5A Lundin side, Unity to Wicok is seventy kilometers, Unity to Ryer/Thar Jath is sixty kilometers, and Unity to Ler is 110 kilometers, as the crow flies. As Talisman admitted, each oil facility is guarded by the military.[811]
Block 5A, Early 2001
In early 2001, the forces of SPDF Cmdr. Peter Paar were guarding the oil road in Block 5A. The Sudanese government-appointed governor of Upper Nile, John Dor, confirmed this in a statement to the Lundin board of directors in Stockholm in May 2001.[812] Peter Paar's SPDF forces received arms and ammunition from the government of Sudan via the Paulino Matiep forces.
The Sudanese government, however, still preferred to protect the oil development projects with non-southern troops, that is, government troops commanded predominantly by northern officers.[813] The government nevertheless continued to rely on the protecion of the outer ring of oil development by government-friendly southern militia. One Nuer chief sent his people to investigate the Ryer area and they reported back to him that there were Chinese workers, who used vehicles that operated in the water and on dry ground. The Chinese workers were guarded by northern army soldiers.[814] This army presence, reinforcement, and provisioning were greatly facilitated by the oil road, on which the government army could use military trucks year-round at a faction of the cost of helicopter or other air resupply.
Gov. John Dor also told the Lundin board of directors that there was no civilian population displacement from Lundin's area of operations[815]-although the latter allegation was blatantly wrong.
This was borne out by continuing human rights and other research done by nongovernmental human rights investigators in the area and OLS personnel. For example, the oil consortium and government built the Block 5A oil road through the middle of a village known as Kuac. Chief Peter Ring Pathai, the head chief of Kuac, reported to an OLS interviewer that the village of Thar near Kuac had been bombed ten times as of February 2001 in a government effort to displace the population.[816]
Many activists in sympathy with the SPLM/A made spot visits to Western Upper Nile/Unity State, but without finding many civilians. Rev. Gary Kusunoki, a Californian missionary, visited Nhialdiu in Block 5A in March 2001, in the company of a Newsweek journalist.[817] Both the reverend and the journalist reported that villagers told them that Nhialdiu was burned out in fighting on March 5, 2001. In a statement to the U.S. Congress, Rev. Kusunoki said that the attack was conducted by the SPDF, "a government backed militia."[818] The reporter observed that "Nothing was left of the town of Nhialdiu,"[819] and observed from the low-flying plane that dozens of other villages also lay in ashes, deserted.[820] The missionary estimated that more than 25,000 people had been displaced as a result of the attack, and had moved further south.[821] The basis for that estimate, however, was not provided.
Newsweek reported that hardly any people gathered for the food distribution and preaching offered where their plane had been directed to land; Nhialdiu was on the front line, the journalist discovered when the artillery barrage started. The missionary had to leave the supplies with the rebels; Cmdr. Peter Gatdet said that he would keep only 25 percent of the food and distribute the rest to the needy. A senior UNICEF official in Nairobi suggested to Newsweek that such freelancers (as Rev. Kusunoki) simply became the tools of the SPLM/A.[822]
The Military Tide Turns Toward the Rebels in Block 5A, Late 2001-2002; Lundin Suspends Operations Again
With the onset of the dry season in late November 2001 and the Gatdet/Paar and SPLM/A/SPDF standstill agreements, the rebel forces began to attack more government military targets in Block 5A. SPDF Cmdr. Peter Paar Jiek had been guarding the Lundin installations in Block 5A since 2000. He switched sides in August 2001, and ceased to guard the Lundin project against SPLA attacks after that.
On December 9, 2001, near Old Fangak on the border of Block 5A, the SPLA attacked the pro-government Nuer commander Gabriel Tanginya.[823] The U.N. received a report that the attack was actually on Tanginya's forces at the government garrison in New Fangak.[824] Paulino Matiep arrived three weeks later, however, with a 1,000-man militia, and managed to recapture Old Fangak briefly, but lost it to the SPLA again on January 7, 2002.[825]
In December 2001, a Lundin helicopter was shot and its pilot gravely wounded about one hundred kilometers south of Rubkona.[826] According to confidential sources, the helicopter was shot at by members of the Paulino Matiep militia after the Lundin pilot refused to give them a ride.[827]
Of greater significance was the rebel push on the Bentiu to Ryer/Thar Jath oil road to try to close it down. The rebels conducted a series of ambushes on reinforcement convoys traveling on that road. The SPDF issued press releases (in the name of the reunited SPLM/A) stating that it had repeatedly attacked enemy garrisons of Pultutni (for Ryer/Thar Jath), Kuok, and kilometer 40, killing enemy soldiers on December 26, 2001, and January 13, 2002. During the December 26 attack, the SPDF claimed, it captured eleven pieces of seismic and road equipment worth millions of dollars.[828]
The SPLM/A also announced that it had repulsed a large convoy of about 7,000 men, comprising regular army soldiers and several "tribal militias" supported by two helicopter gunships and an Antonov bomber. It ambushed that convoy on the road between Nhialdiu and Bentiu on January 14, 2002.[829]
On January 22, 2002, Lundin announced that its operations in Block 5A would be suspended "as a precautionary measure to ensure maximum security for its personnel and operation."[830] The helicopter shoot-down, the defection of the pro-government militia guarding its installations, and increased ambushes combined to cause Lundin to suspend activities.
Although Lundin had announced this suspension, the Sudanese army continued to use the oil road and to reinforce and guard the oil locations. The SPDF reported that its forces, led by Alternate Cmdr. Daniel Ruai Makuei, ambushed a government convoy between the Ryer/Thar Jath garrison at Pultutni and Mirmir on January 23, 2002, killing sixty-three soldiers, capturing two soldiers alive, and capturing various amounts of weapons.[831]
According to the same rebel press release, two days later, on January 25, 2002, SPDF Cmdr. David Gatluak Damai engaged a government convoy at Kuac, forty kilometers south of Bentiu, killing 102 enemy soldiers and capturing four alive on the oil road.[832] Other sources reported that on the same day SPLA Cmdr. Peter Gatdet ambushed a convoy of two hundred conscripts the Sudanese government sent to reinforce its Pultutni garrison and protect Lundin's rig at Ryer/Thar Jath.[833] The SPLM/A claimed the deaths of 198 government soldiers in that ambush. Cmdr. Peter Gatdet reported after this engagement that he controlled the old road leading to Ryer/Thar Jath.[834]
A team of human rights investigators separately reported that the government used Antonovs to bomb Koch on January 24, 2002, and helicopter gunships to attack Koch, Ler, and Mayandit on January 25, 2002.[835] The rebels confirmed that they were engaged in the Ler vicinity: an SPDF press release said that on January 26 the government soldiers tried to return to their Ler barracks from Payak airstrip, a distance of five kilometers, but the SPDF beat them back to the garrison at Payak airstrip, killing fifteen enemy soldiers with losses of two SPDF soldiers.[836]
Government Counter-offensive in Block 5A, 2002, Displaces Civilians
The government dry season offensive (or counteroffensive) in early 2002 caused the flight of civilians living on the Block 5A/Block 4 border, in Rupnyagai and Buoth near the Barh El Ghazal (Nam) River. "A long range artillery gun placed in the government garrison town of Wangkai was able to reach Buoth and surrounding villages. This coupled with the ground troops forced people to flee south across the streams to Wicok and then further south again to Chotchar," investigators reported.[837]
The government resorted to targeting Nuer civilians who lived along the road, according to investigators.
The Nuer civilians that lived along the oil road said they were free to do so in 2001 due to the 'period of cooperation' between GoS and the SPDF [Cmdr. Peter Paar], a major southern opposition movement. This cooperation came to an abrupt end when the SPLM/A and SPDF agreed to unify and fight a 'common enemy,' the [government of Sudan]. The civilians then became targets again. Now, these Nuer have joined the ranks of the displaced and are living in Touc, Chotchar and Wumlit, south of Pam [the marshy areas in the southern Block 4].[838]
As part of the clearance campaign, the Sudanese government launched what investigators called "a vicious air attack" on the civilian populations around Pultutni (the garrison for Ryer/Thar Jath) in late January 2002 and Ryer/Thar Jath in February 2002. "Everyone interviewed stated that the gunships came in pairs three times a day when the villages were under attack, as high altitude Antonov bombers flew overhead."[839] The ground forces came from the garrisons at Ryer/Thar Jath and Bentiu, burning and looting villages. Some of the displaced walked west to Wicok, a distance of eighty kilometers (thirty-six miles), across numerous swamps and rivers under cover of darkness.
This was part of a larger campaign of civilian destruction and displacement through aerial bombardment.[840] The ground forces included the horsebacked Baggara, used for the first time south of the Bahr El Ghazal (Nam) River, who crossed the river using the oil company-built bridge.
Other targets for displacement were villagers who lived near Nhialdiu. An investigative team from Christian Aid and DanChurchAid visited several locations in Rubkona County south of Bentiu in late March 2002, following the trail of displaced persons fleeing south from the fighting launched by the government in the Nimne-Nhialdiu corridor in Block 5A.[841] The team visited the villages of Wicok, Mayaluok, Chotchar, Tuoc, and Pam and interviewed local leaders and displaced civilians. An eight-year-old boy who had lived in a small village near Nhialdiu said that after the Antonovs and helicopter gunships, the horsemen and ground troops advanced on his village. "They ride two to a horse . . . . One is riding the horse while the other is behind shooting at us with his gun." The boy and his cousin ran toward the grassy swamps at the edge of their village to evade the horses, but gunships flew low overhead, and the boy's cousin was shot in the back of the head and killed.[842]
A displaced woman who fled a village near Nhialdiu said, "The horsemen [Baggara] chased the people to the river and shot at them as they struggled across burdened with young children and the elderly. Even pregnant women were not spared," she said, referring by name to two young women near term who were shot by the horsemen in this exodus.[843]
The team concluded that the "Government of Sudan is deliberately targeting civilian populations, resulting in the displacement of the majority of Rubkona County."[844] This military activity also resulted in many civilian deaths from "being bombarded by Antonov planes, strafed by helicopter gunships and rockets as well as being chased into rivers and streams by armed horsemen [Baggara] and foot soldiers."[845] According to the team's report, "All this is done because of the oil. Rubkona County sits on large reserves of oil that Lundin Oil Company of Sweden has the concession to exploit."[846]
A researcher from KAIROS, a Canada-based ecumenical initiative, extensively documented a separate government attack on January 27, 2002, which caused the immediate displacement of hundreds of people from the town of Mankien, Western Upper Nile/Unity State, in Block 4, west of the oil road.[847] The displaced gave terrifying testimonies of the Sudanese government's attack on Mankien, a town teeming with displaced people where the SPLA also had a presence. Days before the ground offensive, the government began high-altitude bombing with Antonov planes, indiscriminately striking the civilian population.[848] Then, before dawn on January 27, government soldiers and allied militia attacked, with the sleeping villagers as victims.
Those who survived the attack all told a similar tale. The government forces killed those who could not run away from the onslaught. One survivor said that the government forces "came in the early morning when people were sleeping. . . . . They raped girls and killed many people. Our village was destroyed. . . . I don't know why we were attacked, they just came and killed people."[849] Helicopter gunships provided support for the forces on the ground.
Those who survived walked for two to three days without food or possessions to Maper in Twic County, Bahr El Ghazal. Based on the testimony of aid organizations, churches, foreign aid agencies, the SPLM, and the displaced Nuer, the KAIROS investigator estimated that 500 civilians were displaced from their homes as a result of the one attack,[850] signaling a heightened campaign of intentional forced displacement around the oilfields.
Government troops spread out also on the other side of Bentiu, in the displaced haven of Nimne twenty kilometers northeast of Bentiu in Western Upper Nile/Unity State. MSF-Holland evacuated its basic health care unit and kala azar treatment center there on February 1, 2002, after rebel warnings that government soldiers were approaching. After a week, MSF-Holland returned and found that all its medical supplies and equipment had been looted, as had the property of the civilians living there. The civilians said that Cmdr. James Lial (Diu) was responsible; he was formerly with the SPDF Riek Machar forces, and at the time with the Sudanese government/Paulino Matiep militia.
In this Sudanese government dry season offensive on the Nhialdiu-Nimne corridor in Block 5A, both sides took heavy casualties, as described in detail by an American NGO employee of military background who was present on the Nhialdiu end of the corridor:
At 2 pm, February 15th 2002, the town of NHIALDIU was threatened by a large GOS [government of Sudan] armored mechanized column supported by MI-24 Hind [helicopter] gun-ships and AN[Antonov]-32 bombers. The SPLA had established a vehicle ambush location along the road in front of the armored column approximately 6 kilometers northeast of NHIALDIU. The location was near the site of an earlier engagement along the LOH River [on some maps the Lol or Bahr El Ghazal River] that took place on January 15th 2002. Contact was made between forces of the SPLA and GOS at 15:00 when the gun-ships spotted the ambush ahead of the column. Approximately 100+ mounted Arab horseman supported by the MI-24 gun-ships attacked the SPLA positions. SPLA forces inflicted heavy casualties on the mounted horseman killing over 50 horses and wounding many others. Many horses and weapons were captured during this first action. [851]
The SPLA, however, failed to capitalize on its separation of the tanks from the infantry, for lack of "sufficient anti-armor weapons." The government forces began a fighting withdrawal to Bentiu, during which the AN-32 bombers and MI-24 gun-ships attacked the village areas in the vicinity of the battle, which resulted in the killing of a large number of civilians. Combatant casualties on both sides were high.[852]
The aid worker's description of the next attack by the government forces on Nhialdiu on February 20, 2002, was equally precise:
At 2 pm, February 20th, 2002, the town of NHIALDIU was attacked from the North by a reinforced armored brigade supported by artillery, MI-24 Hind helicopter gun-ships and AN-32 bombers. The attack was lead by COLONEL BAKHIT ELWIA of the GOS. Twenty-four hours of non-stop aerial bombardment of the town and the surrounding villages by artillery and AN-32 bombers preceded the attack. The assault came in the form of 2 armored columns moving parallel and spearheaded by 20+ T-55 main battle tanks and armored personnel carriers supported by infantry. At 4 pm, February 20th, the GOS forces entered the town of NHIALDIU and secured a defensive perimeter around the town. During the attack, the civilian population fled south towards the CHAAR River and the town of WAUK. Not all were able to escape the attack. Many civilians were killed or wounded in the attack while others who were unable to run; the sick, invalid, elderly, pregnant females and small children were later killed by GOS forces during clearing operations of the town between 4 and 7 pm, February 20th, 2002. After consolidating their position in the town the night of the 20th, the GOS began wholesale destruction on the infrastructure of the town. They destroyed houses, water wells, churches, government buildings and the market area. At 8 am the next morning, the GOS forces and horse-mounted militia supported by MI-24 Hind gun-ships began to sweep and clear the area to the south of NHIALDIU towards the river CHAAR. Villages were burned and looted without quarter and their inhabitants slaughtered by both ground and air attacks. MI-24 Hind gun-ships flew in 2 and 3 gunship formations firing at anything that moved in the area, searching out any pockets of resistance or concentrations of people. The area south of NHIALDIU became a killing field for both people and their livestock. The infantry and horse-mounted militia moved behind the gun-ships looting the personal property and livestock of the abandoned villages and then burning every structure to the ground.[853]
This report is consistent with the reports of human rights investigators in Western Upper Nile/Unity State during February and March 2002.[854]
On February 22, 2002, Khartoum reported it had secured a major "airport" in Nhialdiu, which it claimed the SPLA had been using to attack oilfields in Western Upper Nile/Unity State. This is not consistent with the observations of countless investigators and relief personnel who have been in and out of Nhialdiu throughout the years.[855] The SPLA retook Nhialdiu on February 29 but held it only for one day before losing it to the government.[856] The SPLA lost Mankien to Maj. Gen. Paulino Matiep's militia in May 2002.
Displacement Crisis in Oil Areas Because of Fighting, 2001-2002
In early January 2001 UNICEF expressed its "extreme concern" that large numbers of displaced people in Upper Nile were putting pressure on local populations whose food needs were not secure, and this could lead to a humanitarian crisis. The WFP calculated that food needs for the vulnerable population would increase about 20 percent in 2001, compared to 2000.[857] The following month, the WFP made an urgent plea for U.S. $ 135 million to feed 2.9 million people in Sudan. It said that "Hunger is expected to be worst in the 1998 famine zones of Bahr el Ghazal and in Upper Nile where the conflict continues."[858]
The WFP said in the same month:
Our position on displacement around the oilfields in Sudan is that we have witnessed an increasing number of internally displaced people who have required food assistance in these areas. These are indeed people forcibly removed from their homes due to war. They did not choose to flee for their lives. . . . The oil-rich area of Sudan has seen a great deal of population displacement and in fact, is currently one of the most insecure areas in Sudan.[859]
The Norwegian Refugee Council concluded in May 2001 that since the late 1990s displacement in Sudan had been closely linked to the expanding activities of the oil industry in Western Upper Nile/Unity State.[860]
A new wave of internally displaced civilians arrived in Bentiu in February-April 2001; they reported to the WFP that their homes had been attacked, burned, and looted by "militia," although it did not specify which militia. The civilians suffered from a 24 percent global malnutrition rate. This was among the highest malnutrition rates reported in southern Sudan.[861]
By mid-2001, there was nothing left of Padit in Ruweng County (Block 5A), which was visited by the Harker mission in December 1999, and later by the Canadian/British mission of April 2001[862] and by a journalist in July 2001. The journalist "found that in the town of Padit, there was nothing more than the foundations and remains of dozens of houses and farms."[863] Padit had been a town in Block 5A to which many displaced from Pariang (Block 1) had fled.
As if the condition of these civilians were not bad enough, the presence of a wild polio virus was confirmed in Ruweng County. A campaign to wipe polio out of Sudan had been in progress for a few years, but due to the fighting and insecurity, Ruweng County was not effectively reached. It had only two of three required rounds of National Immunization Days in 2000, only one in 1999, and none in 2001. The treatment is ineffective unless all three rounds are administered within a limited time of several months. WHO, knowing the fighting and forced displacement which the Ruweng County area suffered and continued to suffer, stated that there was a real need for urgent rounds of polio immunization to halt the spread of polio.[864] The United Nations urged warring parties to permit safe passage to teams staffed by WHO, UNICEF, and Operation Lifeline Sudan, who were due to arrive in the area at the end of July 2001 to combat the spread of the polio virus.[865] The parties finally agreed, at Danforth's urging, to make this area a "zone of tranquility" and to facilitate access for the purpose of wiping out the polio virus, but in typical fashion logistics, misunderstandings, and deception seriously delayed health access even then.
One human rights investigating team estimated that in October 2001 there were an additional 80,000 displaced persons from Ruweng County escaping government military operations there. It noted that an estimated three-quarters of the population of Ruweng County had been displaced over time.[866] Another investigating team concluded that the "Government of Sudan is deliberately targeting civilian populations, resulting in the displacement of the majority of Rubkona County."[867]
From January to March 2002 an additional 50,000 persons from Block 5A were displaced, on the move from fighting between the government and rebels.[868]
As of March 2002, the number of internally displaced individuals from the oil areas found in Lakes (a section of Bahr El Ghazal) and Upper Nile region stood at 174,200.[869] This did not include the numbers who were in Twic County of Bahr El Ghazal and in Khartoum.
The government tried to restrict relief access to these specific persons displaced from Western Upper Nile/Unity State in mid-2002, in a series of ploys that brought about a strong reaction from the operational NGOs, which was not as strongly followed up by donor governments. The Sudanese government succeeded in getting a U.N. official to sign an agreement, presented to him one-half hour before he left the country with the threat of "sign this or the displaced will get nothing," that this region would be served from a government base in El Obeid, northern Kordofan, by road and barge. The Sudanese government continued to ban all air access to Western Upper Nile/Unity State; air access, because of the commencement of the rainy season, was the only way to reach most of the persons recently displaced from the oilfields. The U.N. quickly voided the agreement, but the world was again on notice of the Sudanese government's willingness to impede aid to the oil displaced even in the midst of peace talks in Kenya.
Even as independent human rights and humanitarian agencies were documenting the proliferating serious abuses in the oil fields, the U.N. special rapporteurs for human rights in Sudan were also taking official and urgent note.
The report of U.N. special rapporteur for human rights in Sudan Dr. Leonardo Franco to the General Assembly on October 14, 1999, sounded the alarm about displacement in the oilfields: he noted that the May 1999 government assault on Ruweng County had caused many persons to become internally displaced.[870]
The new special rapporteur on human rights in Sudan, appointed in late 2000, Gerhard Baum, declared to the April 2001 session of the U.N. Commission on Human Rights that the situation of human rights in Sudan in 2000, specifically with regard to the oilfields, was serious;[871] in June 2001, he warned that the situation of human rights in 2001 was worse than the year before, and that oil was fueling the conflict.[872]
U.N. special rapporteur Baum stated, among other concerns about the oil-displaced persons, that none of those displaced who fled to Khartoum seemed to have benefited from any kind of compensation for being relocated "in spite of information to the contrary, as provided by the Government in March [2001]."[873] These comments were made to the General Assembly in November 2001.
The special rapporteur stated in his January 2002 report to the U.N. Commission on Human Rights that "the overall human rights situation has not improved since the presentation of his interim report" to the U.N. General Assembly in November 2001.[874] He specifically linked oil exploitation to human rights abuses. He interviewed internally displaced persons from Upper Nile in Khartoum and in southern Sudan, and noted "that oil exploitation continued to cause widespread displacement and access to the area remains extremely difficult . . . ."[875] He also reiterated his
strong belief that the right to development cannot justify the disregard of other human rights. The Special Rapporteur believes that oil exploitation is closely linked to the conflict which . . . is mainly a war for the control of resources and, thus, power. Bearing in mind the adverse impact of oil exploitation on the human rights situation, he therefore remains convinced that the monitoring of the human rights situation in the oilfields, as well as considering the human rights-related social and economic implications deriving from oil exploitation, including the use of oil revenues, are part and parcel of his mandate.[876]
He reported that "oil has seriously exacerbated the conflict while deteriorating the overall situation of human rights," and said that he had received information that "oil exploitation is continuing to cause widespread displacement . . . ."[877] His interviews with displaced persons from the oil areas pointed to "bombings by Antonov planes, often followed by attacks by helicopter gunships aimed at clearing the land around the oilfields . . . . some fled naked, and were forced to run for up to a month before reaching a safe haven."[878]
He specifically refuted the government's argument that people move to the north rather than to the south to look for peace, because "people fled wherever they could."[879]The Special Rapporteur's reports in 2002 and 2003 were similarly urgent.[880]
The relief situation belatedly turned around when in October 2002 the government and the SPLM/A agreed on unimpeded humanitarian access to all areas for people in need, as part of their standsill agreement during the second round of peace talks under IGAD auspices in Kenya.[881] Even as access dramatically improved in other areas in and outside the south, however, Western Upper Nile/Unity State continued to be an area where the government intermittantly blocked humanitarian access to the needy persons it had displaced from the oilfield areas-and violated the ceasefire also agreed to in October 2002.
After years of trying, the Sudanese government finally succeeded in defeating the mandate of the UNCHR's special rapporteur on human rights in Sudan in April 2003 and silencing that official critic of forced displacement and misery in the oil areas.[882]
Oil Developments
Oil Production Increases in Blocks 1, 2, and 4
Talisman's general manager in Sudan, Ralph Capeling, announced in early January 2001 that the GNPOC consortium planned to drill seventeen exploration wells and twenty-five development wells in its Sudan blocks.[883] The GNPOC production target for 2001, an average 200,000 barrels per day, would be exceeded, Capeling predicted.[884]
In May 2001, Capeling announced that GNPOC was producing oil in six fields and would increase to about ten fields within twelve months. "It is better than Talisman expected. When we came in October 1998, we thought we were buying 600 million barrels, but what we got was 917 million," Capeling told the press.[885] He predicted that GNPOC production would rise to 250,000 barrels per day by 2003, and that level of production could be maintained for some time.[886]
In July 2001, the Sudanese government energy and mining minister Awad Ahmed al Jaz officially opened the new GNPOC field called "Bamboo," said to be thirty-five kilometers north of Heglig (on the northern side of the north-south border).[887] He announced it was producing 15,000 barrels of oil per day from eleven wells.[888]
Talisman announced in January 2002 that it spent U.S. $ 125 million in exploration and development in Sudan in 2001, a jump from its 2000 spending (U.S. $ 70 million). It projected spending slightly less in 2002, U.S. $ 115 million. Almost three-quarters of this budget would be allocated to projects at Bamboo and Munga in Block 4, where seven wells would be drilled (thirty-eight wells in all would be drilled in the GNPOC concession in 2002).[889]
Talisman's projections indicate production from the GNPOC concession would peak in 2005 at 250,000 b/d and then would drop off yearly and rather sharply, reaching 40,000 b/d in 2020, and continuing to decrease after that.[890] Thus, the government would have to open other oil fields if it were to maintain its revenue flow.[891]
Lundin Makes a "Significant Oil Discovery" in Block 5A in 2001, Suspends Operations Again in 2002
The government looked to Block 5A for the next source of oil revenue. Shortly after the January 2001 inauguration of the road leading to Lundin's drilling site in Block 5A, testing commenced on the Thar Jath-1 well (Ryer).[892] In early March 2001, Lundin was "pleased to announce" it had "made a significant oil discovery on Block 5A, onshore Sudan."[893] CEO Ian H. Lundin commented, "This is a significant and exciting event for Lundin Oil. We have confirmed that the trend of prolific oilfields as seen in Blocks 1, 2 and 4 operated by the GNPOC consortium, extends into our Block."[894]
Lundin then moved its exploratory drill to a second exploration site, called Jarayan-1, approximately twelve kilometers southeast of Thar Jath-1/Ryer.[895] The well was not successful, however, and Lundin encountered only "sub-commercial quantities of oil" there, and moved the drilling rig back to the first location. Lundin noted that it, its partners, and the government of Sudan were "committed to the fast track development of the Thar Jath field through the installation of a pipeline connecting Thar Jath to the main trunk line that goes to Port Sudan," i.e., the GNPOC pipeline.[896]
Cmdr. Peter Paar had been guarding Lundin's operations since mid-2000, supplied by the Sudanese government. When his differences with SPLA Cmdr. Peter Gatdet were settled in August 2001, Cmdr. Peter Paar joined with the SPLA at the start of the dry season in November 2001 to attack the Lundin installations and ambush government convoys to the Lundin rig site at Ryer/Thar Jath.
Because of adverse military developments, Lundin suspended operations in Block 5A on January 22, 2002 (see below, "Lundin Suspends Operations Due To 'Insecurity,' 2002,").
New Blocks to be Exploited
The government also moved ahead with allocating the rights to other concession areas neighboring Blocks 1, 2, and 4 and Block 5A. Petronas was to be the lead partner, with Sudapet, OMV, and Lundin participation, in the development of Block 5B, south of Block 5A, Petronas announced in July 2000.[897] The main towns in Block 5B were Nyal and Ganyliel.
In September 2001, Blocks 3 and 7 (Melut Basin) in Eastern Upper Nile seemed ready to take off, from a government point of view. The government announced numerous times that certain countries and companies were interested in development of these Blocks 3 and 7.[898] Finally, Gulf Petroleum Corporation (the Qatari company that already held the concession), CNPC, the Al-Thani Corporation of the United Arab Emirates (UAE), and Sudapet signed an agreement to conduct joint operations in Blocks 3 and 7 under the name of Petrodar. It had plans to drill twenty wells there in 2002.[899]CNPC had already announced that it had begun oil exploration there in March 2001.[900]
The government frequently announced the comings and goings of oil company officials and foreign government representatives interested in entering the oil business in Sudan.[901] Some of them concluded agreements, including Slavneft (Russia's oil company agreed with the government to work in Blocks 9 and 11 in northern Sudan)[902] and the Russian republic of Tatarstan's oil company Tatneft. It appeared that Tatneft signed an agreement with Gulf Petroleum to participate in development of Blocks 3 and 7. It also signed a memorandum on long-term cooperation with the ministry of energy and mining.[903]
As of the writing of this report, aside from the on-going 10,000 b/d production at Block 3, none of these other blocks were producing oil.
PART III: HUMAN RIGHTS CONSEQUENCES OF OIL DEVELOPMENT
INTERNAL DISPLACEMENT AND INTERNATIONAL HUMANITARIAN LAW
Overview
Approximately 204,500 people were internally displaced from Western Upper Nile/Unity State from mid-1998 until February 2001, conservatively estimated, with the usual caveat that numbers in the south of Sudan are often no more than educated guesses. As of March 2002, the total number of displaced persons who fled Western Upper Nile/Unity State to elsewhere in Upper Nile and to Lakes (part of Bahr El Ghazal) alone was estimated at 174,200. This displacement, accomplished through war as the means of control of the strategic and valuable oilfields, was illegal under international rules of war. These civilians were not displaced for one of two permissible reasons under the rules of war: "imperative military reasons" or the safety of the civilians. They were not allowed to go or to remain at home after the danger of a military campaign was over. They were pushed off their land, in some cases many times, by goverment army or militia forces, for the purpose of emptying the oil areas of southern civilians whom the central government regarded as "security threats" to oil development, solely on account of their ethnic origin and therefore presumed rebel loyalties.
The government tried to control this "security threat" by the most extreme means of removal, using military land and air invasions, killing, looting, burning, and destroying the local subsistence economy and killing and injuring civilians. At the same time it cut the area off from humanitarian assistance by imposing relief flight bans and denials of access, while only allowing food into garrison towns, where it could serve as a magnet to draw starving people to crowded areas under government control: a textbook case of a counterinsurgency operation.
Some rebel leaders complicated the scenario through attempts to manipulate the humanitarian structures. In an effort to demonstrate his military support in the field, in 2000 Riek Machar tried to parlay his political control of the Relief Association for Southern Sudan (RASS) into proof of his control of Nuer areas. And the SPLA's attempts to impose further controls on NGOs in its territory pushed more independent-minded NGOs out of its territory. The SPLA then jeopardized the Wunlit peace agreeement when it launched an attack from Dinka territory on a relief hub at Nyal, Western Upper Nile/Unity State serving the Nuer.
Numbers of Nuer and Dinka Displaced from Oil Blocks in Western Upper Nile/Unity State
According to information provided by the WFP and others, an estimated 204,500 civilians in Western Upper Nile/Unity State were displaced from the time the oilfield conflict escalated in 1998 through February 2001. Their movements in search of safety and food took them in different directions, sometimes to the edge of an oil concession, sometimes to the toic, sometimes to a garrison town, and sometimes outside of Western Upper Nile/Unity State. Those who were hiding in areas inaccessible to relief organizations usually were not counted.
The estimated numbers of displaced from Western Upper Nile/Unity State break down as follows: 1998-99: 70,500; 2000-February 2001: 134,000 displaced; and as of March 2002, 174,200 remained displaced.[904] While none of these numbers is more than an estimate or a snapshot, together they provide a means of comparison: numbers of displaced were on the increase.
1998-1999
The WFP in December 1999 estimated that since the conflict moved to the oilfields in 1998 WFP had assessed about 70,500 Western Upper Nile/Unity State displaced or war-affected civilians in need of food and other aid.[905] This included only those people who were identified in relief needs assessments by relief personnel. The internally displaced in the most remote areas-people who had fled into the toic or other inaccessible areas for safety-rarely were counted by any agency and their number was not known.
The rough estimate of 70,500 displaced from 1998-99 originating in Western Upper Nile/Unity State was in two parts:
(1)OLS Southern Sector, served from Kenya: 40,500. OLS noted that expulsions from Western Upper Nile/Unity State included 17,500 Nuer from Mankien (Block 4) [906] and 23,000 Nuer from Ler and Koch (Block 5A) who went to Bahr El Ghazal or other areas of Upper Nile,[907] that is, from both the GNPOC and Lundin Block 5A concessions.
The Nuer from Ler and Koch included those who left immediately after the fighting in May-June 1999, when more than 3,000 displaced people were received in Nyal (including 2,250 women and children).[908] Another 4,000 of these displaced people went to Ganyliel (including 2,800 women and children).[909] But as the fighting raged back and forth and up and down Block 5A, more and more persons were dislodged from their homes in fear, and fled by August 1999. A large displaced persons area formed in Pabuong, an eight-hour walk west of Nyal.
(2)OLS Northern Sector, served from Khartoum: some 30,000 needy displaced in Bentiu, Rubkona, Pariang, Mayom (Blocks 5A, 1, and 2), and other garrison towns, many of them fleeing the oilfield areas, estimated by the WFP in October 1999.[910]
2000-2001
The numbers displaced from their place of origin in Western Upper Nile/Unity State in 2000-February 2001 were approximately 134,000 persons, a very conservative estimate derived from three sources.[911]
(1)The first is the U.N. Consolidated Inter-Agency Appeal for Sudan 2001. It states that there was a large influx of approximately 60,000 internally displaced persons into Bentiu in July and August 2000. It noted, however, that those outside Bentiu were not being served: "the fragile security situation outside of Bentiu town has restricted access to the communities either prior to or during displacement."[912]
Only the ones who went to Bentiu in a period of two months were included in the U.N. appeal's estimate of approximately 60,000 displaced in Western Upper Nile/Unity State for all of 2000. This number is therefore likely to be a gross undercount. Most of these displaced, according to the observations of NGO Action Against Hunger (Action Contre la Faim, ACF), lived within a one hundred kilometer radius of Bentiu, and were fleeing fighting between factions that had resulted in looting and destruction of villages.[913]
There were thousands more who were displaced because of the conflict and oil in 2000 who did not go to Bentiu at all, but went to Bahr El Ghazal,[914] or into the displaced-receiving areas established in Western Upper Nile/Unity State in 1999-Ganyliel, Pabuong, and Nyal-or into Bul Nuer areas where they could not be counted because of flight bans, fighting, and weather. Those people are not included in the above 60,000 estimate.
(2)A separate and additional assessment carried out in Tonj County of Bahr El Ghazal in February 2001 indicated that another 23,000 Nuer displaced from Western Upper Nile/Unity State had arrived recently, in organized groups.[915] These are added to the 60,000 above, because it is unlikely that these displaced were counted twice.
(3)An additional summation by WFP for Liech State (Western Upper Nile/Unity State) indicates that in January-February 2001 there were about 51,000 additional persons displaced who remained inside Western Upper Nile/Unity State, at locations served from OLS (Southern Sector), i.e., not in Bentiu.[916]
This very conservative estimate of newly displaced in/from Western Upper Nile/Unity State for January 2000-February 2001 is 134,000.
2001-March 2002
As of March 2002, the number of internally displaced individuals from Western Upper Nile was estimated to be 174,200,[917] according to a summary report of that date by WFP and OLS. This number of displaced individuals is directly attributable to the conflicts in the oilfields.
This is a very conservative estimate as well. It does not include some 57,000 persons displaced in Upper Nile by what was called "inter-clan fighting."[918] This phenomenon cannot be so clearly disaggregated from the overall conflict because the arms supply comes almost entirely from the two main parties. Furthermore, the number of 174,200 is low because it only incorporates those in the Lakes (in Bahr El Ghazal) and Upper Nile regions, though many displaced persons have gone as far as Khartoum and other parts of Bahr El Ghazal.
The WFP/OLS report attributed the displacement in the 2001-March 2002 period to the "Government of Sudan forces and militias offensives on the Sudan Peoples Liberation Army/Movement (SPLM/A) and the Sudan Peoples Defence Forces/Movement (SPDF/M) rebel areas and fighting among the rebel factions themselves."[919] Further, the report notes that "[d]ue to the conflict around the oilfields . . . .Upper Nile has the highest number of IDPs [of all regions in Sudan]."[920]
These figures are the most reliable available, though even they are only rough estimates. The numbers were "collated from internal WFP filed reports (assessments and food distribution reports), OLS joint assessment missions, OLS Security team, NGO and counterpart reports."[921] Even with the proviso that the figures provided are only rough, however, the extraordinary extent of continued displacement from the oilfields is abundantly clear.
The Illegality of Forced Displacement under International Humanitarian Law
Displacement in Sudan's oilfields is conducted by military means with the use of the armed forces, militias, airpower, and heavy weaponry to drive civilians out of their homes without notice, a hearing, compensation, or any of the trappings of fair trial that accompany displacement conducted pursuant to law for the purpose of legitimate economic development. The objective of the displacement is a military and economic one: to capture and hold valuable oilfields and to eliminate "enemy" threats to take back the territory.
Displacement of civilians for war-related reasons is forbidden under article 17 of Protocol II of 1977, to the 1949 Geneva Conventions.[922] Under international humanitarian law, there are only two exceptions to the prohibition on displacement of civilians during internal armed conflicts: their security or imperative military reasons. Article 17 of Protocol II states:
1. The displacement of the civilian population shall not be ordered for reasons related to the conflict unless the security of the civilians involved or imperative military reasons so demand. Should such displacements have to be carried out, all possible measures shall be taken in order that the civilian population may be received under satisfactory conditions of shelter, hygiene, health, safety and nutrition.
The term "imperative military reasons" usually refers to evacuation because of imminent military operations. Such evacuation assumes proper procedures for notification and evacuation, and proper means of transport to a safe place. It does not include a military attack on a civilian population, which is not a legitimate military objective under international law.[923] Nor does it include pillage, a breach of well-established international law.
The provisional measure of evacuation is appropriate if an area is in danger as a result of military operations or is liable to be subjected to intense bombing. Evacuation may also be permitted when the presence of protected persons in an area hampers military operations. The prompt return of the evacuees to their homes is required as soon as hostilities in the area have ceased. The evacuating authority bears the burden of proving that its forcible relocation conforms to these conditions.
Displacement or capture of civilians solely to deny a social base to the enemy has nothing to do with the security of the civilians. Nor is it justified by "imperative military reasons," which require "the most meticulous assessment of the circumstances"[924] because such reasons are so capable of abuse. One authority stated:
Clearly, imperative military reasons cannot be justified by political motives. For example, it would be prohibited to move a population in order to exercise more effective control over a dissident ethnic group.[925]
Mass relocation or displacement of civilians for the purpose of removing an ethnic group deemed friendly to rebels is prohibited since it is a political motive as described above. Certainly, permanent displacement of an ethnic group from its place of origin in order to ensure security for oil operations from rebels who might someday move through the area to attack oil infrastructure is illegal under the rules of war. Such permanent relocation is not for the safety of the civilians, nor for "imperative" military operations, which by their nature are temporary.
Even if the government were to show that the displacement were necessary, it still has the independent obligation to take "all possible measures" to receive the civilian population "under satisfactory conditions of shelter, hygiene, health, safety, and nutrition." The Sudanese government has singularly failed to meet its obligation to care for displaced persons, and, furthermore, actively obstructs others who would do so. This has been the government's pattern and practice for almost two decades, as amply documented in several academic studies of relief operations in Sudan and in assessments for donors.[926]
Contractually-Incurred Obligations Forbidding Forced Displacement
In additional to the provisions of international humanitarian law, the parties are bound by the agreements they have signed regarding forcible relocation of residents. On December 15, 1999, representatives of the warring parties (Elijah Malok Aleng for the SPLM/A and James Mabor Gatkuoth for the Sudanese government), along with the U.N. (Ross Mountain), signed a tripartite agreement on the implementation of assistance to war affected civilians. Item 5 specifically provided:
Beneficiaries have the right to protection from forcible relocation from their legal or recognized place of residence
The Parties to the Conflict agree and guarantee that no beneficiary will be forcibly relocated from his or her legal or recognized place of residence. . . . When communities may be relocated they will be consulted on an individual and community basis on alternatives to relocation. Where communities are to be relocated, they are guaranteed individual and community participation in the relocation process, particularly prior to relocation, and will be given a reasonable period of notice prior to relocation. Communities will only be relocated to suitable sites with basic services and proper accommodation in place prior to relocation. Communities will only be relocated in a manner that preserves the right to life, dignity, liberty and security.[927]
These provisions have been totally ignored by the government, especially in the oilfields. The government and SPLM/A in March 2002 signed an agreement not to attack civilians or civilian objects in the war, at the behest of the U.S., but fighting after that date was carried on without regard to that agreement, particularly in Western Upper Nile/Unity State.
Oil Operations as a Military Objective
Oil operations would in many circumstances qualify as a legitimate military objective. To constitute a legitimate military objective, the object or target, selected by its nature, location, purpose, or use, must contribute effectively to the enemy's military capability or activity, and its total or partial destruction or neutralization must offer a definite military advantage in the circumstances prevailing at the time.[928]
Oil revenues contribute effectively to the Sudanese government's military capability and activity, and the destruction of oil infrastructure therefore offers a definite military advantage in the circumstances.[929] The targeting of valuable export commodities has been considered legitimate since the U.S. Civil War of the 1860s. Then, the destruction of raw cotton, the chief export of the Confederate states, was deemed-as Art. 52 (2) of Protocol I requires, "in the circumstances prevailing at the time"-to make an effective contribution to military action since it was the ultimate source of funding for Confederate weapons and military supplies.[930]
There are nevertheless limits on the rights of the parties to a conflict in selecting targets. For one, Protocol I, article 55 would apply, for instance, to targeting oilrigs in the Nile or other waterway where a spill might result in damage to the environment. The article states that the attacker may not use methods or means of warfare "which are intended or may be expected to cause such damage to the natural environment and thereby to prejudice the health or survival of the population."
Of course, civilians, including oilfield workers, are never a legitimate military target. Should they bear arms, it would be different, but those are not the facts in Western Upper Nile/Unity State as of the writing of this report. Any targeting of oil company or subcontractor employees who are not engaged in hostilities would be a violation of the rules of war.
Relief Politics and Abuses in the South
Relief in Sudan is a complex, decade-old "emergency" operation. Most relief agencies, U.N. and nongovernmental, operate under the U.N. umbrella group Operation Lifeline Sudan (OLS).[931] This unique cross-border operation was created after the Bahr El Ghazal famine of 1988 and was designed to serve rebel-held areas from Kenya. Western Upper Nile/Unity State is divided for relief purposes between two sections of OLS; this is common throughout the south. The northern sector, based in Khartoum, provides for government-controlled areas, including garrison towns such as Bentiu, Mayom, Pariang, and other locations in Blocks 1, 2, 4, and 5A. The southern sector, based in Nairobi and operating from Lokichokkio, Kenya, where the huge U.N. "emergency" operation has been located for more than a decade , covers the areas that were in rebel or former rebel control,[932] including the territory in Block 5A,[933] with some exceptions.[934]
In most rebel-held areas either the SPLM/A or Riek Machar's forces have functioned as the de facto government. Their respective relief arms-Sudan Relief and Rehabilitation Association (SRRA) for the SPLM/A and Relief Association for Southern Sudan (RASS) for Riek Machar-were recognized as "counterpart" agencies representing "local authorities" and received their funding from the OLS.[935] Their duties include assisting in needs assessments and the distribution of food.[936] SRRA and RASS staff, almost all rebel officers, do not depend on local financing, but owe their jobs to the rebel leaders who appoint them, negating community accountability.[937]After the reunification of the Riek Machar group with the SPLM/A in January 2002, the two relief agencies were merged and renamed the Sudan Relief and Rehabilitation Commission (SRRC) in 2003.
Government Flight Bans and Bombings of Relief Locations in Western Upper Nile
The Sudanese government has routinely aggravated the suffering of those displaced by the civil war by imposing flight bans on agencies wishing to bring relief supplies into the south, or bombing airstrips where relief supplies are landed: a ban on most access to Western Upper Nile/Unity State was in effect for more than two years until the parties agreed on October 26, 2002 to full humanitarian access everywhere, in the context of the peace talks.[938]
These access bans not only barred efforts to help civilians recover from attacks on them and their property. They also make it difficult for international relief staff to observe the extent of destruction and displacement caused by the fighting, which produced the needy persons it is their mandate to care for. International relief staff reporting on population needs and movements are routinely suspected as "spies" by the Sudanese government, but their assessments are a necessity of their work, and the human rights side benefits are unintended and coincidental. Nevertheless, the Sudanese government has banned relief workers on countless occasions, in order to make it difficult for anything to be known of its brutal actions against civilians.
The government also commandeered or used other relief supplies to attract the displaced to areas where they could be controlled by government forces. Such practices are described as "using food as a weapon": food given out by government authorities would attract civilians from rebel rural areas into the government garrison towns in the face of international failure to reach the rural areas. All parties to the conflict long ago realized that relief food is a magnet for starving civilians.[939]
In 1999, for example, during its offensive in Block 1 (see above, "Government Campaign of Forcible Displacement from Block 1, February-July 1999"), the government sought to push people from rural (SPLA) areas and also to pull them in to Pariang, the garrison town. In May 1999, government security forces in Pariang commandeered a consignment of twenty-three metric tons of cereals and pulses belonging to the WFP, and in late June they distributed sixteen metric tons of this to internally displaced persons in this garrison town, without notice to or authorization from the WFP. The WFP protested to the Khartoum government, but the government response was not reported; nor were the missing seven metric tons of food accounted for in later WFP reports.[940] At the same time, a flight ban prevented deliveries to the rural areas. .[941]
One of the easiest ways to push civilians out has been by bombing relief delivery locations and airstrips (usually found in close proximity to each other). In early July 1999, the Sudanese army used helicopter gunships to bomb the rebel-held areas around several relief airstrips in Block 1. Local people told a visiting OLS security officer that helicopter gunships had attacked them on July 4 and 5 at Gumriak, Tagil, and a new relief airstrip at Biem, leaving two killed and three injured in Gumriak, and three killed in Tagil.[942] This fighting caused Biem, Tagil, Gumriak, and Padit airstrips to be declared "no-go" or unsafe areas by OLS southern sector on July 4.[943]
These dirt airstrips, built by the local population in order to receive relief deliveries, are only for relief aid purposes. The relief airstrips are not legitimate military targets in and of themselves as the SPLA does not have an airforce or planes.
On July 14, 1999, the government announced a ban on relief flights to most of Western Upper Nile/Unity State, with immediate effect and until further notice.[944] This came on the heels of the July 3 surprise attack by SSDF/Tito Biel rebel forces on the government position at Ler and a rebel rollback of government forces all the way north to the Bahr El Ghazal (Nam) River. The flight ban was announced as the government commenced its bombing of rebel forces and the subsequent rebel rout, accompanied by more army/militia attacks on civilians as it pursued the rebels south. As the government was generating this new wave of displacement in the oilfields, OLS had "virtually no access to Western Upper Nile."[945]
The government flight ban even included Nyal and Ganyliel, areas with no fighting to which the internally displaced were fleeing in the thousands.[946] Off and on for a few months in 1999, Cmdr. Tito Biel had his field headquarters in Nyal, and that was probably what lead Khartoum to ban access. This was a military rather than a humanitarian consideration, despite the thousands of newly displaced and needy persons in Nyal who greatly outnumbered any possible troops. Khartoum also denied relief access to Ler, Boaw, and Duar, in those cases perhaps a sign that the government did not control those towns.[947]
This blocked not only the assessment of new needs and assistance to what appeared later to be thousands of displaced from the oilfields. On-going non-emergency programs were also halted. A planned immunization of 50,000 children had to be called off.[948]
The locations where there was an actual security risk because of ongoing fighting were not at issue. The U.N. put them off limits temporarily. Locations where there was conflict, including Nimne, Nhialdiu, Koch, and Wicok, were put off limits by OLS (Southern Sector) security personnel which labeled them "Red-No-Go" until the security personnel could land and verify that it was safe for relief workers to return, usually only a day or two period of time..[949] Bentiu and Rubkona, and the Nile River along the Adok corridor, were declared OLSA no-go areas also from time to time, depending on the actual security situation.[950] But the Sudanese government-imposed bans went far beyond the OLS no-go areas and beyond areas of active combat, and extended long after fighting was over.
The U.N. quietly protested the extensive July 14, 1999 flight ban on Western Upper Nile/Unity State to the Sudanese government but received no response. On July 27, the WFP issued a public warningthat some 150,000 people in Western Upper Nile/Unity State were in need of relief but could not be reached, and that unless the government lifted its flight ban on the area soon, "we could be heading toward a humanitarian catastrophe. . . . We're looking at a lethal mix of a weakened population which cannot be reached and are starting to flee their homes."[951] In addition, some banned areas, including Nyal and Ler, had reported cholera outbreaks, leaving the emergency medical teams and relief authorities extremely concerned that epidemics might spread out of control.[952]
In mid-August, all locations in Western Upper Nile/Unity State except for Nyal remained no-go areas for relief deliveries for security reasons.[953] Then the security situation in Bentiu town improved and WFP staff returned.[954] They completed food distributions during the week of August 25, 1999, to some 7,000 beneficiaries in Bentiu and verified the presence of almost 1,000 newly arrived displaced persons into Rubkona (Block 1) from the six villages nearby where there was "insecurity."[955]
The government flight ban was lifted and by early September the relief agencies could finally access almost all Western Upper Nile/Unity State locations.[956] But the window only opened briefly, to be snapped shut because of fighting following Peter Gatdet's mutiny from Paulino Matiep starting September 9-10,1999.
By mid-November 1999, the U.N. relief officials reported, about half the people who had fled Bentiu town (Block 1) since July 1999-when fighting erupted and Riek Machar supporters in Bentiu were selectively killed or detained-returned to Bentiu town. Some 10,000, however, remained along the road between Bentiu and Rubkona. CARE resumed some of its most urgent humanitarian activities in Bentiu.[957]
But as the military action heated up again in at the beginning of the dry season in late 1999, the Khartoum government reduced the number of locations that WFP could reach by air, again denying access to most of the population in Western Upper Nile/Unity State.[958] This forced many more war-affected civilians to leave the oil areas if they wanted assistance, as was apparently the government's intention.
By November 1999 the WFP protested that many areas of Western Upper Nile/Unity State continued to be inaccessible to humanitarian agencies, and that 140,000 vulnerable people were cut off from emergency food assistance. A return to famine remained an ever-present specter, a WFP official warned.[959]
Based on the evidence above, government bombing of relief airstrips where the needy displaced persons congregated was designed to prevent agencies from delivering relief to rebel-held areas and to scare people away from relief locations there, prompting further displacement. This tactic was used in Western Upper Nile/Unity State in 1999-2002, and in 2001 in Raga, Western Bahr El Ghazal.
For instance, more than 6,000 displaced persons in Biem and a slightly larger number in Tagiel, both SPLM/A areas of Ruweng County in Block 1, received relief aid in February 2000.[960] Some 2,300 of these 6,000 had been displaced from Bentiu town because of SPLA/Gatdet bombardment as well as periodic assassinations of Nuer and Dinka civilians by government forces. On February 17, 2000, the government bombed Biem.[961]
In late July and early August 2000, the fighting between Cmds. Peter Gatdet and Peter Paar was in full swing in the Nimne-Bentiu-Rupnyagai-Nhialdiu-Boaw-Wicok axis, along the Block 5A-1-4 border, and no relief was going through. Then outside of this area, with implications for the entire south, the government took a new tactic. Instead of just banning relief airstrips or bombing them, it increased the risks of relief delivery. It bombed relief airstrips when relief aircraft were on the ground, nearly hitting the planes and in some cases inflicting substantial damage on the planes with shrapnel.[962]
These bombings occurred within a week or ten days (on one day there were three bombings on different airstrips), and caused great concern to all pilots flying into Sudan, whether they were working with the U.N., with the ICRC, or were flying without Khartoum's permission. The point seemed to be a warning, interpreted by nervous pilots as follows: "Now we are bombing the airstrips when the planes are on the ground. Next we will bomb the planes when they are on the ground. Next we will attack the planes when they are in the air."[963] OLS declared its own flight ban for security reasons, rightly considering the bombing a denial of access.[964] Some relief staff complained, however, that the OLS ban was playing into the hands of Khartoum.
At the same time, the Sudanese government wanted to impose a new series of restrictions and limitations on relief operations coming out of Kenya, such as posting a representative of the Khartoum government in Lokichokkio, requiring a two-week advance notification of the exact aircraft (call sign, make) that would be flying to a particular relief location (latitude and longitude).[965] The tightening up of restrictions on access was done by the Sudanese government with an eye to ultimately achieving its stated goal, the relocation of all relief activities to government-controlled towns inside Sudan, where they could be more easily and more tightly controlled by the government. The Sudanese government was motivated by its conviction that the U.N. southern sector relief operation served the SPLM/A. It had long sought to close down the southern sector, without regard to the fate of several million desperate civilians.
A U.N. relief coordinator for southern Sudan pointed out the bright side: that through persistence the OLS had increased the needy areas (or airstrips) to which it had access over the years. In March and May 1994 OLS (Southern Sector) had access to seventy-seven locations on a monthly basis. In mid-2000, it had access to one hundred locations on a monthly basis.[966]
The problem, as a top relief official noted, was not the gross numbers of landing strips accessed. The OLS's review of the government's flight bans revealed that there was a pattern of consistent denials to seven locations, ongoing for twenty months up to July 2000 (the time of the interview). The consistently banned locations were in Western Upper Nile and Eastern Equatoria (bordering Uganda). The bans continued for another two years, on the same basis. During the IGAD peace talks, on October 26, 2002, the Sudanese government and the SPLM/A agreed to full humanitarian access and a ceasefire. The principle on which the U.N. operates, that there should be unimpeded access to the beneficiaries wherever located, was violated by the Sudanese government for years in Western Upper Nile and elsewhere.[967]
One of the areas banned frequently in 2000 was SPLA(Peter Gatdet)-held Mankien, which was bulging at the seams with internally displaced from Mayom, a garrison town still under Maj. Gen. Paulino Matiep; both towns are Bul Nuer. Those fleeing Mayom told of retaliation by Paulino Matiep and Sudanese government soldiers following Cmdr. Peter Gatdet's mutiny (September 1999) and his continued shelling of Mayom. Little aid reached Mankien's internally displaced or their hard-put hosts until February 2000, when Christian Aid, a non-OLS agency, brought in basic supplies. The agency returned on March 19-21, 2000. But the area was one that remained almost permanently off limits for OLS agencies due to government flight bans and U.N. security worries.[968] As a result, those displaced due to the Gatdet/Paar fighting from areas south of Bentiu were forced to flee not just within Western Upper Nile/Unity State, but often much further from their homes, into Bahr El Ghazal, where relief aircraft were not as frequently banned.[969]
These government bans applied to relief flights, not to road deliveries. The banned locations in Eastern Equatoria were close enough to the Ugandan and Kenyan borders, and the roads were adequate enough, following a U.S. Agency for International Development (U.S.AID) program of road and bridge repair, that overland truck delivery of food and non-food items was feasible (at least during the dry season). Overland trucking also was much more cost effective.[970] Attacks by Sudanese government-supported Ugandan rebel troops, the Lord's Resistance Army (LRA), on relief convoys driving through northern Uganda into southern Sudan were an obstacle to this cheaper form of transport.[971]
Western Upper Nile/Unity State, however, was another matter. Because of six months of inundation and the consequent lack of all-weather roads (except what the oil companies built in the oil drilling areas), truck access was impossible, and even during the dry season overland transport to the area from Kenya and Uganda was not possible because of the lack of roads, the sudd, toic, rivers and other natural barriers.[972] Therefore there is no alternative to air delivery from Kenya and Uganda to most of Western Upper Nile/Unity State south of Bentiu.[973]
Moreover, even when relief could be delivered by road from Khartoum to Bentiu, food trucked in had to pass by numerous government army bases. In January 2000, authorities in Heglig, the location of a large army base and GNPOC headquarters, detained two truckloads of WFP food (eighty metric tons) en route from El Obeid to Rubkona. They held the commercially contracted trucks for ten days until WFP negotiations with Khartoum authorities secured their release.[974]
Even after arrival at its village or destination, the food was not always safe from the military or security forces. In March 2000, local pro-government militia forces in Rubkona stole two metric tons of sorghum from a WFP stock of ninety-five metric tons of food intended for the needy.[975]
While geography, weather, and even amounts of donated food are not within the control of the parties to the conflict, flight bans certainly are. The government of Sudan has been active in banning relief flights to Western Upper Nile/Unity State, but the international aid community has not been diligent enough in addressing this situation. The U.N. Security Council was briefed in early August 2000 about the consistent denials of flight access to Western Upper Nile/Unity State and Eastern Equatoria,[976] but the content of that briefing was confidential and no perceptible change resulted for Western Upper Nile/Unity State.
Only after the U.S. Danforth Sudan peace initiative began in September 2001 did the U.S. tackle this problem at higher levels. Even then, aid only started to flow to the Nuba Mountains, previously under total blockade by the government for more than a decade, after tough negotiations. The Danforth team, lead by a top official in U.S. AID, Roger Winter, exerted considerable effort to win humanitarian access for Nuba, the Blue Nile, and southern Sudan.[977] Even then, the plight of those in Western Upper Nile was never resolved despite the access agreement and ceasefire of October 2002.
Before the food supply situation for Western Upper Nile improved, however, it worsened. One humanitarian worker noted another problem: funding. The U.N. Consolidated Inter-Agency Request for Sudan for 2000 was so undersubscribed by the (mostly governmental) international donors that there were serious shortages of food compared to assessed need. As a result many needy did not receive any assistance. By 2002, human suffering at government and rebel hands had increased.
Following its targeted bombing of a relief site at Bieh, Western Upper Nile/Unity State, killing twenty-four on and after February 20, 2002, the Sudanese government on March 1 perversely raised the number of areas to which relief agency access was banned: it increased the number of off-limits locations from twenty six to forty five. It blocked access to the hardest-hit areas in the Western Upper Nile/Unity State oilfields for another four months, then permitted only a short window of assessment from June 21-26, 2002.[978]
An OLS assessment team's look at the condition of the civilian population confirmed that it was bad in Western Upper Nile/Unity State, and it was getting worse due to the conflict and flight bans.
Estimates of the numbers affected by the fighting and insecurity range between 150,000 – 300,000. However, lack of access has made it all but impossible to verify the numbers . . . . [Western Upper Nile/Unity State] has suffered constant insecurity and the people have suffered multiple displacements in the last few years, with each displacement leading to a progressive loss of assets and the breakdown of normal coping mechanisms as families are separated. The 2002 Annual Needs Assessment (ANA), undertaken during September-November 2001, indicated that up to 50% of the population in Leech State and up to 100% in Ruweng County would face food deficits during the coming year. Denial of access has compounded this problem.[979]
In Ruweng County, the assessment team found that "more than 1 in 4 children [were] malnourished. Children were visibly wasted." One hundred percent of the population was in need of food and non-food relief.[980] It would be hard to image a bleaker report.
Rebel Manipulation of Relief
International relief is a political asset in poverty-stricken and war-wasted southern Sudan. Commanders, SRRA, and RASS like to claim that their rebel group is responsible for bringing material assistance to the people (from the international community), hoping to garner popular support and coincidentally to provide more goods subject to rebel "taxation" or outright diversion.
That they are accountable only for "their" controlled territory may be somewhat logical from an administrative and military point of view, but in 2000, with the Nuer community split three or more ways militarily and politically, many Nuer groups were left with no "counterpart" relief agency to speak for their needs. RASS did not cover Nuer areas not under Riek Machar's control. Even then, Nuer in SPLM/A (SPDF and RASS) areas were not adequately served by the SRRA for a variety of reasons. This situation was not greatly changed by the humanitarian access agreement of October 2002. Ceasefire violations by various parties in government militia areas of Western and Eastern Upper Nile resulted in government access denials for "security" reasons, and the groups allied with the government were ineffective at reversing the situation. [981]
In early 2000, however, RASS-the Riek Machar relief arm - began to serve an additional purpose: creating the appearance of Riek Machar's military control of large areas of Nuerland after his resignation from the government in January 2000. Often RASS was the only operation on the ground that had a radio (for coordination of relief) and could communicate, leaving those without such equipment unable to assert their existence to the outside world.
For relief officials, the acid test for determining which rebel faction controlled any location in southern Sudan became not what RASS and the SPDF claimed. It was whether the RASS coordinator would travel from the U.N. base camp at Lokichokkio in Kenya to the SPDF/Riek Machar location in southern Sudan. Relief protocol required a "local counterpart," such as SRRA or RASS, to accompany every flight in order to pave the way on the ground. But RASS personnel did not dare land in non-Riek Machar territory, for fear of their lives. As one U.N. official observed, "You don't know if Riek Machar really controls the area until the RASS coordinator shows up on the airstrip ready to go."[982]
Using the relief structure for military-political purposes, however, tended to slow down and mislead relief officials about the needs on the ground and access. It gave the government more reason to want to kill the entire program.
The SPLM/A also tried to control international relief for its own benefit in ways that hurt civilians. In 1998, the SPLM/A had tried after the Bahr El Ghazal famine to impose more controls on international relief agencies through a memorandum of understanding (MOU) to be signed by the SRRA and individual NGOs.[983] Negotiations dragged on for a year. Failure to agree on terms led to an SPLM/A-imposed deadline of March 1, 2000 for international NGOs to either sign the MOU or pull out of SPLM/A-controlled areas, where the majority of international aid activity in the south was located. Eleven of the forty NGOs initially rejected the proposed agreement because they believed it could compromise their neutrality and/or the safety of their staff.[984] Although the U.S. administration intervened and sought an extension of the SPLM/A MOU deadline from March 1 until the distribution of seeds for the May 2000 planting season, the SPLM/A refused.[985]
In response to the SPLM/A ultimatum, several international NGOs pulled their staff and operations out of the SPLM/A areas.[986] When several NGOs returned and signed the MOU in the course of the year, the SPLM/A touted this, but the status quo was not restored. Several agencies with large programs did not return to their prior activities but began to investigate the possibility of working in non-SPLM/A areas of the south-and in many other countries facing humanitarian crises.[987]
One NGO that pulled out due to the MOU dispute left behind 450 bags of seeds and other relief items in a warehouse in Thiet, Tonj County, under the SRRA's custody for distribution to the Nuer displaced from the oilfields and others. Shortly thereafter it was discovered that the warehouse was completely empty. An investigation established that a local SPLA commander looted the warehouse of its entire contents-food and nonfood relief items valued at U.S. $ 500,000-one week after the NGO pulled out.[988] In August 2000, U.S. AID, the donor of most of the relief, sent a letter to the SRRA asking it to account for these goods. An SPLA representative told a journalist that the food had been distributed under "community pressure" to the intended beneficiaries,[989] but records were not kept and proof was not forthcoming. Many Nuer displaced in the area, among other intended beneficiaries, received nothing.[990] The SRRA eventually agreed to provide compensation in kind to the donors.[991]
Rebel attacks on relief vehicles occurred from time to time, causing disruption in relief. For instance, in January 2000, a CARE truck was captured in broad daylight on the deserted road from Bentiu to Mayom; the SPLA as part of its siege of Mayom had warned people off the road. Two CARE employees were killed and two were captured by the SPLA, then released by Cmdr. Peter Gatdet in March.[992] CARE pulled its staff out of Bentiu.
Shelling towns also frightened civilians and caused disruptions in relief distribution. In March 2000, Cmdr. Peter Gatdet's shelling of Rubkona and Bentiu garrison towns became serious enough to require relocation of WFP staff, hindering relief efforts. But families and villages, however, continued to arrive in Bentiu and Rubkona from nearby locations where fighting was more "intense."[993]
The undersubscription of contributions needed to keep the relief effort afloat had sometimes lethal results on the ground. Budget-cutting relief officials allocated smaller amounts to each needy person, but in Equatoria that exacerbated relations between civilians and the SPLM/A, which was accustomed to take its "taxes" directly from relief food.[994] The result was that in a period of a year and a half every relief food distribution in Eastern Equatoria was looted or disrupted in disputes between SPLA soldiers and the local population; some civilians were reportedly killed when the SPLA forces opened fire.[995] This was compounding one SPLA abuse with another: shooting civilians on top of diverting or "taxing" their relief food.
Undersubscription by donors remained chronic. To add insult to injury, the Sudanese government donated 3,000 tons of foodstuffs to Ethiopia in January 2003 in connection with an Ethiopian agreement to import petroleum from Sudan. The donation was in response to the drought in Ethiopia;[996] the bordering areas of southern Sudan suffered from the same drought.
GOVERNMENT OIL REVENUE, MILITARY SPENDING, AND BOMBINGS, 1999-2001
Overview
Government oil revenue, which did not exist in 1998, by 2002 was a substantial source of government revenue-almost 45 percent of total revenue. In 2002, the Sudanese government earned more than U.S. $ 800 million in oil revenues.[997]
But by 2001 military expenses consumed a whopping 60 percent of this windfall oil revenue. By 2001, military expenditures had risen four times as fast as total expenditures.
In fact, from 1999 to 2001, annual military expenditures-which did not include domestic security expenditures-almost doubled: they rose 43 percent.This was reflected in increasing use of aerial bombardment in the south through the purchase of additional helicopter gunships and other heavy weapons systems. In 2001 Russia exported to Sudan twenty-two armored combat vehicles and twelve attack helicopters.[998] In 2002, Russia sold eight amored combat vehicles and four attack helicopters to Sudan, and Belarus sold Sudan fourteen large-caliber artillery systems.[999]
The impact on the war of the acquisition of just twelve attack helicopters in 2001 was substantial: Sudan owned at most nine attack helicopters in 2000,[1000] of which only six were believed to be operational. The oil revenue was used to triple the size of Sudan's attack helicopter fleet in 2001 alone; in 2002, four more attack helicopters were purchased, increasing Sudan's attack helicopters from six to twenty-two in two years.
The government also used oil revenue to buy friends in the region and to create a domestic arms industry aspiring to manufacture heavy weapons. Unfortunately, the Sudanese government adopted a position of non-transparency with regard to military expenditures in 2002.
TABLE 1: SUDANESE GOVERNMENT OIL REVENUE AND MILITARY EXPENDITURES, 1999-2002
In billions of Sudanese Dinars (U.S. Dollars)
1999 |
2000 |
2001 |
2002 |
|
Total Govt Revenue |
205.5b SD (799.9mUS) |
326.3b SD (1.267b US) |
370.0b SD (1.415b US) |
470.7b SD (1.798b US) |
Govt Oil Revenue |
15.7b SD (61.1m US) |
140.9b SD (547.4mUS) |
149.7b SD (572.6mUS) |
210.7b SD (805.1mUS) |
Govt Oil Revenue as % of Total Govt Revenue |
7.64% |
43.18 % |
40.45 % |
44.76 % |
Govt Expendit-ures |
227.2b SD (884.4mUS) |
349.9b SD (1.359b US) |
401.1b SD (1.534b US) |
503.4b SD (1.923b US) |
Govt Military Expendit-ures |
62.2b SD (242m US) |
64.6b SD (250.9mUS) |
90.2b SD ($345m US) |
81.85b SD (est.) (312.7mUS) |
Govt Military Expendit-ures as % of Govt Oil Revenue |
27.38% |
45.8 % |
60.25 % |
38.8 % |
Oil Revenues Soar
From no oil revenue in 1998, by 2002 government oil revenue jumped to almost 45 percent of its total income. [1001]
The government oil revenues for 2000, the first full year of GNPOC production, exceeded the government's projections by almost 122 percent. Oil revenues were projected to be 63.6 billion dinars, but turned out to be 140.9 billion dinars (U.S. $ 546.1 million) for the year. There were two reasons: increased oil production and increased world prices of crude oil. Oil output reached 185,000 barrels per day (b/d) in Sudan in the third quarter of 2000, compared to 126,000 b/d only nine months before. International oil prices were up more than expected:[1002] from U.S. $ 19.8 per barrel in 1999, the price increased to U.S. $ 27.9 per barrel in 2000, a winfall hike of 40 percent.[1003]
There were other benefits: self-sufficiency in oil and the savings that went with it. In May 2000, the ministry of energy and mining declared that Sudan would stop the costly importation of crude oil for the first time in its history, and would become self-sufficient in crude products because the new refinery in Al Jaili north of Khartoum had started producing fuel from Sudanese crude oil. (The energy minister also said Sudan had begun producing aviation fuel.)[1004]
The energy minister optimistically estimated Sudan would save no less than U.S. $ 400 to $ 500 million annually in oil import costs.[1005] The finance minister more conservatively estimated yearly savings would be in the region of U.S. $ 300 million.[1006]
The oil business was the main motor behind the growth of the economy, which was attributed to higher oil output, an increase in government spending, and domestic refining of oil.[1007] The Economist Intelligence Unit noted, "Sudan's external accounts showed a remarkable improvement in 2000, as the first full year of oil revenue came on stream. The outlook for the forecast period is also positive."[1008] As to 2001, it predicted, "Sudan's real GDP [gross domestic product] growth will remain strong, driven largely by developments in the oil sector."[1009]
The 2001 oil revenue projection of 153.2 billion dinars (U.S. $ 593.8 million) was not met, however. Actual 2001 oil revenues were only 140.9 billion dinars (U.S. $ 547.4 million), less than projected but still higher than 2000 oil income.[1010] Judging from IMF staff comments in the report, the government made the mistake of assuming that the 2000 high price of crude oil would continue: instead, it dropped in 2001 to U.S. $ 21.5 from the 2000 price of U.S. $ 27.8 per barrel.[1011]
The reasons oil revenue was less than expected in 2001 were not only that international oil prices declined, but also delays in transfers from the state oil company to the government and the closure of the El Obeid refinery for maintenance in December 2001.[1012] Declining oil prices also meant that Sudan's share of oil production-compared to that of its foreign investors-fell when oil prices declined. The growth of Sudan's economy meant that demand for petroleum increased, and the government had to import oil to meet this demand, contrary to its rosy predictions of 2000.[1013] Nevertheless, oil revenue did increase in 2001 over 2000.
The government's calculations supplied to the IMF projected a production increase from 209,000 barrels per day to 230,000 for 2002. In order to protect the government from roller-coaster changes in world oil prices, the IMF suggested and the government agreed to a mechanism whereby government expenditures in 2002 would be based on an assumed price of U.S. $ 20 per barrel. Any oil revenue arising from higher prices would be deposited in the Bank of Sudan to prevent sharp expenditure cuts and to smooth out adjustment when oil prices fell.[1014]
Projections for 2002 did not look good. Oil revenue was expected to decline because the increase in production would be more than offset by decline of oil prices and by various agreements with the foreign companies producing oil. In addition, production of 230,000 b/d would reach the current capacity constraint on the GNPOC pipeline.[1015] This meant more investment would be necessary before that pipeline could carry more oil to the sea for export.
But the Sudanese government was fortunate in 2002. Instead of declining, the international price of oil increased from U.S. $ 21.5 per barrel in 2001 to U.S. $ 23.2 per barrel in 2002. The price per barrel was expected to increase in 2003 to U.S. $ 24.5.[1016]
Government oil revenue was higher than ever in 2002: 210.7 Sudanese dinars or U.S. $ 805.1 million.
Government Ability to Stem Post-2005 GNPOC Production Decline Hinges on Block 5A and Other New Production
The government's 2001 projections assumed that GNPOC oil output would reach 230,000 b/d by 2002.[1017] This target was met, and slightly surpassed. GNPOC produced 240,436 b/d in 2002, according to Talisman.[1018]
If Block 5A were to come in to production, that revenue would rise even more. The government was counting on that. In January 2001, the secretary general of the Ministry of Energy and Mining, Eng. Hasan Ali al-Tawn, optimistically claimed that Sudan's oil production would be doubled to 400,000 barrels per day in 2005. Sudan's share of the oil revenues, then between 40-50 percent, would rise to 65 percent when production was doubled, he proclaimed.[1019] This would have to include new production from non-GNPOC concessions such as Block 5A, which was closest to production, and perhaps Blocks 3 and 7 in Eastern Upper Nile, for which any pipeline would have to be built or extended for several hundred kilometers.
But in 2002, Talisman released data revealing what the government as a GNPOC partner already knew: production from the GNPOC concession would peak in 2005 at 250,000 b/d and then would drop off yearly, reaching 40,000 b/d in 2020 and continuing to decrease after that.[1020] GNPOC would never by itself be the source of 400,000 barrels per day but at most would produce 62.5 percent of that goal.
For the government, the predicted peaking of GNPOC production had to be a strong incentive to expand oil exploration and development into other oil blocks-all in the south. Even to keep up with 2002 revenue, to which it had become accustomed, it would be necessary to locate new sources of oil as the old ones dried up. But as of the date of writing this report, neither Block 5A nor any other block has reached the stage of export production
Government Military Spending Almost Doubles in Two Years, Using Up 60 percent of the Oil Revenue
Cash military spending increased 45 percent from 1999 to 2001.[1021] In 2000, defense expenditures were 64.6 billion dinars (U.S. $ 250.9 million) and in 2001 they were an unprecedented 90.2 billion dinars (U.S. $ 345 million), 45 percent higher in just one year.[1022]
The military spending in 2001 soaked up 60 percent of the 2001 oil revenue.[1023] And that represented an increase in military budget of 39.6 percent in the same year, when total government revenue increased only 13.4 percent.[1024]
Conversely, increased military spending would not have been possible without the new oil revenue, absent radical cuts in the already strict IMF-negotiated budget. Total government revenue grew from 205.5 billion dinars (U.S. $ 799.9 million) in 1999 to 370.0 billion dinars (U.S. $ 1.415 billion) in 2001, an increase of 80 percent.
The Khartoum government not only laid out 45 percent more cash for military expenses from 1999 to 2001, it also misled financial analysts about its intentions to increase military spending. In November 1999, Abdul Rahim Hamdi,[1025] chair of the government committee for the allocation of oilrevenue, told a group of oil industry stock analysts, Talisman's guests in Sudan, that military spending amounted to only 15 to 18 percent of the budget. He promised there would be no increases in defense spending.[1026] Relying on this statement, one analyst commented, "The key thing is that there will not be an increase in defense spending by the government."[1027]
The government's statement was false in two respects: at the time, military spending was more than 27 percent of the budget, not 15 to 18 percent, according to the figures the government later gave the IMF.[1028]
Secondly, over the period from 1999 to 2001, military expenditures would increase 45 percent.[1029] The new military spending in 2001 would be 22.4 percent of the increased budget-not 15 or 18 percent as represented.[1030]
That military budget was needed to maintain a large army. In June 2001, the military publication Jane's Intelligence Review estimated that the size of the Sudanese government's regular army was 100,000 and its PDF about 15,000. In addition there were irregular forces which the government "raises from 'Arabized' tribes like the Baggara . . . which dwell along the border between north and south," and "various southern groups, such as the Toposa, Mundari, Fertit and Nuer."[1031] All needed arms and ammunition.
In 2002, government military expenses declined slightly in absolute dollar terms and as a percentage of oil revenue. The government, having learned its lesson about over-optimistic forecasts of world oil prices, projected a modest oil price for 2002, and apparently modified its military expenses accordingly. Government military expenditures were 81.85 billion Sudanese dinars (down 9.25 percent from 2001). Oil revenue exceeded expectations, however. The result was that the military budget consumed only 38.8 percent of the total oil revenue in 2002. Had oil revenue been as low as predicted, the defense budget would have taken a much larger piece of it: as in 2001, military expenditures would have consumed more than 50 pecent of oil revenue.[1032]
Government Uses Oil Wealth for Arms Imports and Industry
For its money, in 2001 Sudan purchased from Russia twenty-two armored combat vehicles and twelve attack helicopters.[1033] In 2002, Sudan bought anothereight amored combat vehicles and four attack helicopters from Russia, plus fourteen large-caliber artillery systems from Belarus.[1034] The cost was not revealed, but the sixteen new attack helicopters more than tripled the existing fleet of six.
The new oil revenue also facilitated a brand-new domestic arms industry. On April 30, 1999, Agence France-Presse quoted a statement in the official newspaper Akhbaral Youm by Hassan al Turabi, a senior Islamist ideologue and then leader of the ruling National Congress party, that the government would use earnings on oil exports to finance weapons factories. According to Hassan al Turabi: "We are currently building several factories to produce our needs in weapons, and we plan to manufacture tanks and missiles to defend ourselves against conspirators."[1035]
When the information that it would use its new oil wealth to create an arms industry caused a storm, Khartoum immediately denied the assertion. Government ministers as well as Hassan al Turabi himself rushed to claim that the oil revenue would be used for construction and development.[1036] But a year later officialdom confirmed what it had earlier denied, as was so often the case. On July 1, 2000, the Al-Shar Al-Syasi newspaper quoted army spokesman Gen. Mohamed Osman Yassin saying that Sudan "will this year reach self-sufficiency in light, medium and heavy weapons from its local production," thanks to its "unprecedented economic boom, particularly in the field of oil exploration and exportation . . . ."[1037]
President Bashir announced on October 27, 2000, that Sudan produced not only rocket-propelled grenades, machine-guns, and mortars, but was also on its way to manufacturing its own tanks and heavy artillery. In a televised speech addressing a group at the inauguration of an industrial complex south of Khartoum, the president declared that Sudan would go on to production of "warplanes and rockets."[1038]
Sudan Suspected of Acquiring Polish Tanks Intended for Yemen, August 1999
As Sudan's export of oil began, the movement of new consignments of heavy weaponry into Sudan reportedly followed. Poland acknowledged in August 1999 that a shipment of twenty Russian-made T-55 tanks it sold to Yemen earlier that year was illegally diverted, and unnamed official sources cited in the Polish press indicated that the tanks were delivered to Sudan.[1039] The shipment constituted the first batch of a total of fifty surplus tanks sold by the Polish state arms agency, ostensibly to Yemen, for U.S. $1.2 million.[1040]
A year earlier Poland had attempted to sell fifty T-55 tanks to Sudan, but the proposed sale was halted under pressure from the U.S.[1041] Both incidents threatened to trigger U.S. sanctions against Poland for violating the unilateral U.S. embargo imposed on military transfers to Sudan on the grounds that Sudan "supports terrorism."[1042]
According to a Polish newspaper, Gazeta Wyborcza, which broke the story of the diverted tank shipment in August 1999, Poland had been warned by the U.S. of the danger that the tanks might be diverted to an unauthorized third country, but it went ahead with the sale to Yemen.[1043] In response to the ensuing scandal, the Polish government halted delivery of the remaining thirty tanks and announced that it would take "further steps" to verify arms recipients in the future.[1044] It also maintained that the Yemeni government had presented credible end user certificates and that Poland did nothing wrong.[1045] In its annual report to the U.N. Register of Conventional Arms, Poland indicated that it had exported twenty battle tanks to "Yemen" in 1999, without noting their ultimate destination. The Sudanese government is known to have used the T-55 tank previously in the south, as the SPLA captured many in its 1997 offensive at Yei.[1046]
The Sudanese governmentdenied allegations made in January 2000 that it had concluded an arms deal with Bulgaria.[1047] In April 2002, the Bulgarian government revoked the arms-trading license of a major Bulgarian arms company that was suspected to have been involved in illegal weapons deals with the government of Sudan. Bulgarian authorities opened an investigation into the alleged transfers.[1048] The deals reportedly involved supplies of spare parts and other equipment to Sudan.[1049] The company said all the transfers were in connection with an approved contract to help build an arms factory in Sudan, but Bulgarian officials said that contract should have been completed and any new transfers were illegal.[1050] Sudan is subject to an E.U. embargo that Bulgaria has pledged to follow.[1051] The Bulgarian government issued a decree, effective April 13, 2001, banning arms sales to twenty countries, including to Sudan.[1052] The decree covers sale and supply of armaments and equipment of any kind, including arms and ammunition, military means of transportation, spare parts and military assistance and training of military personnel [1053]
Government Revenue from Oil, Development Applications?
The government continued to say that the oil revenues were used for development projects, but also continued to admit using oil revenue for the war effort. In June 2001, Talisman CEO Jim Buckee, on a visit to Sudan, said that Sudan's finance minister, Abdel Rahim Jamdi, had told him that 50 percent of the oil proceeds were used for repaying Sudan's foreign debts and the remainder paid salaries of government employees and development projects.[1054]
A statement issued by the Sudan attaché in Cairo said, "Ten southern states receive aid under the Emergency Programme for the Southern States, aimed at refurbishing infrastructure and providing basic services."The statement disclosed that Sudan spent 930 million Sudanese dinars (U.S. $ 3.6 million) in the first six months of 2001 on this program, and anticipated spending 1.9 billion Sudanese dinars (U.S. $ 7.36 million) on this during the second half of 2001, a total of about 2.83 billion dinars (almost U.S. $ 11 million).[1055] Considering that the ten southern mini-states were to divide that money for development among themselves, on average they would receive about U.S. $ 1.1 million each, a rather paltry amount.
If the projected 2.83 billion dinars (U.S. $ 11 million) were actually spent, that would mean that the government spent about 0.7 percent of its total expenditures or 1.9 percent of its oil income in 2001 on development projects for the south..
A comparison of the amounts to be spent on southern development and military expenditures for 2001 reveals that the southern development budget is only 3.1 percent of the military expenditures.
A director of the pro-government think tank in Khartoum, the Centre for Strategic Studies, said Sudan "would not and should not" swear off using oil proceeds to fight the rebels, as the country was constantly under attack by these forces.[1056]
IMF Audits
The Auditor General completed the first audit of the Sudanese state petroleum company (Sudapet)'s oil revenues and the government's oil revenues at the end of 2001, covering mid-1999 to the end of 2000 (the first year and four months of oil export).[1057]
It appears that the IMF staff suggestions for changes to the Sudanese government's and Sudapet's accounting for oil revenue were made as a result of the first audit, in order to increase transparency.[1058] Human Rights Watch believes that these and future audits of Sudapet and government oil revenues should be made publicly available.
Government Uses Oil Revenue to Buy Friends
In mid-June 2001, the efforts of Sudan to parlay its oil resources into better diplomatic relations in the Horn of Africa paid off. It announced that it had signed an agreement with Ethiopia whereby Ethiopia would import 85 percent of its fuel requirements from Sudan beginning in 2002, consisting in gasoline and kerosene. Sudan would allow Ethiopia to build a fuel depot inside Sudan to ensure a steady supply of fuel to Ethiopia by road, the general manager of state-owned Ethiopian Petroleum Enterprise said, adding that Ethiopia would save U.S. $ 7 million yearly by importing from Sudan rather than from outside Africa.[1059] A Sudanese diplomat in Addis Ababa confirmed in early August 2001 that goods had already started moving via Port Sudan and that a highway linking the Sudanese port with the Sudanese city of Gedaref, 150 kilometers from the Ethiopian border, was complete and goods were forwarded from there without problem. But it appeared, from the Ethiopian side, that the road from Gedaref to the Ethiopian city of Gonder was impassable for heavy trucks in the rainy season. Ethiopia announced that it was considering the feasibility of building a 2,000-kilometer railway from Gallabat and Metema in Ethiopia through to Port Sudan.[1060]
These plans have been thwarted, however. An agreement between Sudan and Ethiopia anticipated that in January 2003 Sudan would start exporting 13,000 tons per month of gasoline to Ethiopia-which had until then spent 50 percent of its export earnings on fuel importation from Saudi Arabia and the Gulf states. The first Sudanese shipment was made on January 31, 2003. But then the oil shipments were halted by Sudan on account of a six-week shutdown of its oil refinery for overhaul in February 2003. Then delays in upgrading the Metema-Gedarif road (which was prematurely inaugurated on January 30, 2003) occurred, the feasibility study was months overdue, and the rainy season intervened.[1061]
Ethiopian Prime Minister Meles Zenawi expressed concern that saboteurs could target oil delivery trucks, although that did not take place in the short period of exports. In April 2003 the Ethiopia switched suppliers and signed an agreement with a Kuwaiti company, which was discussing construction of an import pipeline between Addis Ababa and Djibouti. [1062] Petronas and Ethiopia in the meantime signed an agreement for Petronas to explore and develop Ethiopian oilfields in the Gambella region, believed to be an extension of the Sudanese Melut Basin.[1063]
Kenya appeared interested in importing Sudanese oil because it could be imported duty-free pursuant to the terms of the Common Market for Eastern and Southern Africa. When news of likely imports of Sudanese oil became public, Kenyan churches and others protested that Kenya should not engage in such trade with Sudan for moral and human rights reasons. In July 2001, Kenyan authorities banned delivery of Sudan oil shipments to Kenya.[1064] Sudan immediately threatened to stop importing Kenyan tea and coffee, valued at approximately U.S. $ 150 million dollars per annum.[1065] The threat of a trade war caused Kenya's government to back down and end its ban.[1066]As of March 2003, however, talks were still underway between the two governments on Kenya's import of oil freom Sudan.[1067]
At the same time that Kenya was debating whether to import Sudanese oil, South Africa's parastatal oil company Soekor was considering exploring for oil in Sudan. The South African Catholic church, which had sent a mission to southern Sudan in 2000 and issued a statement denouncing the bombing and forced displacement to clear people off the land for the purposes of oil development,[1068] denounced any South African oil business with Sudan. After the South African Department of Foreign Affairs warned the parastatal about the consequences of oil exploration in Sudan,[1069] Soekor denied reports that it intended to explore for Sudanese oil.[1070] The door was still open, however, as reflected in an April 2003 meeting in Khartoum between a South African delegation and Sudanese Minister of Energy and Mining Dr. Awad Ahmad al-Jaz that discussed oil and other investment opportunities for South Africa in Sudan-according to the Sudanese government.[1071]
Increased Government Bombing of the South
Bombing in 1999
Aerial bombardment in southern Sudan, conducted exclusively by the government, was not recorded on a regular or systematic basis until 2000, and even then reports often depended on the presence of foreign witnesses or relief or medical operations (Sudanese or foreign). When there is fighting, such agencies pull out their staff from the place of danger. The few agencies working in Western Upper Nile/Unity State prior to 1998 withdrew from that area starting in 1998 for periods of months at a time, and some pulled their operational bases out of that area, limiting assistance to visits of up to two weeks at most, because of insecurity. The information on bombing civilians and their structures is therefore sketchy and incomplete as it reflects primarily locations where relief agencies worked or tried to work. The relief umbrella, the OLS, noted these areas as a regular part of its undertaking to endeavor to protect relief workers from the dangers of the armed conflict.
In some other areas of the south, particularly Equatoria which is closer to Uganda and Kenya, transport is by road, some civil society organizations and churches have a more permanent presence, evacuations are less frequent, and record-keeping is not as difficult. While this geographical area is outside the scope of this report, we include the information on bombings here as an indication of patterns in other war zones, and of government spending on munitions and weapons enabling such bombings to be carried out.
Hospitals, whether they cater to civilians or serve only the military, are strictly off limits for military attack.[1072] Civilians and civilian objets and structures such as churches and schools and homes are also not legitimate military targets.[1073] Several human rights groups had discussed this fundamental rules of war concept with various government officials over the years, apparently to no avail.[1074]
In January 1999, the MSF-Holland civilian hospital with a surgical unit in Kajo-Keijii, Equatoria, was bombed by the government; in all, a total of sixty-six bombs were dropped on the hospital area in 1999, with thirteen hitting the hospital premises. Because of this and other bombings of its medical facilities, in which its staff and patients were eyewitnesses and sometimes victims, MSF undertook a study of bombing in 1999 limited to four counties, Kajo Keijii, Yei, Maridi, and Kapoeta, in Eastern Equatoria. It found that from January 1999-January 2000, in the Kajo Keijii area alone, a total of almost 400 bombs were dropped on the civilian population and civilian structures, killing at least twenty-two persons and injuring fifty-one. There were sixty-four separate bombing incidents recorded, with the number of bombs dropped ranging from one to twenty-four per incident.
The bombings were documented by MSF teams in the four specified counties, and identified separately in an appendix showing date, time, location, number of bombs, and casualties and structures damaged.
MSF concluded that "the bombings are aimed at the civilian population and civilian targets, in particular hospitals and schools" and that there was "a [Sudanese government] policy of terror which provokes new displacements of the population and increases the precariousness of the civilian population."[1075]
MSF, which had worked in Eastern Equatoria since 1997, noted a sharp increase in the bombing in 1999 over the bombing in 1998.
Increased Bombing in 2000
The U.S. Committee for Refugees (USCR) published a study of aerial bombardment targeting civilians in the south and the Nuba Mountains in late 2000. The greater numbers of bombings in 2000 were remarked upon by civilians and relief workers alike. "They're bombing a lot," said the country director for an organization whose civilian hospital (outside the oil area) was bombed repeatedly in 2000. "Coincidentally with the opening of the pipeline, all sorts of things are happening."[1076]
The USCR calculated that bombing in the south and the Nuba Mountains doubled in 2000 over 1999,[1077] at the same time as the government oil revenue increased.[1078] By reviewing records kept by several agencies and the U.N., it estimated that there were 132 aerial bombardment incidents or attacks in 2000. Another source, based in Nairobi, conservatively charted bombing incidents in the south as they were reported in the months of March and June-December 2000. These bombs hit civilian structures, injuring and killing civilians.[1079]
Most of the recorded bombs in 2000 struck locations outside of Western Upper Nile/Unity State. But Western Upper Nile/Unity State was the most militarily active area in Sudan overall in 2000, according to the U.N.'s Consolidated Appeal for 2001. It stated, "the main conflict area has been in Unity State (Western Upper Nile) around the oil rich areas, with devastating effects on the populations of these areas."[1080] It is likely that government bombing there was much greater than noted by outsiders as much of the military activity was in areas the relief organizations were forced to abandon because of insecurity.
In any event, the oil revenue secured by those military activities in Western Upper Nile/Unity State was used for government military expenses all over Sudan. Numerous examples indicate that government planes continued to target schools, relief activities, churches, and other civilian sites in the south. A few of the cases are described here as indications of how the government of Sudan chose to spend some of its oil revenues in the new century.
On February 8, 2000, government bombing killed fourteen children and a twenty-two year old teacher at the Upper Kauda Holy Cross School in the Nuba Mountains. Most of the victims were first graders attending an English lesson under a tree. Eight more bombs hit two villages close to the school shortly thereafter. An amateur video, shot by a visiting Nuba film student minutes after the bombs hit the children, captured the mayhem: children crying and screaming, some of whom threw dust on their heads while others beat their chests to show grief. Still others sat dazed, missing limbs.[1081] Many foreign countries condemned the bombing.[1082]
An official of the Sudanese embassy in Nairobi saw the amateur film and said, "The bombs landed where they are supposed to land. . . . the bombs landed into a military camp. The SPLA has pulled people into this military camp."[1083] International aid workers, however, said that government aircraft bombed schools and other civilian targets.[1084] Sudanese Foreign Minister Mustafa Osman Ismail admitted that the civilians might have been hit unintentionally, but "the area in which the incident occurred is a military operations area where the rebels gather their forces."[1085] The amateur film illustrated and eyewitnesses insisted, however, that the location was a school and not a military camp or operations area.
In 2000, the government deliberately-and repeatedly-targeted a hospital run by the U.S. NGO Samaritan's Purse, in Lui, Western Equatoria, eighty-five miles northwest of Juba in SPLM/A territory. This hospital, known for its tuberculosis clinic, had one of the few X-ray machines in the entire country. More than one hundred patients were being treated or housed at the hospital when the first bombs hit on March 1, 2000. Planes reportedly dropped twelve bombs, killing several, injuring more than ten, and scaring many tuberculosis patients away.[1086] The government bombed the hospital a second time the same week,[1087] and then for the third and fourth times on March 22 and 23.[1088] Such repeated hits suggest it was no mistake.
In Nimule, an SPLM/A town on the Nile near the Ugandan border, German church officials witnessed and were nearly injured in the government bombing of a school and church on March 14, 2000:
At 10.00 a.m. a shrapnel bomb exploded less than 200 meters from the [primary] school where more than 1000 students were attending classes. During the following hour 6 attacks were flown and 12 shrapnel bombs dropped. One civilian was killed and eleven were injured, some of them seriously. Several houses were destroyed, the Episcopal church received a direct hit, destroying it completely.[1089]
It appeared that the windfall oil revenue may have enabled the government of Sudan to afford repairs and operating expenses for its military aircraft. The SPLM/A claimed that the Sudanese government used MIG-23 jet attack aircraft on Mundri in southern Sudan on April 19, 2000, and near relief agency compounds in Tali, southern Sudan, on April 16.[1090] The government had some six MIG 23s in stock,[1091] apparently purchased after being refurbished in China in 1993-1994. It tested them near the time of purchase and delayed their deployment because one crashed.[1092] It does not appear that they were deployed again until 2000.[1093]
The south and the Nuba Mountains do not have the kind of terrain or military infrastructure in which high-altitude bombing by Antonovs would produce a military advantage. The rebel soldiers are usually on the move. In the south and in the Nuba Mountains, buildings of any size are civilian in nature and presumptively immune from military attack under the rules of war, i.e., schools, churches, relief storage tents, and medical units. The same is true of small markets, bore holes for water, and homes and cattle byers with thatched roofs; they are of no legitimate militarily interest unless they house soldiers or war materiel at the time of the attack.
The frequent Sudanese government use of aerial bombardment where there are no rebels or other legitimate military objectives on the ground must lead to the conclusion that it uses aerial bombardment to terrify the civilian population and destroy what little infrastructure and community facilities exist in the south and the Nuba Mountains.
Bombing Condemned, April 2000
Sudanese churches, both in government-controlled and rebel-controlled areas, concluded that oil development should be stopped because it was contributing to the war. As the "shepherds of the population in the Sudan," the Sudanese church officials, north and south, called upon peace loving people and the international community to take immediate actions to force the withdrawal of the oil companies helping the government of Sudan to confidently pursue the war. They also called for a "no-fly zone" for military aircraft.[1094]
Officials of other churches joined the chorus of condemnations. A delegation of the Southern African Catholic Bishops' Conference, which visited Sudan from March 20-31, 2000, during that month's government bombing campaign, issued a report stating that:
Indiscriminate bombing of civilian targets continues unabated. The use of high-flying Antonov aircraft enables the government of Sudan to hold the local population in a grip of terror. Popular targets of the bombers are churches, schools and clinics run by the [Catholic] church. . . .[1095]
It would seem, the report continued, that in order to enable oil companies from Canada, Malaysia, China, and others to tap the resources unhindered, the government of Sudan was systematically clearing the oil areas of people. "This bodes ill for any efforts at a peaceful resolution of the conflict," the churchmen added.[1096]
Many relief organizations, U.N. entities, and governments had, by mid-2000, denounced the government's intensified targeting of civilian relief sites, churches, hospitals, and homes.[1097]
In Geneva, the U.N. Commission on Human Rights passed a resolution on April 18, 2000, expressing its "deep concern" at the situation in Sudan and calling on the government "[t]o stop immediately the aerial bombardment of the civilian population and civilian objects, including schools and hospitals, which runs counter to fundamental principles of human rights and humanitarian law."[1098] The same day, the president of Sudan announced on national television a halt to air strikes in southern Sudan, except for "self-defense" or "where forces are engaged in combat, and where there is active operation in order to protect civilians."[1099]
But despite this announcement, the bombs continued to fall on civilian targets.[1100] Curiously, Sudanese President Omar El Bashir called on international agencies-many of which had complained about the bombing-not to "mix with civilians."[1101] It is impossible to assist civilians without "mixing" with them, especially with regard to their nutritional and medical needs.
In May 2000, the European Union issued a belated statement, welcoming the announcement that the Sudanese president "had ordered the cessation of aerial bombing of targets in South Sudan." The E.U. said it would "continue to watch closely on the fate of civilian populations in this area."[1102]
U.S. Attempts to Obtain an End to Civilian Aerial Bombardment, 2001/2002
Former U.S. Senator John Danforth was appointed U.S. presidential special envoy for peace in Sudan on September 6, 2001. Among the four agreements he initially proposed to the parties, the Sudanese government and the SPLM/A, was a cessation of bombing and artillery attacks on civilians in southern Sudan. Senator Danforth visited Khartoum several times and during his January 2002 visit Ghazi Salah el-Din Atabani, the government's peace minister, offered what he called "a voluntary, unlitateral cessation of aerial bombing for four weeks as a test."[1103] This offer, however, was contingent on the SPLA laying down its weapons. In response John Garang, the leader of the SPLM/A, stated that "nobody should bomb civilian targets; it's an insult to human rights. . . . For a member of the United Nations and Organisation of African Unity to present this as a concession … is laughable."[1104] In the course of negotiations, however, Senator Danforth suggested an agreement banning all targeting of civilians and civilian objects, not just a ban on aerial bombardment of civilians.
By the end of that Danforth trip, the government of Sudan had agreed to all four points proposed by Senator Danforth as indications of the parties' serious intentions to make peace-except for the point on cessation of attacks on civilians. Danforth expressed regret, saying, "[Ending] the direct, intentional and egregious [flagrant] attacks on civilians is the key to our proposals…I am sorry to say we have made no real progress on these issues."[1105]
The U.S. continued to insist on an end to attacks on civilians as one of the conditions precedent to taking up a formal and active role in any Sudanese peace negotiations. The Sudanese foreign minister, Mustafa Osman Ismail, led a government diplomatic delegation in a visit to Washington, D.C., in early February 2002, and U.S. officials there pushed him to accept a ban on civilian attacks and, in addition, international monitoring of violations of that ban. Ismail, in line with Khartoum policy, continued to resist this proposal.[1106]
On February 9, Nimne in Western Upper Nile/Unity State was bombed, leaving five dead, including a nurse working for MSF, James Koang Mar. Staff visited Nimne on February 14 and saw that there were three bomb craters in the church compound, where James Koang Mar was at the time of the bombing. The church was forty meters from the MSF compound. MSF had maintained a permanent presence in Nimne, a center for displaced persons, since September 2001. These attacks did not generate much attention.[1107]
Also on February 9, 2002, a Sudanese government Antonov dropped six bombs on Akuem, Bahr El Ghazal, at about 5:00 pm. The WFP team had just completed a food drop at 2:00 pm for 18,000 people and had returned by plane to their nearby base. Three bombs landed in the WFP food drop zone and the other three bombs landed nearby. A twelve-year-old girl standing under a tree was killed, as was another child, and there were some ten to twelve casualties, including patients inside an MSF-France clinic.[1108] This time, the attack attracted broader attention, including a forceful denunciation by the U.S.: "The United States is outraged by the [Sudanese government's] aerial strike against a civilian target . . . . They have broken Khartoum's pledge to the U.S. Special Envoy for Peace in Sudan . . . to end bombings of civilian targets for a period of four weeks."[1109] The Sudanese government, for the first time ever, said that it regretted the incident and promised to investigate.[1110]
Then, on February 20, two government helicopters attacked the village of Bieh, north of Ler in the Lundin Block 5A concessionin Western Upper Nile/Unity State, during a WFP food distribution. The two helicopters hovered over the WFP compound and fired five rockets into the surrounding area where the food distribution was in progress, at about 1:20 pm. The attack resulted in at least twenty-four civilian deaths in the presence of two U.N. personnel; seventeen died immediately and the rest died shortly thereafter of their injuries. Dozens were injured. Those killed and injured were waiting for food rations.[1111]
The WFP condemnation, by its executive director Catherine Bertini, of the attack on Bieh was scathing: "Such attacks, deliberately targeting civilians about to receive humanitarian aid, are absolutely and utterly unacceptable. . . . This attack-the second of this kind in less than two weeks-is an intolerable affront to human life and humanitarian work."[1112]
On February 21, the U.S. State Department denounced the attack. It demanded "an explanation of how one part of the government can negotiate with the United States an agreement to end attacks against civilians while another part of the government is deliberately targeting civilians."[1113] The U.S. suspended all negotiations with Sudan on the Danforth initiative until the explanation was forthcoming.[1114] Khartoum attempted to evade responsibility for the bombing, blaming the incident on a local commander who allegedly acted without sanction from Khartoum.[1115] Many others, including WFP, the U.N. at a high level, many European countries, the E.U., international NGOs, and even Talisman (privately),[1116] denounced the attack.
The Sudanese government protested the U.S. suspension of peace talks and denied that it deliberately targeted civilians.[1117] The government announced that its ministry of defense had set up a high level commission of inquiry to investigate the Bieh "incident" and would present its report and recommendations to the competent authorities as soon as possible. It also said that a number of measures had been taken to ensure strict coordination among the concerned authorities in the area, referring to the fact that it had pre-approved the WFP delivery of food at Bieh for February 20, the day of the bombing.[1118]
The results of the Sudanese government investigation of what occurred at Bieh were not made public, but on February 28 the government's peace minister, Ghazi Salah Eddin Atabani, said, in a statement issued by the Sudanese embassy in London, that a government helicopter "mistakenly opened fire on a (UN) World Food Programme aid delivery." The minister also said,"We deeply regret this appalling event."[1119] WFP spokesperson Laura Melo said that she found it "'highly unlikely'" the troops aboard the helicopter thought they were attacking a military target.[1120]
Following the international outrage at the attack, the Sudanese government signed the "no attacks on civilians or civilian objects" agreement proposed by Danforth, on March 10, 2002. The SPLM/A signed on March 25.[1121]
Oil remained central to the parties' concern about this "no-targeting civilians" agreement. The Sudanese government sought language stating that oil installations were "civilian objects" and the SPLM/A sought the reverse language. The agreement was silent on this point, leaving it to the monitors to be deployed in the south to decide on a case-by-case basis. Those monitors, however, were slow to come on the scene.[1122]
NEGLECT OF THE ENVIRONMENT
The oil industry in southern Sudan is expanding rapidly-producing up to 240,000 barrels per day in 2002 from no production in 1998. There has never been any comprehensive study done of the potential effects that oil production could have on the environment-flora and fauna and the complex web of Nile, sudd, and toic waters where so many species flourish-or on human populations or their migrations on which their agro-pastoral economy depends. The government has not mandated any study-except one done on the intended pipeline route in August 1998, which passes mostly through central and northern Sudan, avoiding the White Nile and the Bahr El Gazal and Bahr El Jebel -and if the oil companies have produced any others, they have kept the results hidden.
Warnings by Sudanese environmentalists in 1999 of possible damage by the oil companies' methods of work were effectively swept under the carpet.
Environmental Issues Regarding the Sudd and the Jonglei Canal
The sudd is the largest freshwater wetland in the world, covering an area of 1.7 million square kilometers in the rainy season. It encompasses many oil concession blocks, including part of Block 4, most of Block 5A, Block 5B, and territory south and east of them, in the concession of TotalFinaElf, Block 5.
The sudd is home to many migratory birds and animals; the known 550 shoebill storks in the world are only found in the sudd, according to one source.[1123] Some 350 plant species have been identified in the sudd and up to 250 species of birds have been recorded. The area is rich in fish and wildlife: hippopotami and crocodiles live permanently in the swamps, in greatly diminishing numbers. The sitatunga antelope is also adapted to living in the southern swamps. Elephants and buffaloes used to migrate between the swamp and the toic, and other wildlife including zebras, Mongala gazelle, reedbuck, giraffe, ostrich, waterbucks, and white-eared cob migrate seasonally from the toics. The most hunted animal is the tiang antelope.[1124]
The environmental impact of the Jonglei Canal, projected to cut an almost straight line through Block 5 with a 360-kilometer canal northeast from Bor on the While Nile to the Sobat River, draining an estimated 25 million cubic meters of water per day from the sudd and toic, was studied by the British prior to independence.[1125] The canal, however, has not been a viable project for two decades, due to the war. It was not complete before the civil war broke out again in 1983, in 1984, using its first-graduated troops from Boma, Ethiopia, the SPLA destroyed the mechanical digger, the largest in the world, and drove out the French consortium building the canal, CCI.[1126] It is unlikely that this project will be revived until the war is over, if ever. Southerners say that the Jongelei Canal would suck all the water from other tributaries and the sudd, destroying their ability to water their cattle in all seasons. Conflicts over grazing and water sources would escalate as herders would be forced to crowd together on the edges of the canal.
There is already oil development in the sudd, in Block 5A, where an all-weather elevated road has been built. The road inserts a barrier to the movement of floodwater, but its effects on the local population and environment have not been studied. Nor does it seem likely that these vital factors nor the pipeline to be extended into Block 5A will be studied as a consequence of government law or regulation, or oil company conscience.
The International Partners' Forum Working Group (IPF-WG), which supports the regional peace negotiation effort undertaken by Sudan's neighboring countries through the Intergovernmental Authority on Development (IGAD),[1127] was tasked with formulating a planning framework for recovery of the war-affected areas of Sudan following a peace agreement. The IPF-WG, whose active members are eight governments, the E.U., and five U.N. agencies,[1128] developed several themes for which consultancies were undertaken. A low priority consultancy was assessment of environmental conditions: natural resources, forest, and wildlife. No donor interest was indicated, and there was no consultancy contracted for and no progress reported on this topic.[1129] This lack of interest in preservation, conservation, or study of the rich environment of southern Sudan is striking.
Although the southern environment was extensively documented between 1947 and 1983, none of the agencies involved or the authorities nominally responsible gives it any urgency, and species such as the northern white rhino have thus been lost.[1130]
Warnings about Environmental Impact of Oil Extraction
In February 1999, Sudanese environmentalists complained that the processes China's CNPC, part of the GNPOC consortium, used to extract oil from the wells produced contaminated water which would surely seep back into the underground waters.[1131] According to the group, Sudanese Environmental Conservation Society (SECS), CNPC had completely ignored their warning of the ecological hazards its project would cause. The SECS is a leading progressive environmental NGO, the pioneer environmental NGO in North Africa, according to a forthcoming book.[1132]
Ecologists also criticized the oil industry for not conducting a careful study of environmental impact, blaming local oil planners for failing to consider the effect of the pipeline on access of wildlife to water, in particular. They further stated that the refinery in Jaili, on the Nile river in northern Sudan, would contaminate the river if overspills occurred. They warned that alleged uncontrolled dumping of oil waste by the refinery, under construction by CNPC, constituted a pollution threat. The Malaysian firm hired to supervise the work did not have local expertise necessary to avert such problems, the environmentalists charged.[1133] (That refinery was inaugurated on June 30, 1999 and completed in 2001.[1134])
Apparently as a result of this warning by an environmental group, the government announced that it had set up a panel to examine potential environmental hazards that could result from the commercial exploitation of oil. The panel was to be headed by Agnes Lukudu, formerly governor of a southern state and at the time of the appointment, the minister of labor.[1135]
On May 9, 2000, the minister of energy and mining, Dr. Awad Ahmad al Jaz, addressed a workshop on the role of legislation in environmental conservation in the petroleum industry.[1136] A month later, the minister of environment and tourism, Maj. Gen. (Ret.) Al Tijani Adam al Tahir, announced a new environmental protection law to meet challenges facing the environment, and to coordinate between the various agencies to protect the environment. He emphasized the need to conduct environmental impact assessment studies before the implementation of development projects.[1137]
Talisman forwarded a copy of the environmental legislation passed in Sudan in 2000 to Human Rights Watch, at our request.[1138] It was general and did not mandate any action, even the filing of environmental statements by companies. Regulations remained to be promulgated as of the writing of this report.[1139]
Talisman's and GNPOC's Limited Environmental Impact Assessment, August 1998
At the request of Human Rights Watch, Talisman provided a copy of an environmental impact assessment report carried out for the GNPOC pipeline system. It was completed in August 1998, prior to Talisman's full involvement in Sudan. The assessment in English was a forty-two page document, with an additional five annexes and eight illustrations, and contained a section on "Resettlement and Compensation (if any)," less than one page long.[1140]
It appears that only the pipeline, flowing mostly through government-controlled territory, was assessed. It does not appear that any environmental assessment was conducted with regard to the large area of exploration and development of the oilfields (the "upstream" sector) in the GNPOC concession of Blocks 1, 2, and 4, which includes the area referred to by the Sudanese environmentalists. Further contacts with Talisman elicited the following response from representative David Porter:
To the best of my knowledge, an environmental assessment was not completed in advance of upstream developments [exploration and extraction], probably because upstream exploration and development proceeded incrementally over a protracted period of time.
The [Sudan] Environmental Policy Act (1998) does articulate a requirement for environmental impact assessment in support of major development projects; however, much of the development in the upstream would have already taken place prior to the advent of this statutory requirement. We (Talisman) are in the process of recommending to GNPOC that they institute an environmental planning standard for new developments in the upstream (road access, wellsites, borrows, facilities, etc.).[1141]
Talisman also forwarded its GNPOC HSE (Health, Safety, Environmental) Policy for operations in Sudan, which was very general.[1142]
Block 5A: Lundin Claimed Environmental Impact Study Done
Lundin said that it carried out an environmental impact study with a specialized third party organization based in the U.K. (later identified as Metok PLC of London) but it has not shared that study with any NGO to date, nor made it public, although Human Rights Watch requested a copy.
It is startling that no environmental assessment of Block 5A has been published by Lundin, considering that the White Nile (Bahr El Jebel) flows through Block 5A and that the Ryer/Thar Jath discovery is only a few miles west of the Nile. Indeed, Lundin was even exploring from a platform on the Nile in 1999, before it suspended operations. Eyewitnesses referred to the platform as "on the Nile;" Lundin said that it was actually in the "swamp." As water floods annually throughout this flat land, the difference between swamp drilling and Nile drilling for environmental protection purposes may not be significant.
The location of Block 5A astraddle the White Nile raises the question: what if there is an accident during the production and oil spills into the Nile, a river on which millions of people depend? The oil spillage would flow downstream, that is, north, to Khartoum and Cairo. An oil spillage not directly into the Nile but into the sudd or toic would also have enormous environmental impact, particularly during the rainy season when the entire area is flooded. As the waters recede, oil slick would remain on the pastures and in the fishing areas far and wide.
Lundin should describe how it plans to handle such a possibility, starting with precautions taken during the exploratory phase of development.
Lundin featured in its annual report for 2000[1143] a page on Lundin Oil environmental policy, with a case study of Sudan. In that study, it stated that Lundin commissioned two environmental studies for its operations in Sudan, conducted by Metoc PLC of London.
The first study, a risk assessment for IPC [Lundin] Sudan's operational bases, was done "to formulate a policy and programme on how to deal with safety and environmental issues related to the former Chevron bases and any impact from these on Lundin Oil operations." It reportedly concluded that there were no major issues identified giving rise to serious environmental or safety concern.[1144]
The second study was called the "Environmental Assessment for Exploratory Drilling and Operations Review – Sudan," which consisted of an examination of the drilling project from the operational and management perspectives. Potential impacts on the human population, domesticated animals, vegetation, wildlife, surface and subsurface watercourses allegedly were analyzed and the conclusion was that "no significant environmental impacts were identified, either during normal operations or in an emergency situation."[1145]
The study is not publicly available, so it is not possible to evaluate its conclusions, in particular that an oil spillage would have "no significant environmental impact." In its Code of Conduct, Lundin stated that it strives "to limit adverse impacts on the environment."[1146]
Lundin claimed that the assessment of human habitation of the area between Rubkona and Ryer/Thar Jath "indicated low density population settlements in the area."[1147] What month and year the study was made are not known.[1148] The Jikany, Leek, and Jagei Nuer living in that area were agro-pastoralists and moved seasonally with their herds. Even in normal times, it would be possible for someone studying the area when the agro-pastoralists were in seasonal migration to conclude that the population was very small-but conditions in that part of Block 5A have not been "normal" for years. As a result of the forced displacement of Leek Nuer from their lands north of Bentiu in the 1980s and 1990s, more rather than less Leek Nuer would be living in Block 5A, because the Leek traditionally straddled Blocks 1 and 5A and those from Block 1 fled from the army and the Baggara to their kin south of the Bahr El Ghazal (Nam) River in Block 5A in the 1980s and 1990s. Now the Leek have been pushed south and west, into Bahr El Ghazal.
While the environmental program of OMV is extensive, it makes only passing reference to Sudan, and it does not appear that OMV has conducted an environmental impact statement with regard to its investment in Block 5A.[1149]
Nor, to the knowledge of Human Rights Watch, has there been any environmental study of the effects of the extension of the pipeline from Block 1 to Block 5A-nor to Block 5B.
Satellite Evidence of Alteration to the Environment and Drying Out of River/Stream Bed
Talisman, as part of its campaign to disprove the existence of human beings in its concession areas, commissioned a special report of satellite images showing the changes in carefully selected parts of the earth's surface in Western Upper Nile/Unity State from 1965 to 2000.[1150] This was presented for the purpose of showing a lack of human habitations, but other interesting material is available in the expert analysis provided by Talisman itself.
Looking at the Bamboo exploration and drilling site, to the southeast of Heglig (far from those alleged to have been displaced), it is noted that:
[W]here the new road intersected the previous line of water drainage/flow [as evinced from the growth of law scrub and other vegetation] [sic] the natural flow of moisture may have been inhibited and effectively dried out the river/stream bed . . . .
. . . the imagery indicated changes to the underlying water table of the area with the construction of numerous raised roadbeds and survey excavations. . . . Although the principal north/south watercourse appears little changed interim, the remainder of the area displays apparent changes to the probable flood plain.[1151]
In other words, the water table was affected by the construction of the roadbeds and survey excavations. In other countries, similar effects on drainage caused by roads built for oil companies have caused devastating problems for the local environment.[1152]
PART IV: FOREIGN CORPORATE COMPLICITY, FOREIGN GOVERNMENT SUPPORT
TALISMAN AND CANADA, 1998-2000
Talisman's Decision to Invest
Talisman began seriously to investigate the possibility of investing in Sudan in 1998. At that time, Arakis' failure to obtain sufficient financing was evident to its partners CNPC, Petronas, and the Sudanese government. A pipeline was under construction and had to be completed in 1999.
A new Sudanese constitution was implemented on July 1, 1998, with an appearance of broader rights. The war begun in 1983 was still raging in the south, however, and had expanded to the Nuba Mountains and eastern Sudan; just a year before the adoption of the 1998 constitution, the SPLA had retaken many garrison towns from the government, all the way from the Uganda border up to and almost reaching Wau, the second largest town in southern Sudan. In addition, in 1998 there was a major famine in Bahr El Ghazal and relief agencies attracted prime time coverage with their warnings that Western Upper Nile/Unity State was on the edge of famine because of the fighting and government bans on access by humanitarian relief agencies. Human rights reports on Sudan proliferated, by the U.N. special rapporteur on human rights and by nongovernmental groups, denouncing the government as a gross abuser of human rights. The government had its Khartoum Peace Agreement, signed in April 1997 with several small and one respectably-sized southern factions. Riek Machar, head of the largest faction, was assistant to the president of Sudan and head of the SSCC and an army cobbled together of ex-rebel troops, the SSDF. His close political ally was governor of his home area, Western Upper Nile/Unity State, where GNPOC had its concession.
Two government-backed and armed Nuer groups, Riek Machar's SSDF and the militia of Sudanese army Maj. Gen. Paulino Matiep, were fighting each other in 1998 in Western Upper Nile/Unity State and several of the towns in that state had been burned and looted, with thousands of civilians displaced. This was a war that was not limited to fighting between the government and the rebels: even those ostensibly on the same side fought each other.
Then there was the Chevron experience: Chevron had abandoned its potentially lucrative southern project in 1984 because rebels had killed three of its employees in the very concession Talisman was about to buy. And rebels continued to threaten oil operatives in Sudan, in general. Arakis received threats from rebel groups[1153] as early as 1995 but played them down.[1154] If this project took off as projected, it would attract even more negative rebel attention. So far, it was the only major oil project in Sudan under active development.
There was also the domestic challenge to Talisman's involvement in Sudan: the Canadian nongovernmental Inter-Church Coalition on Africa (ICCAF)[1155] was actively opposing Canadian oil company investment in Sudan. Referring to Arakis, an ICCAF press release dated July 20, 1995 accused: "Canadian oil firm does business with one of the world's worst human rights abusers."[1156] The industry press carried news of these human rights criticisms of Arakis, including the PetroleumIntelligence Weekly.[1157] This criticism did not let up.
On August 17, 1998, Talisman announced that it would acquire Arakis and Arakis' main asset, the Sudan project.[1158] Before Talisman closed the Arakis deal, the Taskforce on the Churches and Corporate Responsibility (TCCR, another Canadian nongovernmental group) protested by letter of August 28, 1998 Talisman's announced intention to invest in Sudan, citing human rights abuses.[1159]
Talisman proceeded with the acquisition of all outstanding shares of Arakis, which was completed on October 8, 1998.[1160] Talisman acquired a 25 percent interest in GNPOC's Blocks 1, 2, and 4 and the incomplete pipeline and port, on which construction had started in May 1998.[1161]
On November 18, 1998, Canadian NGOs that had been protesting Arakis' presence in Sudan issued a press release denouncing Talisman's participation in Sudanese oil development, with allegations about forced displacement from the Talisman concession:
According to these reports, Sudanese government forces and the militias armed and directed by the government have cleared the area of local people (whom the Sudanese government believes could be sources of support for the rebel Sudan People's Liberation Army) in order to secure the safety of Canadian and other foreign oil workers and increased oil production.[1162]
Talisman Failure to Investigate Allegations
Although Talisman continued to insist that there were "no people" living in its operational areas, Talisman officials told Human Rights Watch in early 2000 that they had not consulted relief agency documents nor relief personnel operating in southern Sudan when they conducted their review of the Sudan project prior to acquiring Arakis, nor after they started doing business in Sudan.[1163] The relief documents, most of which were readily available on the internet, would have been useful to corroborate displacement and military activity affecting the civilian population, although the agencies rarely name those forcing the displacement.[1164]
In addition, Talisman officials were made aware of serious concerns about the implications of their explorations on numerous occasions by various other sources, including representatives of Unity State (at that time from Riek Machar's United Democratic Salvation Front/South Sudan Defence Forces (UDSF/SSDF)), statements by the Canadian government, and pressure from Canadian NGOs, among others.
What Riek Machar Said He Told Talisman, 1998-99
The first encounter between Talisman executives and Nuer leader and then-Assistant to the President of Sudan Riek Machar occurred prior to the date when Talisman bought into the project. According to Riek Machar, he told Talisman President and CEO Jim Buckee in Khartoum before August 1998 that oil operators must avoid displacing the civilian population and must take steps to maintain friendly relations with the local populace, by installing clinics and schools. He suggested that the oil companies should maintain close relations with his army, the SSDF, which he said was the only force that could guarantee the safety of Talisman's operations.[1165]
But according to Talisman's written response to Human Rights Watch, "At all such meetings prior to the start-up of oil production, neither Dr. [Riek] Machar nor [governor of Unity State] Taban Deng ever raised the issue of displacement of civilians from the GNPOC concession area."[1166] Talisman officials remembered that Riek Machar assured them the area was free from conflict.[1167]
Riek Machar told Human Rights Watch that his second meeting with Jim Buckee of Talisman took place in the presidential palace in Khartoum later in 1998; an elderly director of Talisman was also present. Riek Machar said that when he accused Talisman's shareholders of a lack of concern about the suffering of the Nuer people, the director accompanying Buckee became angry and insisted that they did care. Riek Machar said that he informed the company officials that oil operations had displaced people, and that the officials neither agreed nor disagreed with this statement.[1168]
According to Talisman, there were several meetings between Riek Machar and Talisman, attended by Jim Buckee, Vice President Jackie Sheppard, and others. In a written response to Human Rights Watch, Reg Manhas, Talisman's senior advisor for corporate responsibility, said that during a meeting in October 1998, "there was no issue of civilian displacement raised by Dr. Riek Machar."[1169]
Riek Machar told Human Rights Watch that at his third meeting with Talisman-in September 1999, after the first pipeline sabotage-he told Jim Buckee (accompanied by Jackie Sheppard) that the problem was Maj. Gen. Paulino Matiep. Riek Machar assured the Talisman officials: "We do not want to drive you out. Use your influence on the government to stop Paulino Matiep." He said that when SSDF Cmdr. Tito Biel, under Riek Machar, attacked Ryer/Thar Jath (in Block 5A, the Lundin consortium) in May 1999, it was not an attack against the oil companies. Cmdr. Tito Biel had escorted oil workers from Ryer/Thar Jath to Bentiu and did not destroy the oil facilities. The reason for the attack, according to Riek Machar, was that the government of Sudan was bringing its troops into the area. Riek Machar said that at this meeting Jim Buckee expressed concern for the security of Talisman's operations, and said he wanted to know the truth of what was happening in the south.[1170]
Talisman officials said their last meeting with Riek Machar-at which UDSF governor of Unity State Taban Deng was present as well-took place just prior to Riek Machar's resignation as special advisor to the president of Sudan and after oil production was underway; Riek Machar left Khartoum in mid-December 1999 and resigned from government positions on January 31, 2000. According to Talisman, at that November or December 1999 meeting Riek Machar "made a statement that 400,000 people had been displaced from the general oilfield area," though "[a]t no time were any village names mentioned."[1171] The company did not provide Human Rights Watch with any other information about this meeting.
Despite the discrepancies, both sides therefore acknowledge that Riek Machar did, at one point or another during the period he held an official government position, tell Talisman officials that large numbers of people were displaced from the oilfield area. Some of the conversations occurred after the massive May 1999 displacements from Ruweng County/Pariang.
After he resigned from the government in January 2000, Riek Machar disputed several statements on displacement made by Jim Buckee in a November 23, 1999, Talisman letter to shareholders.[1172] In a reply letter dated May 5, 2000, Riek Machar claimed that at a meeting in Khartoum with Jim Buckee:
I told you Heglig (Aling) was a Dinka village in 1983 and three kilometers south of Aling was a Nuer village called Yaak. From Aling to [Rubkona] there were many villages and the government sponsored Arab nomadic militia destroyed them all to make way for oil explorations and production. This barbaric act was the main reason that made the people of Liech [Western Upper Nile/Unity State] swell the ranks of the insurgency in 1983.
Riek Machar wrote that the Sudanese army in 1998 destroyed even the local Dinka village that had sprung up in Heglig as a result of the oil operations. Riek Machar continued: "Anybody who tells you the area is not habitable is only dragging you to the war, as your predecessor the Chevron was in 1985." As to Talisman's responsibility, he asserted: "There is no way you would deny your participation in the forced displacement of the people of Liech [Western Upper Nile/Unity State]. It is not forced relocation, as you referred the act to be, but it is forced displacement by the barrel of the gun."[1173]
Talisman stated the first time it knew of this letter and its content was not in December 1999 but some time in May 2000 after the letter was posted on the website of the Sudan People's Defence Forces (SPDF), the new military/political group formed by Riek Machar after defecting from the government.[1174]
What Gov. Taban Deng Said He Told Talisman, 1999
Talisman representatives met UDSF Gov. Taban Deng of Unity State in his official capacity three times, according to the governor, who was expelled from his office in May 1999 by the Sudanese army under Maj. Gen. Paulino Matiep. Gov Taban Deng said:
I talked to Talisman in February 1999. They asked if there had been any people displaced by them. I told them about the market that existed before the locals were burned out. . . . I told Talisman about the displacement from Heglig and the discontent with the company's operations in Heglig. People are mistreated, not employed, suspected of being a security risk. Our people are not safe there. Our orders are not respected.
I told them I would be happy for the companies to be there, but not this way. This is how Chevron was closed: they provided no local services. Everything was provided [by Chevron] to Muglad [in Kordofan]. Chevron even moved its headquarters to Rubkona [just north of Bentiu] early in the 1980s.[1175]
Taban Deng identified those who had cleared the area to provide a cordon sanitaire for the oil operations as security agents, noting that ""it was the behavior of the security clearing the area to provide security for the oil fields. Some [residents] were chased with guns. Some ran for their lives."[1176] Taban Deng gave this testimony to Human Rights Watch five months after the meetings with Talisman and more than a year before he defected from the government.
In July 1999, Human Rights Watch asked Ralph Capeling, a Talisman vice president and then the highest-ranking Talisman employee in Khartoum, also general manager for the GNPOC pipeline division, if he had heard reports of displacement from the GNPOC oil concession. He said he had but that he had not investigated them due to the frenetic pace of work that Talisman was maintaining in order to meet pipeline and production deadlines.[1177] Hence, at several levels, Talisman heard accounts of displacement but looked into them only superficially, at best.
The Campaign Against Talisman
Canadian Government Promises Action on Talisman, March-April 1999
The Canadian government had been lobbied to bring pressure on Arakis, and the lobbying stepped up when Talisman took over Arakis in late 1998. The government began to express concern to Talisman about the link between the oil exploration, the war, and human rights abuses in Sudan.
Addressing a conference on religious persecution in March 1999, Canadian Minister of Foreign Affairs Lloyd Axworthy said that he had met with oil executives about the worsening situation in Sudan: "We've been engaged recently in what role we play in Sudan, partly because I think there is a responsibility of Canada because of the activities of some of our private-sector companies." Minister Axworthy told the gathering that when Talisman officially said it did not feel it was its place to interfere with the actions of the Sudanese government, he had reminded the Talisman officers of voluntary codes of conduct, including one developed by the Canadian government, which set out standards for operating overseas. The Canadian government's priority was a settlement to the war.[1178]
At that same March conference, Canadian Senator Lois Wilson, former president of the World Council of Churches, said that if no progress was made in Sudan peace negotiations by April 15, 1999, Canada should consider putting pressure on Talisman to refuse to turn on the flow of oil.[1179]
In April 1999, Minister Axworthy announced that he had discussed with Talisman the idea of Talisman participation in efforts to make peace in Sudan. He characterized the proposal as part of a larger peace initiative that Canada, Norway, and Kenya were undertaking on Sudan.[1180]
The governmentwas also subject, however, to pressure from the growing Canadian petroleum industry, based in western Canada. One financial journalist noted that Canadian independent oil producers had "become players in big oil's international big leagues." Based on market capitalization, "seven out of the world's 15 largest exploration and production companies, including Talisman, are now Canadian." This was in contrast to ten years before, when U.S. multinationals had dominated Canada's oil industry.[1181]
Talisman Annual Meeting May 1999
In early 1999, eleven Canadian NGOs attempted to submit a proposal for a shareholder resolution at the Talisman annual meeting. The proposed resolution asked the board of directors to assure shareholders that the company's operations in Sudan would not materially aid the capacity of the Sudanese government to engage in the civil war in that country, nor to violate internationally accepted standards of human rights. "As shareholders we believe that the company must assure us that the oil operations in which we have a financial interest are not in any way serving to fuel the war and thus to perpetuate the suffering of the Sudanese people," one activist said. Talisman refused to include the proposal in its management proxy circular.[1182]
In a March 10, 1999 letter to Talisman shareholders, after refusing to include the shareholder proposal in the proxy circular, but recognizing that the Canadian NGOs and others had raised troubling questions about human rights abuses by the Sudanese government, CEO Buckee said,
Because Sudan presents significant challenges, we realized that this project would attract questions from varied sources. However, careful study last summer [1998] persuaded management that this is a sound business investment and our involvement could be carried out in a responsible, ethical manner. Experience to date confirms that judgment.
We recognize that Sudan's chronic troubles, including poverty and conflict running along political and tribal "fault lines", create special challenges. Like many other international companies who operate in similar environments, Talisman is taking the necessary steps to ensure the safety of our employees . . . . [1183]
Apparently Talisman thought that its ethical obligations reached no further than ensuring the safety of its employees. Nothing was mentioned about the rights of those living in the area where the oil was found.
Buckee had previously stated that "The only way to break the logjam [in Sudan] is through development. . . Talisman's presence there can only be for the good."[1184] But he offered no study or research of oil development in other third world countries establishing that oil investment had led to development and greater democracy.
Indeed, a World Bank study concludes that oil development conducted by unrepresentative or repressive governments does not lead to democracy, but actually hurts and impedes democratic development.[1185] Oil development also has tended to retard peace, and in some cases is a casus belli for insurgents. That is certainly the case in Sudan. In two other countries in Africa that have large petroleum reserves, Nigeria and Angola, the oil wealth has neither been used to improve conditions for the poor, nor has it contributed to progress towards democratic government.[1186]
At almost the same time as the Talisman annual meeting in Calgary, Canada, the Sudanese government was conducting an all-out assault on the civilian population it wanted to clear off the Talisman (GNPOC) concession, according to later articles in the Canadian press, food and security monitors, and human rights investigators. Between May 9 and 23, 1999, the government army launched an offensive on Dinka villages from the garrison in Pariang, moving to Tagil and then Gumriak (Block 1). From there it went to Padit and Biem (northern Block 5A) and elsewhere in Ruweng County, apparently with the main intention of driving the villagers off their land, according to civilian survivors. The Sudanese government used Antonov bombers and helicopter gunships-which may have taken off from the GNPOC airstrip at Heglig-followed by soldiers in tanks and armored personnel carriers backed by militia from garrisons at Liri in the Nuba Mountains and Pariang.[1187]
All this displacement and destruction occurred in Block 1 of the GNPOC (Talisman) concession while Talisman was active in the concession, and while its CEO was brushing off reports of human rights abuse and reassuring shareholders that there was no fighting and that Talisman was continually monitoring the situation. After the shareholder meeting in early May 1999, CEO Buckee wrote another letter to shareholders on Sudan, dated May 27, 1999. Without mentioning the May 9-23, 1999 government assault/displacement, he stated that:
the oilfield development is at some distance from the areas of intermittent fighting, and . . . the government is deeply committed to completion of the project and uninterrupted operations of the fields. Nonetheless, we monitor the situation continually, take prudent security measures and have contingency plans in place to cope with emergencies. . . .
We also see headlines and reporting of 'facts' that can be misleading. Neither normal media activity nor comprehensive foreign government representation exists in the country.[1188]
The implication was that Talisman could ignore press investigations of human rights abuses in Sudan, because "normal media activity" did not exist in Sudan. But Canadian journalists among many others located and interviewed displaced persons within the GNPOC concession and those who fled the area.[1189] Talisman was on notice, through the press, U.N., NGOs, and many other sources, of extensive human rights abuses and displacement in its concession and elsewhere. The burden was on Talisman, as a matter of corporate responsibility, to investigate these charges in a manner designed to establish, not dismiss or hide, the truth.
Talisman went forward with the Sudan project, announcing that the first flow of oil through the pipeline to Port Sudan took place on June 23, 1999.[1190] Company officials projected that production was expected to start in late 1999 at a rate of 150,000 barrels a day (b/d).[1191]
The first crude oil was exported from Sudan, amid government celebrations, on August 30, 1999. Two weeks later, in the north, the pipeline was sabotaged by northern-based rebels.
U.N. Expert Criticizes Oilfield Human Rights Abuses, October 1999
The report of U.N. Special Rapporteur for Human Rights in Sudan Dr. Leonardo Franco to the General Assembly on October 14, 1999, noted that the May 1999 government assault on Ruweng County had caused many persons to become internally displaced. He reported that the offensive lasted ten days.[1192] Jim Buckee, CEO of Talisman, denounced this report as "hearsay," claiming that at least two of the facts were "wrong," and promising an additional contribution to the rapporteur within two weeks.[1193]
Talisman never presented any evidence to counter Special Rapporteur Franco's statements and in fact later endorsed the recommendations of an Amnesty International May 2000 report on oil and human rights in Sudan.[1194] That report condemned forced displacement, mentioning the same raid detailed by Special Rapporteur Leonardo Franco.[1195]
Still, when asked, Talisman CEO Buckee continued to dispute the reports that government forces had attacked the area, attributing the bloodshed and displacement to local factional infighting from which the government had remained aloof. By his account, these were "two minor incidents," that resulted from strife between factions protecting turf, while the Sudanese government kept its troops away.[1196] But that was not what relief workers and journalists found, nor what victims of the offensive told visitors.
To complicate matters, the GNPOC concession was hit on October 15, 1999, by a coordinated rebel attack on Mobile Rig 15 by a disaffected Nuer commander, Peter Gatdet. He had been part of the government militia protecting the oil concessions from early 1999 until early September 1999, when he switched sides and took many men and weapons with him. Two Sudanese workers were killed and one injured in the night-time attack when rebels opened fire on the rig, which was, as were all oil implacements, guarded by Sudanese army troops. Army reinforcements ran over a land mine in the road, killing three more. Talisman made no announcement of this attack, although it acknowledged the attack to Human Rights Watch and others.[1197]
Canadian Government Issues Policy Statement on Sudan, October 1999; Talisman Signs Code of Conduct, December 1999
On October 26, 1999, the Canadian government set forth its Sudan policy in writing at a press conference held by Foreign Affairs Minister Lloyd Axworthy and Minister for International Cooperation Maria Minna, hinting at the possibility of Canadian sanctions against Talisman. Minister Axworthy first said:
Canadians want assurances that the operations of Canadian enterprises are not worsening the conflict or the human rights situation for the Sudanese people. I intend to discuss with [Talisman Energy] ways in which it could support a peaceful resolution of the conflict.[1198]
At the same time, the government issued a background paper entitled "Canada's Sudan Policy." It noted that the ownership of the oil was in dispute in the war, and that oil exploitation therefore might contribute to the civil conflict. "The question of allocation and distribution of oil resources and their benefits must be resolved quickly as oil is now being exported and revenue generated," the Canadian government paper stated. It presented its attitude toward Canadian companies operating in Sudan:
Canada is committed to ensuring that private sector involvement in Sudan does not prolong the conflict in Sudan or fuel related human rights abuses. The private sector has an ethical responsibility to ensure their operations do no harm, but rather contribute to fostering a climate conducive to building a durable and just peace. Canada is therefore seeking assurances from both the Government of Sudan and Canadian oil sector interests (including Talisman Energy) that both international humanitarian and human rights laws are being upheld, and that oil extraction and export is not exacerbating the conflict in Sudan.[1199]
The foreign minister announced the appointment of two persons to monitor the situation in Sudan for the Canadian government. Senator Lois Wilson was to be Canada's special envoy to the Sudan peace process and the Intergovernmental Authority on Development (IGAD). John Harker, a Canadian specialist in African issues and advisor to the government of Canada, was to lead a fact-finding mission to Sudan to examine human rights allegations.
Minister Axworthy also introduced other initiatives regarding Sudan: an invitation to the leaders of Sudan's warring factions for talks in Canada to help end the conflict (which was declined and never took place); an offer of Canadian $ 300,000 to shore up the bureaucracy of the IGAD peace forum; and a meeting with Talisman within the week to discuss the firm's responsibilities with regard to promoting peace, human rights, relief and development in Sudan.[1200] As items for discussion, the government of Canada set forth five demands to the company:
i)effectively implement the "International Code of Ethics for Canadian Business;"[1201]
ii)publicly encourage Sudan to invite independent experts to investigate the human rights situation in the oil areas in Sudan, focusing on forced displacement allegations;
iii)initiate discussion with the government of Sudan and independent experts on verifiable ways in which oil export earnings can be reserved for humanitarian and development purposes and shared equitably by all regions of Sudan;
iv)publicly urge Sudan to recommit itself to the IGAD Declaration of Principles (DOP)[1202]; and
v)invite independent expert observers to participate in Talisman discussions with the Sudan government on the peace process and human rights.[1203]
"If it becomes evident that oil extraction is exacerbating the conflict in Sudan, or resulting in violations of human rights or humanitarian law," Minister Axworthy warned, the government of Canada "may consider, if required, economic and trade restrictions" such as were authorized by the Export and Import Controls Act (EICA), the Special Economic Measures Act (SEMA), or other instruments.[1204] The Canadian government had already enacted arms sanctions on Sudan in 1992.
Talisman's shares lost 11 percent on the Toronto stock exchange in the two days after Minister Axworthy mentioned the possibility of sanctions, to Canadian $ 38.60.[1205] The company's share price continued to drop.[1206]
Analysts said that Talisman shares lost more than 20 percent of their value after the rebel attack on the pipeline in mid-September 1999, although not all of the slump could be attributed to concern over Sudan, or the "Sudan overhang," as the stock analysts termed it. Some emphasized that the Sudanese operations comprised only about 10 percent of Talisman's asset base, by production and investment.[1207] One financial commentator observed:
Whatever the ethics of the situation, Talisman has clearly misjudged the potential impact of activist power and the perception of political risks. These have knocked perhaps as much as a billion dollars off Talisman's market capitalization, possibly far more than the Sudanese investment is worth.[1208]
Canadian Foreign Minister Axworthy met with CEO Buckee on November 3, 1999, regarding Sudan. He again asked Talisman to sign the International Code of Ethics for Canadian Business. After months of urging by the Canadian government, Talisman finally signed the Code in December 1999, after the government human rights investigatory team led by John Harker had arrived in Sudan. The Code committed the company tothe "value" of "human rights and social justice" and to "support and respect the protection of international human rights within our sphere of influence" and to "not be complicit in human rights abuses."[1209]
Southern Politicians in Khartoum Denounce Oil Companies, November 1999
Southern opposition politicians based in Khartoum were following international developments and issued a statement in response to the announcement that a Canadian fact-finding team would investigate human rights abuses in Sudan. On November 3, 1999, the Union of Sudan African Parties (USAP), a registered party, denounced the role of oil companies in the south and called on the Sudanese government to suspend immediately all oil operations there and to concentrate on the resolution of the causes of the conflict and the realization of a just and lasting peace in Sudan.[1210] The statement's significance was in part due to the fact that it came from a political party representing southerners living in the north, operating within the system.[1211]
USAP did not denounce the government, but focused all blame on the oil companies, mentioning Talisman by name for hiring agents in Europe, North America, and elsewhere to launch "foolish propaganda that claims that [the] people of Southern Sudan are incapable of appreciating the economic advantages which petroleum exploitation in Southern Sudan will offer to them." It accused Talisman of knowing "very well" that what the Dinka and Nuer are currently experiencing in their "invaded land" is:
brutal death, wanton destruction of their homes and huge unprecedented displacement of whole families and clans. Their ancestral land has instead become a theatre of war, fueled with inputs from oil interests in Canada, China, Malaysia and some European countries.[1212]
The statement charged, "Nothing in the Unity State, not even life of a citizen, is too precious to spare, if the oil companies believe it constitutes an obstacle or threat to their interest."[1213]
Talisman Takes Oil Analysts on Company Tour of Sudan, November 1999
Talisman swung into a public relations campaign. It responded to the Canadian foreign minister's announcement that the government was sending a fact-finding delegation to Sudan by quickly organizing a public relations tour of its project for Canadian and U.S. oil industry analysts, who were less human rights-oriented, more likely to be sympathetic to the industry perspective, and perhaps less likely to know anything about Sudan or Africa.
The analysts and journalists apparently were presented with a misleading version of life at Talisman's operations center at Heglig. The military Antonovs and helicopters-that the Sudanese army had been using for bombing runs in the south-were moved away from the Heglig corporate airstrip prior to the trip and relocated to another base not on the foreigners' itinerary, according to the report later written by the Canadian government human rights delegation.[1214]
Flying over the Heglig oil facilities, CEO Buckee pointed out to the financial analysts and press what he said was "proof" of the absence of forced eviction: the tracks of seismic tests made some twenty-five years ago by Chevron.[1215] He asserted that if villages had been forcibly evacuated to make room for oil development, there would be signs similar to these tracks.[1216]
Burned-out villages would be visible from the plane, however, only if the plane were flying near them. Heglig is in Block 2, in the northern part of the oil area. The more recent evictions and village destructions took place further to the south; the burned out villages in the Gumriak area are perhaps seventy-five miles from Heglig base camp.
As one journalist wrote:
During the four-day visit, the analysts saw no evidence of conflict. . . . [A]t Heglig, the site of one of Talisman's major oilfields and processing facilities, there is no evidence of population displacement. Military presence is low key. Children are playing and going to school near the oil wells.[1217]
Journalists were shown a new school and a small hospital. According to schoolteacher Mahmoud Hassan, "The nomads can use the schools, markets and the hospital."[1218] But the previous residents were Nuer and Dinka, not the Baggara who are referred to as "nomads."[1219]
When CEO Buckee wrote his November 23, 1999, letter to Talisman shareholders shortly after taking journalists on this visit to Sudan, he referred to and elaborated on their reports as corroboration of his statement that there was no forced displacement in the oilfields:
We recently visited the area with a large contingent of Canadian and US analysts, representing large reputable banks and brokerage houses, as well as several journalists. They also note the lack of any permanent habitation of the vast, empty plains. Seismic lines cut by Chevron over 20 years ago are still clearly visible, as the "footprint" of villages would be, had there been any. . . .[1220]
The plight of the displaced was in vivid contrast to the conditions the oil workers in Western Upper Nile/Unity State enjoyed. As one Nairobi-based journalist traveling with the financial press group observed:
All are vulnerable to hunger, but unlike the oil companies-which operate daily charter flights to transport staff and supplies-WFP has been unable to reach the needy due to a government ban on aid flights to most of Unity State.[1221]
Buckee wrote another letter to shareholders on November 27, 1999, after his return from escorting the financial press through the Talisman project in Sudan. The letter specifically referred to the allegations of forced displacement:
I would like to make it clear that Talisman is vehemently opposed to forced relocation for oil development and I personally believe such practices are abhorrent. In five years of operation, staff in the field have not seen any evidence of forced displacement or relocation in our area of operations, which is located on a flood plain with minimal permanent settlements, as it is largely underwater for several months each year. We have diligently investigated these allegations and have found them to have no basis in fact.[1222]
What was the "diligent investigation" that Talisman conducted before writing this November 1999 letter? Legal Counsel and Vice President Jackie Sheppard told Human Rights Watch in February 2000 that she visited Pariang, a government garrison town near Gumriak in Block 1, and asked a head chief if there was any displacement in the area. The chief said there was not. Ms. Sheppard did note that there were various government security officials present at the interview.[1223]
The Harker team was also curious about the investigation Talisman claimed to have carried out. While in Sudan, they discussed the investigation with the person assigned to carry it out, and reported:
It is our information that no formal report of the investigation exists, and from the investigator himself we now know that he has never been to Pariang, the center of the May 1999 actions and subsequent allegations, nor even to Bentiu, currently the center for the [Maj. Gen. Paulino] Matiep forces engaged in a struggle, certainly linked to oil, with the "SSDF" forces formerly linked to Riek Machar.[1224]
Talisman met with Human Rights Watch representatives on February 3, 2000, in Calgary. The meeting lasted several hours. Forced displacement was discussed, as was U.N. Special Rapporteur Franco's report (the Harker report had not yet been released). CEO Buckee presented several photographs of empty plains to "show" that when they arrived in the area, no people were living there. They were logically inadequate to establish the proposition that no one lived in the large concession or near any of the many GNPOC facilities in 1998. If anything, they might demonstrate that the government's forced removal program was successful.
Human Rights Watch pointed out to Talisman on maps the locations and progress of the fighting that produced tens of thousands of internally displaced persons noted by the U.N. for the years 1999 and previously. Human Rights Watch pointed out the areas from which people had been displaced and to which they fled. The Talisman officials claimed again to have no knowledge of the displacement.
The Harker Report
The Canadian government human rights delegation led by John Harker[1225] visited the north and the south of Sudan in December 1999 and received many testimonies. The human rights team found that oil development was exacerbating the conflict and that Talisman's presence was making things worse.
Upon the return of the Harker Canadian human rights team to Canada, and before the report came out, John Harker in January 2000 informed Foreign Minister Axworthy that the Sudanese military was using the GNPOC airstrip to wage war against rebel forces, apparently in violation of Sudan's pledge to refrain from using oil development as cover for military operations.
Talisman admitted the use and said it had protested strongly to the Khartoum government.[1226] The foreign minister of Canada sent a letter of protest in January 2000 to President Bashir, condemning this military use of oil facilities.[1227] The Sudanese government denied the team's finding, contradicting Talisman's own admissions.[1228]
The Harker report was released in February 2000. In a harsh and straightforward manner, it condemned Talisman and the government of Sudan:
We can only conclude that Sudan is a place of extraordinary suffering and continuing human rights violations, even though some forward progress can be recorded, and the oil operations in which a Canadian company is involved add more suffering.[1229]
The Harker report made several recommendations, including that:
·Canada and Talisman should put their influence behind efforts to have flight bans on relief operations removed;
·They should support and negotiate a ceasefire, monitored by the international community;
·Talisman should be very firm in advocating a ceasefire, and ready to pay a price for it, perhaps in the form of foregone revenues;
·Talisman should establish a trust fund acceptable to the southern parties for its revenues, with Canada assisting in forensic accounting and auditing for this trust;
·Canada should place Sudan on the Area Control List for selective trade restrictions in support of specific objectives, which would provide Canada with leverage over Talisman;
·Canada should seek detailed scheduled reports relating to Talisman's compliance with international human rights and humanitarian law, and what it knows of the Sudanese government's compliance;
·Talisman should seek independent help to develop and implement practical means of monitoring and reporting forced removals; and
·Talisman should continue discussions with Canadian NGOs regarding setting up a human rights monitoring mechanism.
The report cited two ways of neutralizing the negative impact of oil: either a halt in oil production until peace-which it considered unfeasible-or a set aside for government oil revenues for use when a peace is in place.[1230] "It is difficult to imagine a ceasefire while oil extraction continues, and almost impossible to do so if revenues keep flowing to the GNPOC partners and the government as currently arranged," the report stated.[1231]
The report urged Talisman to acknowledge the destructive impact of oil extraction, and work toward creating a trust fund. The trust fund idea faded as Sudanese churches in the north and south, which had first endorsed a trust fund, rejected the idea because they concluded that continued oil production would lead to continued abuses. Two months later, the Sudanese churches instead called on the oil companies to withdraw from Sudan.[1232]
The Canadian government deserves credit for designating a human rights team and commissioning a special report on human rights abuses connected with oil development and Canadian companies. It failed, however, to follow up on the damning findings of its own human rights report.
Canadian Government Announces Toothless Sudan Program, February 2000
Foreign Minister Lloyd Axworthy on February 14, 2000 announced that Canada would not impose sanctions on Talisman-at that time.[1233] Talisman's stock briefly rose.[1234]
Axworthy listed new measures that Canada would undertake, along with others already underway. But the Canadian government overlooked almost all the Harker report recommendations and was ready to take only conventional small steps:
·Financial support for the U.N. Commission on Human Rights special rapporteur on human rights in Sudan;
·Financial assistance to the Sudanese government's Committee on the Eradication of Abduction of Women and Children (CEAWC);
·Financial support for the IGAD process and its Declaration of Principles as the only viable means of achieving a just peace;[1235]
·Exertion of Canadian diplomacy for the Security Council to support IGAD;
·Strong encouragement for Talisman to continue its efforts to develop, with NGOs, an effective mechanism for monitoring its operations in Sudan, to ensure that they did not lead to an increase in tensions, or otherwise contribute to the ongoing conflict;[1236]
·Support for Canadian NGO monitoring of human rights in Sudan; and
·Opening of a Canadian consular office (but not an embassy) in Khartoum for three purposes: to make a more effective contribution to the peace process, to promote respect for human rights, and to offer consular services to Canadians.[1237]
This list of Canadian initiatives overlooked several Harker report recommendations:
·It did not mention any effort to have government bans on relief flights removed, although most of Blocks 1, 2, and 4 were and are subjected to flight bans by Khartoum.
·It did not address the ceasefire option, except indirectly by reference to the peace talks through IGAD.
·It did not attempt a step-by-step approach-whereby the foreign minister could publicly express grave concern about Sudan and receive the mounting evidence that Canadian oil extraction activity was exacerbating the crisis, to be followed by stiffer measures.
·There would be no scrutiny of exports to Sudan, nor would Sudan be placed on the Area Control List, an item that was considered only a token gesture in any event because the supplies needed could be obtained elsewhere.
As soon as the Canadian government announced it was not imposing sanctions, Talisman negotiations with Canadian NGOs ended. These were negotiations to develop monitoring mechanisms to assure Talisman operations did not lead to an increase in abuses, or otherwise contribute to the ongoing conflict. Talisman insisted that the NGOs had proposed unworkable mechanisms, such as having an NGO representative attend Talisman human rights discussions with the government. It said the NGOs were to blame for ending the negotiations. The NGOs said the negotiations ended because Talisman was not serious and "had refused to recognize evidence that Talisman's operations in Sudan were linked to human rights abuses."[1238]
U.S. Criticizes Canada
In February 2000, almost immediately after Canada's no-sanctions announcement, the U.S. Treasury announced that it was imposing sanctions on GNPOC and Sudapet, adding them to the list of entities owned or controlled by the government of Sudan with which U.S. persons were forbidden to do business.[1239]
The U.S. State Department said, "We certainly have concerns about the way in which this Canadian and other companies have essentially provided a new source of hard currency to a regime that has been responsible for massive human rights abuses in Sudan."[1240] It had earlier criticized the Canadian government for not imposing sanctions on Talisman. The Canadian government respondedthat it made its own policy "in Canada based on Canadian values and Canadian judgment as to the most effective way to support the peace process in Sudan."[1241] Foreign Minister Axworthy alluded to Canadian opposition, in principle, to unilateral sanctions such as the U.S. imposed on Cuba, which affected Canadian businesses.[1242]
Canadian Initiative at U.N. Security Council Blocked, April 2000
The Canadian government, as president of the U.N. Security Council for the month of April 2000, sought to put the Sudanese war on the Security Council agenda, and garner the "highest level multilateral support for the ongoing efforts" of IGAD, as Axworthy had announced in February 2000. Canada sought an informal consultation of the Security Council on the Sudan peace process, followed by a press statement expressing the Council's backing for regional mediation efforts.[1243] Canada dropped its plans, however, after closed-door consultations with the Arab League and the Organization for African Unity (OAU), which in the language of diplomacy suggested that Security Council engagement on this issue "at this time" would not be "productive."[1244]
China's ability, as a permanent Security Council member, to shame the U.S. into blocking any Security Council consideration of Sudan posed one of the real impediments to action. The Chinese did this by threatening to put the issue of the August 1998 U.S. bombing of the Al Shifa pharmaceutical plant in Khartoum on the agenda whenever Sudan came up. The U.S. government, intent on avoiding this potentially embarrassing sideshow, had little stomach for a Security Council investigation of that missile strike, and urged its ally, Canada, to refrain from putting Sudan on the Security Council agenda.[1245]
TALISMAN "HUMAN RIGHTS" AND DEVELOPMENT EFFORTS, 2000-2002
Although the Canadian government had not imposed sanctions on it, Talisman responded to the pressure it was facing by appearing to change course. Instead of continuing an exchange of sound bites with activists, Talisman created an internal corporate responsibility department and took CEO Buckee off the front line. It made efforts to look as if it was taking its duties seriously and endorsing human rights language if not actions. Nevertheless, it repeatedly denied that there were abuses and, initially at least, denied that it had any responsibility in the human rights area at all.
Even though only 10 to 15 percent of Talisman's overall operations were in Sudan,[1246] Talisman's stock was discounted because of the controversy surrounding the Sudan operations. The Globe and Mail reported from Toronto on June 26, 2000, that oil analysts as a group felt that the Sudan discount in Talisman's share price was in the range of Canadian $15 to $ 25, an effect serious enough to make the company a candidate for a hostile takeover.[1247] Talisman had a real financial motivation to make the image of its Sudan project acceptable to the market and to public opinion.
Talisman Annual Meeting, May 2000
Talisman held its annual meeting on May 3, 2000. According to the press, CEO Jim Buckee faced a "barrage of accusations" that the Sudan project was fueling the civil war in that country. People lined up at the microphones to protest, and the meeting lasted more than three hours.[1248]
At that meeting, unlike the one in 1999, a shareholder initiative was permitted on the ballot. The shareholder proposal sought an independent audited report on Talisman's compliance with the International Code of Ethics for Canadian Business to be completed within 180 days. An alternative resolution sponsored by the company's management passed instead. It committed the company to conduct an in-house, but independently audited, report on its compliance with the Code, to be completed in one year.[1249]
An Amnesty International report on oil and human rights in Sudan was issued in May 2000,criticizing mass displacement from the oilfieldsby the government.[1250] It helped fuel the discussion and protests at the annual meeting.[1251] Among other things, Amnesty International recommended that Talisman "raise with the Government of Sudan the conditions for the return of civilians forcibly displaced from their homes in Western Upper Nile and Unity States."[1252] The report also found significant government efforts to force citizens off the land:
Tens of thousands of people have been terrorized into leaving their homes in Western Upper Nile since early 1999. Government forces have used ground attacks, helicopter gunship and indiscriminate high-altitude bombardment to clear the local population from oil-rich areas.[1253]
In July 2000 Talisman endorsed Amnesty's recommendations to Talisman and said that it agreed to raise the displacement issue with the Sudanese government. Any activities along this line-unless they were included in a vague statement that the company had advocated the "protection of civilians in conflict zones"-were however omitted from a letter from Talisman to Human Rights Watch of September 2000.[1254] And Amnesty International, in a follow-up press release in May 2001, a year after its report, said that Talisman had failed to live up to its commitments.[1255]
Talisman Meets the Sudan Government; GNPOC Signs Code of Ethics, December 2000
With regard to the Khartoum government, Talisman said in correspondence with Human Rights Watch that CEO Jim Buckee and Legal Officer and Vice President Jackie Sheppard met with Sudan's foreign minister and the minister of the interior in May 2000. During these meetings, the Talisman officials said, they advocated respect for human rights and the protection of civilians in conflict zones. Beforehand, CEO Buckee had met with Franklin Graham of Samaritan's Purse, whose hospital in southern Sudan had been bombed at least four times in March 2000. Graham asked Buckee to advocate the cessation of the bombing of civilian targets. CEO Buckee said he "personally raised this issue directly with each of the Ministers."[1256] However, according to charts conservatively compiled of bombing of civilian targets in the south, the government's heavy bombing of civilian structures continued after this interview.[1257]
In the face of continuing pressure, Talisman began to argue that its influence was limited because it owned only 25 percent of GNPOC-despite the fact that it was effectively lead partner and in charge of operations on the ground.[1258] Talisman pleaded that it could only push human rights so far with the consortium, as Petronas (30 percent) and CNPC (40 percent) could outvote it.[1259]
Talisman pointed to a number of initiatives it had undertaken to sensitize GNPOC and its partners, Sudapet, CNPC, and Petronas, to human rights. Talisman claimed to be the first Canadian resource company to embrace the concept of establishing a comprehensive management program and system to ensure compliance with the International Code of Ethics for Canadian Business. "Only companies such as Shell and BP have approached these issues as comprehensively," the Talisman letter stated.[1260]
Also during their trip to Khartoum in May 2000, Buckee and Sheppard met with senior ministry of energy officials reportedly to advocate the adoption by GNPOC of a code of conduct and to emphasize the need for respect for human rights in Sudan. They also reported that they met the president of CNPC in Beijing and the president of Petronas in Kuala Lumpur, Malaysia, to advocate the same things.[1261]
Talisman said that two of its officers were asked to participate in a retreat held in June 2000 by Petronas executives in the Malaysian capital of Kuala Lumpur to discuss ethical code of conduct issues at an internal Petronas meeting, which Talisman believed was sparked in part by its advocacy efforts regarding the GNPOC code.[1262] But up to the writing of this report, Petronas has still not adopted any code of conduct.[1263]
In December 2000 GNPOC adopted a Code of Ethics,[1264] but this code was even more limited than the Canadian code adopted by Talisman. It mentioned human rights once, in the context of a commitment to: "Conducting business in a way that shall maintain social justice and respect human rights within the sphere of our responsibility and contractual obligations."[1265] What this responsibility and contractual obligations might be were left completely undefined.
Importantly, the code stated that GNPOC would observe the principle of "[r]efraining from availing the company resources for political, tribal and armed conflicts."[1266] Yet the code bound only GNPOC, and did not keep Petronas, CNPC, or Sudapet from engaging in whatever conduct they wanted, as individual companies.
The Talisman Corporate Social Responsibility Report for 2001 said that a certificate of compliance was developed in 2001 to monitor GNPOC business activities and test conformance with the code. The certificate of compliance was adopted in January 2002.[1267]
Talisman Human Rights Monitoring
Talisman solicited the response of some human rights organizations to its proposals to improve its response to human rights issues, but it did not attempt to bring back into the picture the four Canadian NGOs with whom it had been in negotiation prior to February 14, 2000, about the creation of an independent monitoring organization.
In Talisman's proposed community development budget for 2001, dated September 2000, the program listed only two items under human rights, which totalled Canadian $ 37,050 (or 4.84 percent of the total of "funds approved"). First were funds for one Talisman staff member and four GNPOC officials to attend a ten-day training program in Nova Scotia, Canada, at the Lester B. Pearson Peacekeeping Centre (Canadian $ 15,000) in August 2000.[1268]
The second expense item was "development of a database to track and report on Conflict Resolution activities and agencies related to the Sudan conflict," under an agreement signed in October 2000 with the Sudanese government's agency for the internally displaced, Humanitarian Aid Coordination (HAC) (Canadian $ 22,050).[1269] Some Sudanese and others were concerned that, depending on who is in charge of the database, it could be misused for military purposes.
Corporate Social Responsibility Report 2000, Sudan (April 2001)
Talisman issued its Corporate Social Responsibility Report 2000, Sudan Operations (CSRR 2000), in April 2001. Talisman also commissioned satellite photos of selected locations inside the GNPOC concession, and an expert analysis of them which was released in April 2001 and shown at the annual meeting on May 1, 2001 (see below). An audit of certain statements in this CSRR 2000 was done by PricewaterhouseCoopers, London.[1270]
In this report, Talisman presented the results of some aspects of its in-house human rights monitoring program. The program had a field coordinator who oversaw the program "in conjunction with security staff."[1271] It was not clear if the security staff referred to government internal security, GNPOC security, Talisman security, or all three. Regardless, it was not likely that the presence of any such overseers would encourage any victim of government abuses to report those abuses to the Talisman human rights monitoring program.
The 2000 corporate responsibility report described investigations of only seven cases. Predictably, they concerned employment disputes: allegations of physical violence against workers, verbal abuse, dismissal from work, etc. One case was closed by the end of 2000. Ten additional cases had been opened in November 2000 "to keep files of initial interviews with people who have been displaced." These were not individual human rights cases, that is, interviews with individuals willing to make a claim of violation of human rights. They were information-gathering cases designed to "help [Talisman] build our understanding of human rights issues related to the GNPOC operational area."[1272]
Compensation Payments (Pipeline Only)
The Corporate Social Responsibility Report 2000 indicated that Talisman paid compensation to some populations displaced by its operations. However, it is not clear if compensation payments were made only to those living along the GNPOC pipeline in the north, or if they included those displaced within the south of Sudan.[1273] The government set up a Pipeline Compensation Committee to make assessments and payments to those living along the pipeline whose land use was affected. GNPOC was funding the Pipeline Compensation Committee to the tune of U.S. $ 1,841,946 and estimated total compensation would be paid in the range of up to U.S. $ 2,500,000.[1274]
The Talisman corporate responsibility report for 2000 highlighted that the village of El Munawara, located about 200 kilometers south of Khartoum, i.e., well within the north, was moved about two kilometers from its prevous location "to provide a safe distance between the villagers and the oil operations." Each of the 159 families in the village was compensated in cash, ranging from U.S. $ 290 to $ 870. Under review were compensation claims from others who grazed their animals around Pump Station #3, facilitated by representatives from the Sudan Ministry of Energy and Mining.[1275]
In the south, by contrast, no compensation was paid, even though tens of thousands were displaced (some quite recently, as in the Gumriak area of Block 1). No compensation committee was ever set up for those in Blocks 1, 2, and 4 whose land use was affected. The government took what it wanted by military force, without compensation. Talisman wrote to Human Rights Watch on September 13, 2000 that:
In Sudan, since Talisman has been involved in the project, our management is unaware of any instances of civilian displacement occurring without compensation. In fact, it is Talisman's understanding that when drilling occurred at an exploratory well location known as "Timsah", consent was obtained from the farmers in the area and compensation was provided to them (for the removal of trees and damage to planted [sorghum or durra]). Compensation has also been paid to farmers whose crops were damaged by seismic survey activities.[1276]
The suggestion that Talisman management was unaware of any instances of uncompensated displacement is disingenuous in light of the extensive evidence already publicly available at that time concerning forced displacement from the GNPOC concession during Talisman's tenure. Talisman also offered no details of or evidence for its assertion that compensation had been paid in the cases it mentioned.
Development Initiatives and Relief Donations
Talisman also engaged in various development initiatives in Sudan, for which it hired three full-time employees. Talisman distributed a draft community development policy, which identified four primary focus areas (water, health, learning, and capacity building), to NGOs operating in Sudan and some Sudanese in Canada for input and advice.[1277] Many NGOs, however, told Human Rights Watch that they would not be comfortable collaborating with Talisman because it would make them appear non-neutral, given that Talisman was a business partner of the government, conducting its oil operations under military guard.[1278] Thus Talisman did not find any NGOs with which to cooperate.
Talisman nevertheless said it built five medical clinics in the concession area, of which two were fully staffed and operational (Pariang and Rubkona, both garrison towns) as of September 2000, although this was not independently confirmed. It drilled four high capacity water wells in Pariang, Rubkona, Dabbat, and Kummagon, and completed maintenance of twenty-eight water wells in communities along the pipeline between Khartoum and Heglig,[1279] mostly in the north.
However, local people pointed out to a visiting journalist that a school that Talisman had built was a shell. "There are no desks, no schoolbooks nor food for the students and no water." One local relief worker chastised the oil companies for taking a picture of a school and displaying it "over and over to show how good they are. . . . What use is a house if there aren't even any pens or paper." The clinic that Talisman built in Rubkona is located in the middle of the army's housing and far from the displaced camps, the local people complained to the journalist.[1280]
Talisman also supported or planned to support many activities outside its concession, mostly in the pipeline area but others far away from the pipeline. For instance, it was looking into supporting a women and small business development project in Khartoum among women originally from the village of Pariang; nomad desert agriculture and communuty development north of Khartoum; hafir water storage development and training for repair along the pipeline route in northern Sudan;[1281] and development of a hafir to supply fodder crops south of Babanoosa in Western Kordofan for the Baggara. The latter program, which was still in the "idea" stage-Talisman requested suggestions as to where this hafir should be located-was hoped to reduce Baggara need to travel south into Western Upper Nile/Unity State and thus reduce friction and conflict with southerners.
The community development document also listed other activities that would take place outside of the south, such as the funding for import of free medical instruments, equipment, supplies, and drugs to medical teaching facilities and the Red Crescent in Khartoum; a primary school outside Port Sudan; and a vocational training center in Rabak, across the White Nile from Kosti; and upgrading an existing vocational center in Wad Medani, both northern towns home to large numbers of internally displaced originally from Western Upper Nile/Unity State.[1282]
The total funds approved in the community development document were Canadian $ 742,564.43 (U.S. $ 503,437), of which 52.1 percent were for outside the south; removing the emergency funds for Bentiu and Rubkona from the budget (Canadian $ 150,000 or U.S. $ 101,696), the amount assigned outside the south was 63.7 percent. Inside the south, it was 36.3 percent, little more than one-third of the Talisman development funds.
Talisman provided supplies when the influx of internally displaced from the Blocks 5A and 4 oilfield fighting hit Bentiu and Rubkona in August 2000. Almost 59,000 internally displaced were registered by WFP at the time. Many arrived with their cattle, causing sanitation and health problems in the urban area. Talisman issued a press release saying that it had provided medical supplies, one hundred large tents, five hundred mosquito nets, and established a temporary clinic for 220 patients a day.[1283] Talisman stated that the NGO cooperation (that had for so long eluded it) was finally taking place. "We're working alongside the non-governmental agencies as part of a team," said Mark Reading, one of several Talisman workers involved in the effort.[1284] Several organizations, however, hastened to dissociate their relief activities in Bentiu from Talisman.[1285] Six NGOs operational in that government-held area of Western Upper Nile/Unity State[1286] issued a press release that stated:
In light of the controversial nature of oil development in Sudan, [we] would like to clearly state that in the provision of humanitarian assistance to the vulnerable populations in Unity State, there is no relationship between these NGOs and any of the companies involved in the oil industry in Sudan.
While we acknowledge that Talisman (GNPOC) is providing assistance towards the needs, we strongly object to Talisman Energy's allegations that they are working together as a team with the international humanitarian community. Talisman's public statements infer a relationship that does not exist in Unity State.[1287]
Talisman's document, "Community Development Strategy – 2001," updated its activities as of October 30, 2000, noting that under the category "emergency relief" it approved Canadian. $100,000 in funds for Bentiu and Mayom, mostly tents, tarplins, mosquito nets, medicine, and logistical support, in a project that was "on-going in cooperation with Peace Advisory Council" in Bentiu and with local authorities in Mayom, thus reinforcing the government's presence and activities in the area.[1288] Furthermore, the development program, according to the Talisman document, was "designed and managed in close cooperation with GNPOC Security" and the ministry of energy and mining of Sudan.[1289]
Talisman's charitable contributions to Sudan in 2000 amounted to only a fraction of one percent of Talisman's post-tax revenue.[1290] Talisman spent about $ 1 million in fifteen Sudanese community development projects in 2000.[1291]
Talisman planned to spend U.S. $ 2 million on community development in 2001, doubling the 2000 amount, and GNPOC would increase its 2000 community development contribution of U.S. $ 600,000 to $ 1.8 million in 2001.[1292] Actually, in 2001, Talisman spent only U.S. $ 819,541 (of which $ 190,687 was carried over from 2000) on its own projects, and U.S. $ 617,327 (estimated) on GNPOC community development projects, or a total of approximately U.S. $ 1,436,868 in all in 2001.[1293] This is equal to .09 percent of Talisman's 2001 post-tax revenue.[1294]
Talisman Condemned at Annual Meeting 2001
Despite Talisman's efforts, Canadian churches kept up the pressure on the company. A delegation of Canadian church leaders called for foreign oil companies to stop operating in Sudan until the civil war was ended. Rev. Bill Phipps, former moderator of the largest church in Canada, the United Church of Canada, led a week-long delegation from five churches on a trip to southern Sudan in April 2001 (visas to visit the government areas were refused), and criticized the Talisman corporate and social responsibility report issued in April 2001.
"We are outraged that a Canadian company is a major producer of oil located in southern Sudan, paying huge royalties" to the Khartoum government, the delegation's statement said.[1295] Talisman's first quarter earnings were very good, and the company issued its first shareholder dividend.[1296]
Critics of Talisman gathered at its annual meeting on May 1, 2001, in Calgary to demonstrate in favor of Talisman withdrawing from Sudan. Others lined up inside the meeting to ask questions about Sudan from the floor.[1297] Amnesty International called on Talisman to do more to safeguard human rights in Sudan, concluding that the corporate social responsibility report did "not adequately address the issue of the human rights impact of the company's operations in Sudan."[1298]
A Canadian group of nongovernmental organizations, the Sudan Inter-Agency Reference Group of Canada (SIARG), had commissioned a report on human rights abuses in the GNPOC concession. The two-person investigative team conducted field work in April 2001 and issued a short preliminary statement on their findings, that human rights abuses were continuing inside the concession,[1299] with an oral summary presented by one of the researchers on the report at the Talisman annual meeting on May 1, 2001. The report concluded that the Sudanese government was using Talisman/GNPOC airfields to launch offensive operations against rebels.[1300]
Talisman, when previously confronted with the Harker report (February 2000), had maintained that airstrip use was restricted to "defensive" activities.[1301] How that term was defined, and how Talisman could establish that aircraft were engaged in "defensive" or "offensive" activities after flying out of sight, was not explained.[1302]
Talisman admitted in its corporate responsibility report issued in April 2001 that "there were at least four instances of non-defensive usage of the Heglig airstrip in 2000. On these occasions helicopters or planes landed on the airstrip for reasons that we could not determine were related to oilfield security and their presence was considered non-defensive by Talisman."[1303]
Despite the protests at the annual meeting and fears of becoming a takeover target,[1304] CEO Jim Buckee, on a visit to Sudan in June 2001, said that Talisman would stay put in Sudan.[1305]
Canadian Government Response
David Kilgour, new Canadian secretary of state for Africa and Latin America, urged participants at a conference on corporate and social responsibility in Calgary in March 2001 to follow the example of his church and sell their shares in Talisman as a form of protest. He also endorsed the idea of federal legislation that would penalize Canadian companies which are complicit in human rights abuses overseas and lamented that Ottawa had not done more to require Talisman to leave Sudan.[1306] The statement was not followed up by any action.
John Manley, who had replaced Lloyd Axworthy as Canadian foreign minister in November 2000, responded to the SIARG report that GNPOC airstrips were being used by the Sudanese government by saying, "If airfields are being used for offensive action against civilians, then that would be a serious breach of the norms of human rights and something of which we would strongly disapprove."[1307] He pointed to a part of the report that said that Talisman had raised its concern with the Sudanese government that the airfields not be so used, "and Canada certainly shares that concern," he said.[1308] But Foreign Minister Manley, when confronted by a member of parliament, claimed he had "no evidence" to support allegations that the Talisman airfields were used offensively by the military-despite the SIARG report.[1309]
A few weeks later, Minister Manley sent Senator Lois Wilson to the region to stress Canada's support for the IGAD process to end the conflict in Sudan. In a joint statement with junior foreign minister David Kilgour, he said, "Without an end to the war there can be no sustainable progress in Sudan on important questions of human rights, development and good governance," and criticized both sides for persistent human rights violations. Manley also urged Canadian companies active in Sudan to be "transparent" in their activities, and said that he would continue to urge the Sudanese government to use revenues from foreign investment to promote peace.
Manley pointed out that Canada would provide Canadian $100,000 (U.S. $ 64,930) in financial support for the U.N. special rapporteur on human rights in Sudan, decided upon during Axworthy's tenure as foreign minister. He welcomed Talisman's designation of a field coordinator to monitor human rights in Talisman's area of operation. He had indicated earlier in May 2001 that the Canadian foreign ministry would not revisit the idea of imposing sanctions on Talisman.[1310]
The foreign minister was chastised by the ministers of religion. They pointed out that in the midst of the Sudanese government's "unspeakably cruel campaign to kill and displace civilians in the oil concessions . . . you call only for 'strategies for ensuring transparency.'" Noting that, "Clearly, oil development has become a major disincentive for peace," they concluded that:
Sudan's war is a terrible, long-festering wound on the conscience of humanity. Canada should strain every resource at its disposal to end it with the one 'sanction' the government in Khartoum would find persuasive-an end to oil revenues until there is an end to the war. The facts are already transparent enough.[1311]
A Canadian member of parliament (MP) in August 2001 disclosed that the Canada Pension Plan's Investment board of directors, appointed by the government, invested Canadian $ 57.3 million (U.S. $ 37.28 million) in Talisman. The MP, Maurice Vellacott, said that the Canadian government thus made all Canadians complicit in the gross human rights abuses in Sudan: "Now most Canadians have blood on their hands, thanks to the Finance Minister." He noted that the government did not include ethical guidelines for investing when it established the board in 1997, and urged the finance minister to see that the pension plan divested from Talisman swiftly.[1312]
The next foreign affairs minister, Bill Graham, and Senator Lois Wilson, still Canada's Special Envoy for Sudan, condemned the attack at Bieh on February 20, 2002, and urged the Sudanese government to end all attacks against civilians and civilian installations immediately.[1313]
Cynical Satellite Images, 2001
Talisman reportedly paid a large sum of money for satellite photographs and analysis purportedly "proving" that there had been no forced displacement from its concession-going back to 1965.[1314] These images were previewed for the press and then shown at its annual meeting on May 1, 2001. Later they were available in booklet form which Human Rights Watch received from Talisman and reviewed.
The Talisman satellite images were focused on seven locations in the GNPOC concession, some very small but including the two towns of Bentiu and Pariang (Block 1). The images, according to the commissioned analysis, tended to indicate that population in those seven places had grown, not diminished, thus proving that there had been no displacement-from the seven chosen areas. Taken on their own in the booklet as presented to the public, the images and the text are totally insufficient to demonstrate the conclusion that this "clearly refutes a number of highly exaggerated claims of widespread displacement from our concession area."[1315]
The images show an increase in population of the two towns. But patterns of migration do not usually take East African agro-pastoralists into urban areas such as Bentiu and Pariang, especially not to reside there. This population increase could prove rather that the classic counterinsurgency strategy of draining the sea, that is, pushing people from rural areas into urban areas where they can be more easily controlled, is being used in Western Upper Nile/Unity State-just as human rights groups have contended. It could also tend to prove that rural agro-pastoralists had been forced into towns because of drought, raiding, or other disasters in which they lost their animals and thus their means of self-sufficiency.
Aside from the oil/government centers where gross population counts have increased, the analysis did not look at adjoining areas of the Block 1 concession that are shown on earlier maps to have a high density of settlement. Instead, the other sites selected by Talisman for examination are small rectangles immediately surrounding active oilfields, areas that have not shown up on previous maps as population centers or even clusters.
Analyzing these limited seven images, it is not difficult therefore to come to the conclusion that "there is no evidence [in the satellite imagery] of appreciable human migration from any of the seven sites examined."[1316]
What these satellite photos show instead is that Talisman's presence in Sudan resulted not in an improved human rights climate but in a better public relations machine operating on behalf of the government.[1317] These satellite photos show that corporate oil partnership with Sudan, a government committing gross human rights abuses, resulted here in the oil company becoming a government publicist.[1318]
The best evidence of population displacement is the displaced themselves, and the agencies attempting to measure and meet their needs. Following the government's lead, Talisman consistently avoided knowing or finding out anything about their existence, or taking steps to protect them.
Talisman Annual Meeting, May 2002
Sudan continued to occupy the attention of shareholders and management at the 2002 annual meeting in Calgary. Talisman's role in Sudan was sharply criticized inside the meeting and by demonstrators outside.
Talisman issued its second corporate responsibility report, entitled Corporate Social Responsibility 2001 (CSRR 2001), in April 2002. It was expanded to include Talisman's operations in Colombia, but the main focus remained on Sudan. It contained the results of an audit of data and statements conducted by Pricewaterhouse Coopers, London.
In the Corporate Social Responsibility 2001, Talisman:
·Noted that the Sudanese government agreed to allow Talisman to make public the amount of revenue the government received from oil operations, a positive step in the direction of transparency;
·Acknowledged that the Sudanese government rejected a draft security agreement between it and GNPOC on the grounds that security was the prime responsibility and prerogative of governments;
·Acknowledged continued reports of oil-related displacement, stated that it dedicated "a significant amount of financial and human resources" to investigate these claims, but failed to disclose the results of any investigation apart from the satellite photo study (above);
·Noted that the Heglig and Unity airstrips were increasingly used by the Sudanese military, but failed to disclose (as was done in CSRR 2000) the number of times it used these airstrips for "offensive" purposes;
·Acknowledged that the Sudanese government had rejected Talisman's request that the government allow unrestricted and unfettered access to humanitarian organizations and human rights investigators within the GNPOC concession;
·Noted that the Talisman Internal Human Rights Monitoring and Incident Investigation Program had opened twenty-nine case files as of December 31, 2001, and closed fifteen of the cases as of January 2002. Ten cases involving people who returned to Pariang (implicitly from SPLA-held areas) reported on in 2001 had made little progress; and
Acknowledged eight separate "security incidents on oil infrastructure or personnel" in 2001, presumably rebel attacks. In one incident, six civilian members of a subcontractor's road construction crew were killed during an attack for which the SPLA claimed responsibility.
Talisman Pulls Out, October 2002
On October 30, 2002, Talisman announced that it had agreed to sell its Sudan assets to ONGC Videsh Limited, a subsidiary of Oil and Natural Gas Corporation Limited, India's national oil company.[1319] Talisman estimated that the aggregate amount it would realize from the transaction would be approximately U.S. $ 758 million (Canadian $ 1.2 billion), an after-tax return of approximately 30 percent. It expected the sale to be completed by December 31, 2002, subject to conditions, relating to obtaining consents from the government of Sudan and the other consortium members and to the waiver or expiry of rights of first refusal.
Commenting on the sale, and effectively confirming that the decision was made as a result of pressure from the human rights community, CEO Jim Buckee said:
Talisman's shares have continued to be discounted based on perceived political risk in-country and in North America to a degree that was unacceptable for 12% of our production. Shareholders have told me they were tired of continually having to monitor and analyze events relating to Sudan. We are encouraged by recent developments in Sudan, but had to weigh all possible outcomes against having a firm and fair offer, in hand, right now. Selling our interest in the project resolves uncertainty about the future of his asset.[1320]
Talisman stated that its development projects there would continue in the short term:
We have long argued that Talisman's presence in Sudan has been a force for good and we have taken steps to ensure that the benefits created through our involvement will continue to improve the lives of the people of Sudan both now and in the future. Talisman and its employees have made significant contributions to this end over these past four years, providing medical assistance, shelter, clean water, vocational training and initiating capacity-building programs. A program will be established to ensure continuity in funding of such Talisman development projects for the remainder of this year and through 2005.[1321]
The corporate responsibility policies and procedures implemented within the Greater Nile Petroleum Operating Company, the operator of the project, as a result of our advocacy efforts, such as the GNPOC Code of Ethics and human rights training, have influenced and, we hope, will continue to influence the operations of the consortium in the years to come. We also hope that the economic benefits of oil field development will play a constructive role in the Sudan peace process.[1322]
LUNDIN: WILLFULLY BLIND TO DEVASTATION IN BLOCK 5A
Lundin's Concession
Lundin Sudan Limited is the Swedish company which was the operator of the consortium granted the rights to develop Block 5A, largely located south of Bentiu in the swampy, marshy, and meandering flat landscape on the West Bank of the White Nile in Western Upper Nile/Unity State. Most of the inhabitants of Block 5A are Nuer, except for some Dinka in the northern and southwestern corners that are not presently the targets of oil development.
The consortium consisted of Lundin Petroleum AB (Sweden), OMV (Sudan)Exploration gmbH (Austria), Petronas Carigali SDN BHD (Malaysia), and Sudapet (Sudan): Lundin had 40.375 percent, OMV 26.125 percent, and Petronas 28.5 percent. Sudapet owns 5 percent.[1323] The concession was granted in 1996, operations on the ground started in late 1997, and within months fighting broke out in the key Nuer towns of the block, culminating in a May 1999 attack on the first well Lundin drilled. The attack was carried out by Riek Machar's SSDF forces, who executed three government employees there. Lundin evacuated the one hundred workers at the site the same day and did not recommence oil operations for eighteen months, until late 2000, after the government and its militia had attacked, burned out, and displaced many thousands of Nuer living there.
In March 2001, Lundin announced a "significant find" at the Ryer/Thar Jath location. In the same month, the NGO Christian Aid issued a report critical of Lundin for its role in Sudan. In January 2002, after one of its helicopters was shot down, Lundin again suspended operations on Block 5A. A major government operation, primarily against civilians along the oil road, began in early 2002, resulting in more massive displacement and civilian casualties. Operations on Block 5A were suspended for fourteen months, until April 2003, while the government pursued an offensive in Block 5A, in violation of the ceasefire agreement. Only a few months after the resumption of oil exploration activity, Lundin agreed to sell out its interest in Block 5A to its partner, Petronas.
Lundin Hides the Situation of Armed Conflict in Block 5A
Waves of massive displacement have been destroying life for the residents of Lundin's Block 5A concession since it started operations in late 1997-though developments in peace negotiations in late 2002 did provide some hope that the pattern might cease.[1324] The forcible displacement of Nuer agro-pastoralists from their homes, and from the Jagei area they believe is the place of origin of all Nuer,[1325] began once Block 5A's economic feasibility was created by the construction of the GNPOC pipeline to the Red Sea. As described above, the pipeline was designed with excess capacity so that it could carry the GNPOC oil as well as several hundred thousand more barrels of oil daily from Block 5A and other nearby blocks to the marine terminal.
The oil companies, led by Lundin, made no public statement condemning this destruction and displacement in Block 5A, despite the press attention it garnered and the regular alarms from U.N. agencies about the dire state of the needy in this very area.
Nor did the oil companies disclose that rebel attacks had closed down their activities in May 1999. As set forth above, Lundin's only exploratory well was attacked by rebel forces and the work force of approximately one hundred was evacuated the same day, by air, on May 2, 1999. The same day, as part of that attack, three government employees at the rig were shot point-blank by rebels; two died immediately and a third died of his wounds hours later; these killings were summary executions.[1326] Lundin's operations were suspended in May 1999 until late 2000 because of this attack on its operations and continued fighting, burning, and looting-with civilian casualties-between Nuer forces backed by the government, and later between Nuer forces backed by the government and by the SPLA.
Nor did the oil companies, led by Lundin, disclose the fighting that occurred up and down their block, Block 5A, during the months of June, July, and August 1999. Although their operations were suspended, they could not have failed to monitor the situation through the project security staff, because this was a valuable property where they expected to produce substantial quantities of quality oil.
The World Food Program noticed, however. It put out an alarmed press release on July 10, 1999, stating it feared "a worsening humanitarian crisis as it is unable to deliver urgent relief assistance to tens of thousands of people trapped by the fighting."[1327] It estimated that war between two rebel factions was blocking food delivery to 150,000 in rebel-held areas of Western Upper Nile/Unity State.[1328]
None of this fighting nor mass displacement caused the oil consortium, led by Lundin, to express concern about the well-being of the people living in its concession area.
Lundin never mentioned the armed conflict in its public releases.[1329] Instead, it announced in January 2000 that:
Sudan operations related to the re-entry of the Thar Jath well drilled in May 1999 have commenced. The testing of the Thar Jath well is scheduled to be completed by mid-February 2000 followed by at least one further exploration well.[1330]
Only a month later, however, Lundin Oil announced that it had "temporarily suspended testing operations on the Thar Jath #1 well on Block 5A . . . due to logistical considerations."[1331] According to the press release issued on February 20, 2000, "The access road running from the company's supply base at Rubkona to the rig site with an approximate length of 100 kilometres, is still under construction."[1332]
Still no word about the fighting and displacement. The press release added that Lundin expected to resume testing operations in approximately one month, "once all the necessary equipment has reached the well location."[1333] In its report for the year ended December 31, 1999 (issued on February 28, 2000), Lundin began to edge away from that estimate for early resumption of operations:
In Sudan the amount of work that can be carried out will very much depend upon the length of the dry season and our ability to overcome the logistical challenges. Sudan remains a tremendous opportunity for the Company and the Thar Jath discovery alone, which was drilled last year, could materially affect the Company's reserves profile.[1334]
In March 2000, Lundin announced that its activity on Block 5A remained suspended because of "logistical difficulties and safety considerations,"[1335] for the first time hinting at but not admitting the armed conflict in which Block 5A had been enmeshed since 1999 at least. In its report for the third quarter of 2000, issued on November 14, 2000, Lundin noted, "In Sudan the construction of the all-weather road on Block 5A is progressing well . . . ."[1336]
Lundin did not disclose that there were ambushes on convoys traveling on the road to its drilling site, nor ambushes on its road construction/improvement activities in 2000, and that there was extensive fighting again in Block 5A during the months of June, July, and August 2000, up to September 2000. There was a large swathe of burned territory stretching all the way from Nimne to Nhialdiu, south and east-west of Bentiu, by late July 2000. The vast area of burn and destruction was visible from any small plane-a relief plane flew over the area and commented on the destruction in late July 2000, which cut through the area of the oil road.[1337]
Thousands of displaced persons from this area of Block 5A fled into Bentiu for relief in the month of August 2000, generating relief agency alarms and press and coverage.[1338] Thousands more headed from Nhialdiu through Bul Nuer territory and into Bahr El Ghazal for relief. Still there was no oil company comment on this large-scale tragedy unfolding in its concession.
Lundin sent a letter to Human Rights Watch in September 2000, shortly after these events, answering Human Rights Watch's inquiry about allegations of civilian displacement and the May 1999 attack on the rig. In its reply Lundin stated:
Lundin Oil activities in Sudan are still at the exploratory stage; we have therefore a limited presence and impact there. It is therefore difficult for us to fully refute or confirm what you claim to be undisputed facts, even though we do not agree that oil is the cause of the conflict or that massive population displacement has taken place on Block 5A.[1339]
Lundin did not even admit that rebels attacked its rig in May 1999 and it suspended operations. Its operations were still suspended at the time of its letter. It did eventually admit its operations were suspended for eighteen months-but not until February 2001, when it published its 2000 annual report and had already recommenced operations.[1340]
Lundin was finally able to start its operations again in December 2000, and announced that it had commenced testing operations on the Thar Jath-1 well (which locals called Ryer) within a few days of the inauguration of the seventy-five kilometer all-weather road from the base camp at Rubkona to the drilling location. It expected the testing to last about four weeks.[1341]
On March 5, 2001, Lundin Oil put announced in a press release entitled, "Lundin Strikes Oil in Sudan," that its drilling at the Thar Jath-1 well (Ryer) resulted in "a significant oil discovery on Block 5A."[1342]
In its year-end 2000 report, Lundin retrospectively admitted, "operations on the Thar Jath well in Block 5A resumed in late December [2000] . . . . after an 18 month suspension . . . ."[1343] During the time of its "suspension" a seventy-five kilometer road was constructed which, together with a bridge over the Bahr El Ghazal River at Bentiu, would provide year round access into Block 5A[1344]-at the cost of the massive displacement described in this report. More than any other construction, the bridge spelled trouble for the residents and displaced persons south of the river. It opened up the area to "year round access" and attacks by Baggara horsemen and increasing numbers of army vehicles.
Lundin Denies Revelations about Forced Displacement in Block 5A, 2001
In mid-March 2001, Christian Aid, a London-based charity funding relief, education, health, and community-building activities in southern Sudan, issued a report, The Scorched Earth: Oil and war in Sudan.[1345] It reported, based on interviews with victims, that government troops and militias had burned and depopulated the entire length of Lundin's oil road in 2000 in order to make way for Lundin's operations.[1346]
Christian Aid called on a Lundin board member, former Swedish Conservative Party Prime Minister Carl Bildt (1991-94), to resign as U.N. Special Envoy to the Balkans. It said that his position as a U.N. peacemaker was incompatible with his membership on the board of Lundin Oil because of Lundin's operations with the Sudanese government and Sudan's scorched earth strategy around oilfields.[1347]
The Swedish foreign minister Anna Lindh said, "Lundin Oil activities are negative for Sweden," according to one press report. She added, "we expect Swedish companies to respect an ethical code in line with human rights and the environment in which they operate abroad."[1348] A special on Swedish television the week of the release of the Christian Aid report featured Mr. Bildt lead to an avalanche of warring press releases in Sweden, as Mr. Bildt refused to resign from the Lundin board or his U.N. peace position, and mounted an attack on his critics in the press. Lundin scheduled a special board meeting in late March to discuss the allegations.[1349]
Swedish Foreign Minister Lindh sought to have the Swedish government investigate Lundin's activities in Sudan. Lundin said it welcomed the inquiry.[1350] Handelsbankens Fonder, the fund division of a Swedish Bank (Handelsbanken), a large shareholder of Lundin, sold its stake in Lundin Oil. A number of other large investors in Lundin demanded an explanation regarding the human rights criticism of Lundin's presence in Sudan.[1351]
Lundin responded to the Christian Aid report with an expression of concern, saying "the company has not witnessed the acts alleged and would not accept violations of human rights within its sphere of operations." It said it would monitor the situation and look further into the allegations. It stated that its environmental impact study contained information indicating low density population settlements in the area.[1352] It did not reveal when the study was done, nor if its activities or army operations had any impact on these people whose presence was admitted ("low density population settlements").
Lundin added that Lundin employees present prior to and during the September-December 2000 construction of the all-weather oil road said that they did not witness forced removal of the local population. When company representatives visited the "habited areas along the road" in January 2001, "no signs of destruction were observed."[1353]
The Lundin statement, however, is limited to refer only to what the employees saw first hand-in Block 5A.
Lundin hastily conducted an investigation into the displacement alleged by Christian Aid in its concession, through its president Ian Lundin, and issued a letter to its shareholders, undated but published on Lundin's website on or before March 31, 2001.
We wish to state categorically that we have not witnessed any such acts [displacement] nor would we tolerate such acts to take place for our presumed benefit. . . .
We have taken these claims very seriously however, and have thoroughly discussed them with our people on the ground, government representatives as well as other people operating in the area. Our staff working locally has refuted in no uncertain terms these allegations . . . [1354]
It was around this time, however, that Swedish journalist Anna Koblanck visited the oil road with two Lundin employees, and published an article on April 28, 2001, that contradicted many Lundin assertions.[1355]
Lundin asserted that the NGOs and U.N. organizations it interviewed "have indicated to us that the local population has more to gain than to lose from our continued presence there."[1356] The road to the Lundin drilling location in Block 5A, the letter to shareholders claimed, was built after "serious reflection" and was done in a way to avoid population settlements. Lundin said that the residents were glad to have the bridge-which it claimed was built by Lundin[1357]-over the Bahr El Ghazal (Nam) River to get to market in Rubkona. What the letter does not mention, however, was that the road cuts through an airstrip which the local people built for delivery of international relief supplies in Kuac; nor that, first under the SPLA and then under other rebels, an Arab-Nuer market existed and flourished in Rupnyagai, which is south of the river and accessible from Block 5A without a bridge, between 1986 and 1997.[1358] Many Nuer sold their cattle there.[1359]
Another press release repeated these statements and elaborated on the findings of Lundin's "investigation," stating that the U.N. special rapporteur on human rights in Sudan would not have reached his damaging conclusions about the effect of oil operations on the people of Western Upper Nile/Unity State, specifically mentioning Lundin's areas, if he "had seen first hand what oil means to Unity State and its people, and heard from the local inhabitants how they feel about the presence of oil companies."[1360]
In its first quarter report for 2001, Lundin repeated that, "The Company has faced some heavy criticisms mainly in the Swedish media about its involvement in Sudan. Those criticisms are misplaced and based on unreliable information."[1361]
However, Lundin apparently limited its investigation of human rights conditions to talking to those who had not been displaced. "There are witnesses on the ground who are prepared to testify about this," Lundin stated.[1362] If this investigation was conducted in the presence of Sudan security or military personnel, as has been the case elsewhere in the oil areas, witnesses on the ground would testify to anything they thought the military or security wanted them to say. But Lundin does not disclose many important facts about its investigation, starting out with whether the interviews were private or not.
The report of the investigation excerpted on Lundin's web site was wrong in several particulars, pointing to a very limited and ahistorical inquiry. For instance, Ian Lundin is quoted as saying that the people in Bentiu and Rubkona area have moved there due to a combination of factors-one of which is seasonal migration. Nuer agro-pastoralists migrate in the dry season to areas where there is water for their cattle. Historically, they never watered or grazed their cattle inside towns. As already quoted above, relief agencies said that those tens of thousands fleeing into Bentiu town in August 2000 were displaced because of conflict.
Furthermore, Mr. Lundin's description of the war is incorrect in several ways. Lundin's press release stated, "There had been fighting in the area as a result of rebel attacks on Nuer villages which are under the protection of the SSUM [Paulino Matiep] and SSIM [Riek Machar] forces that are themselves allied with the Government, but the situation had calmed down."[1363]
As this report demonstrates, this is a one-sided and misleading rendition of what is a complex situation. Maj. Gen. Paulino Matiep, whose territory of origin is almost entirely in Block 4, came into Block 5A to attack, not to protect, villages there and to escort Sudanese government troops to the Ryer/Thar Jath well, where the government set up a garrison in 1999. Numerous interviews and documents, as well as government statements, have by now fully established that the government's military activities in Block 5A had a single purpose: protection of the oil.
The SSIM forces refer to the forces of Riek Machar, which were overall ineffective in protecting their territory in Block 5A from attacks by Paulino Matiep's militia. The two forces were technically on the same side, the government's side, but the Riek forces were less well-armed by the government. They attacked the Lundin drilling rig in Block 5A in May 1999 because of disputes over who was to control or guard the oil in Block 5A militarily. They were attacked by Paulino Matiep and government army soldiers, and they counterattacked, and so forth.
Less than a year later, in January 2000, Riek Machar left the government and formed the Sudan People's Defence Forces (SPDF), but, by mid-2000, most of the combatants who followed him into the SPDF were unofficially back on the government side again, receiving government arms in order, together with Paulino Matiep's militia, to attack the forces of Bul Nuer SPLA Cmdr. Peter Gatdet, who had joined the SPLM/A in early 2000. These attacks took place in the Nimne/Nhialdiu/Wicok zone, mostly inside Block 5A.
In other words, Ian Lundin's investigation was inadequate.
Nevertheless, he was able to give some information about the presence of the Sudanese army along the road. He admitted that "there are small camps of soldiers every 4-5 kilometres along the road and one larger camp near our drill site at Jarayan."[1364] This confirms what those who saw the road from the air and the Nuer displaced said about the militarization of the road.
Lundin's "Oil Policy on Sudan" Substitutes for a Human Rights Policy
Lundin adopted a policy on Sudan, posted on its website in 2001, but the policy contained no reference to human rights. Its only reference to the war was Lundin's belief that "economic gains, when used to improve the socio-economic and humanitarian condition of the Sudanese people, will enhance the prospects of peace in the country. [Lundin] will, within its possibilities, support initiatives that may lead to long-lasting peace in Sudan."[1365]
The significant qualifier in this paragraph is "when used to improve the social and economic condition of the Sudanese people." There is no evidence Lundin provides or that is elsewhere available that the Sudanese government has actually tried to do this. Nor does Lundin state how or whether it would attempt to ascertain whether the economic gains from oil were actually used by the Sudanese government to improve socio-economic or humanitarian conditions.
To the contrary: in its March 2001 letter to shareholders categorically denying displacement from Block 5A, Lundin admitted that "The list of oil exporting countries that have ongoing civil strife and/or are fighting guerrilla wars is unfortunately long. It includes such countries as Algeria, Angola, Burma, Columbia, Indonesia, Nigeria, Peru, Philippines, Sudan and Turkey."[1366]
None of these countries is notable for its respect for human rights. Nor did Lundin attempt to show that in any of those countries human rights conditions had improved as a result of oil development.
Talisman Buys Lundin's Non-Sudan Assets, June 2001
In June 2001, Talisman and Lundin agreed to a corporate rearrangement whereby Talisman would buy the outstanding shares of Lundin and Lundin would spin off to a new company its Sudanese and Russian assets, to be owned by the Lundin family and others.[1367] The Sudanese assets included Block 5A, Lundin's new interest in Block 5B, and its 100 percent interest in the Halaib Block in northeast Sudan.[1368] The new company, called Lundin Petroleum AB, started trading on the New Market at Stockholmsborsen. There was no mention of any trading on the NASDAQ, where Lundin Oil AB had been listed and traded.[1369] The corporate rearrangements meant that there would be no threat of U.S. capital market sanctions applying to Lundin's operations.
Carl Bildt, who was briefed by Sudan's foreign minister, Mustafa Osman Ismael, in Stockholm in July 2001, remained on the board of Lundin Petroleum and of Lundin Oil AB after the Talisman acquisition of Lundin Oil's non-Sudan and non-Russian assets.[1370] He had in the meantime become active in the search for peace in Sudan, meeting diplomats in Europe, North America, and Africa.
After the Talisman transaction was complete, Lundin Petroleum announced that it was in the process of appraising the Thar Jath discovery with a view to completing a conceptual development study. It planned to drill at least one additional exploration and two appraisal wells during the first half of 2002.[1371] In October 2001, Lundin issued new shares with preferential rights to existing shareholders of Lundin, in order to raise money to finance the development of the Thar Jath (Ryer) field on Block 5A.[1372]
Lundin Suspends Operations Due To "Insecurity," January 2002-April 2003
In December 2001, a Lundin helicopter was shot and its pilot gravely wounded. He managed to land the plane and was evacuated to Khartoum and then to South Africa for treatment.[1373] According to confidential sources, the helicopter was shot down by members of the Paulino Matiep militia after the pilot refused to give them a ride.[1374]
In January 2002, the militia that had been guarding the Lundin installations in Block 5A since 2000, led by Cmdr. Peter Paar Jiek of Riek Machar's SPDF forces, formalized in writing a standstill agreement first concluded in August 2001 with Cmdr. Peter Gatdet of the SPLA, ending the war of the "Peters."[1375] Cmdr. Peter Paar then ceased to guard the Lundin installations.
These two events, the helicopter shoot-down and the defection of the pro-government militia guarding its installations, combined to cause Lundin to suspend activities. On January 22, 2002, Lundin announced that its operations in Block 5A would be suspended "as a precautionary measure to ensure maximum security for its personnel and operation."[1376] This announcement came three days after the signing of a ceasefire to be monitored by international inspectors in the Nuba Mountains, which Lundin noted hopefully in its press release.[1377] In its letter to shareholders after the Block 5A suspension, it referred to "deteriorating security conditions" in that block as the reason for suspending activities.[1378] Lundin retained hope, however, that the U.S. peace effort started in late 2001 under Senator John Danforth would permit a ceasefire which would allow Lundin to re-start its operations in the dry season, beginning in December 2002.[1379]
But Lundin, even as it recognized in a letter to shareholders that its engagement in Sudan had raised ethical issues, narrowly defined the issues to ignore displacement: "The question being raised is whether oil fuels the war or sets the conditions for peace by providing the country with the necessary means to lift itself out of poverty. We believe in the latter."[1380] Lundin did not offer any evidence or basis for this belief, however.
In releasing its six-month report for 2002, Lundin underlined its continuing desire to develop its Sudan assets: "We are long-term investors and remain fully committed to exploiting the resources in Sudan . . . . The quality of our assets in Sudan are world-class with the Thar Jath discovery estimated to contain 1 billion barrels in place and the rest of our acreage having excellent exploration potential."[1381]
On July 24, 2002, days after the landmark Machakos peace protocol was signed by the Sudanese government and the rebel SPLM/A, Lundin's chairman stated: "We hope the [Machakos peace] discussions will lead to a full and sustainable peace agreement that will allow us to resume operations."[1382] A ceasefire between the two parties was signed in October 2002. Operations in Block 5A resumed in April 2003 after a fourteen-month suspension, although no peace agreement had been reached. In June 2003, Lundin sold out its interest in Block 5A to Petronas, retaining the Block 5B concession.
Lundin Community Development Program
The Lundin consortium began a community development and humanitarian assistance program (CDHAP) in 2001.[1383] One of its objectives was to provide a better quality of life "for the current and future inhabitants" of Block 5A (emphasis added).
One activity was to supply fresh water, because there was no good supply in the area. Lundin was trucking in water to water cisterns placed along its all-weather road, where it also drilled six water wells. Lundin repaired ten water wells in Ler, a garrison town. A Sudanese medical doctor retained by Lundin did a needs assessment onthe feasibility of providing permanent medical services in the area. Lundin decided to rebuild the existing hospital in Ler, presumably the brick building constructed by the British that MSF-Holland used for a decade (1988-98) until it was repeatedly looted in the fighting.[1384]
Lundin's CDHAP booklet notably contains aerial photographs of a temporary (dry season) Nuer settlement and a Nuer village. It also contains a photograph of the bridge linking Rubkona to Bentiu over the Bahr El Ghazal (Nam) River, and a bus at Jarayan well.
When interviewed by human rights investigators, however, those displaced from Block 5A in 2002 were not aware of any of Lundin's "social investment" activities. The investigators noted, "Although one of the oil business's contributions made by the Lundin Petroleum-led consortium for the development of the region was the building of a bridge over the Bahr el Ghazal [Nam] River, the bridge's only tangible impact on the well-being of the local communities has been to enable Baggara horsemen and mechanized Government forces to access the area, and to kill, rape and chase away the people."[1385]
Block 5A was the focus of increasingly heavy government military operations from 1998 to date. In these operations government forces have relied on the oil company road and the bridge for access to the areas that they have targeted, generating increasing numbers of wounded and killed, as well as tens of thousands of displaced persons. The Sudanese government forces continued to fight to militarize and control the Lundin oil areas even after signing a ceasefire agreement in October 2002, notably in January and February 2003 during a dry season offensive in Block 5A documented by the Civilian Protection Monitoring Team (CPMT).[1386]
While Lundin's development projects may have assisted some people in the area of its operations, they cannot compensate for the abuses that those people have suffered because of the fighting connected to oil development.
CHINA'S INVOLVEMENT IN SUDAN: ARMS AND OIL
China's need for oil reserves for its growing domestic economy has caused its government to pursue investments in many countries of marginal stability and democracy, but its greatest oil success abroad has been in Sudan.
Although the China National Petroleum Company (CNPC) had escaped the public relations hammering that Talisman was receiving, it was drawn into the controversy through the efforts of Sudan activists to bar the use of U.S. financial markets to raise money for anyone doing oil business in Sudan in late 1999.
China's first foray into the world of high finance-to open up its enormous government-owned corporations to foreign investment-was a controversial offer to sell stock in CNPC to the public on the New York Stock Exchange (NYSE). Its offer, designed to raise a record U.S. $ 10 billion, had to be withdrawn and refashioned because of the negative publicity suggesting that the proceeds would be used to commit further human rights abuses in Sudan, Tibet, and elsewhere. Ultimately, the 90 percent-CNPC-owned subsidiary PetroChina, with a "firewall" to prevent any of the new capital from going to the Sudanese operations, proceeded with a stock offer to raise U.S. $ 10 billion. A broad-based coalition opposed to the PetroChina IPO ultimately succeeded in reducing the proceeds from the IPO by some 70% to only U.S. $ 2.89 billion. This reduced amount was raised with major participation from British Petroleum and a few other large companies. Questions about China's financing of arms sales to Sudan and allegations of Chinese prison labor used in the construction of Sudan's oil pipeline were never addressed.
Arms Trade between China and Sudan
China was not new to Sudan. By the time it invested in GNPOC in December 1996, it was already a familiar arms dealer to many Sudanese governments. The Nimeiri government (1969-85) bought weapons from China. But these purchases rose in the 1990s due to Sudan's internal war and the promise of improved finances and enhanced international credit derived from its oil potential.
Weapons deliveries from China to Sudan since 1995 have included ammunition, tanks, helicopters, and fighter aircraft. China also became a major supplier of antipersonnel and antitank mines after 1980, according to a Sudanese government official.[1387] The SPLA in 1997 overran government garrison towns in the south, and in one town alone, Yei, a Human Rights Watch researcher saw eight Chinese 122 mm towed howitzers, five Chinese-made T-59 tanks, and one Chinese 37 mm anti-aircraft gun abandoned by the government army.[1388]
Human Rights Watch concluded that while China's motivation for this arms trade appeared to be primarily economic, China made available easy financing for some of these arms purchases.[1389]
China's Need to Acquire Foreign Oil Reserves
China invested in Sudan's nascent oil industry because of its need to acquire foreign oil reserves. While China expected its industrial development to make increasing demands for more oil, the Chinese oilfields had, by the late 1990s, already passed their peak production. "China until recently relied on its vast northeastern Daqing oilfield to fuel its energy needs, but output is declining and it has yet to find new large domestic supplies," according to the Chinese government news agency Xinhua.[1390]
In the early 1990s, the Chinese government projected that it could have a shortfall of about 50 million tons of crude oil (30 percent of its oil needs) in 2000, while domestic crude output remained static at 160 million tons. China therefore had to rely on its ability to stake out oil reserves abroad. Oil analysts projected that China would become an oil importer-at the mercy of non-Chinese oil producing states and companies-within five years.[1391] China set about becoming a global player in the oil industry. Chinese officials wanted "to have a 10-million-ton-oil supply from overseas a year by 2000 and 50 million tons of oil and 50 billion cubic meters of gas by 2010."[1392]
By 1997, according to CNPC's then president, Zhou Yongkang, China was "very aggressive in buying foreign oil and gas fields."[1393] The CNPC brought its first shipment of foreign crude oil to China in 1997.[1394]
CNPC, a government-owned corporation, acting through a wholly-owned subsidiary, took the largest share, 40 percent, in the GNPOC consortium on December 6, 1996, when Arakis sold 75 percent of its interest in the project to three other companies to form that consortium.[1395] The Sudanese project was expected to produce up to ten million tons of oil a year for China by 2000, which would by itself help meet China's projected oil import target for 2000.[1396]
In 1998, CNPC's construction arm, China Petroleum Engineering & Construction (Group) Corporation (CPECC), participated in the construction of the 1,500-kilometer-long GNPOC pipeline from Blocks 1 and 2 to the Red Sea. It also built a refinery near Khartoum with a 2.5 million-ton processing capacity. It further engaged in "10 million tons oilfield surface engineering." The Sudan project became "the first overseas large oilfield operated by China," according to the Chinese.[1397]
The Chinese government-run news agency was effusive about China's participation in the Sudan project, characterizing it as CNPC's biggest overseas project to date.[1398] The agency termed the oilfield, the long oil pipeline, and the oil refinery China built in Sudan "a major breakthrough in China's overseas oil work."[1399] The news agency likewise claimed, "China has made a series of technological breakthroughs in undertaking the huge [Sudan] oil project, including in the sectors of oil engineering technology, geological prospecting and oil drilling."[1400]
Yet, China claimed it did not make any profit on the pipeline, refinery, and two oil well projects in Sudan. The vice president of CPECC said, "A Western company couldn't have done what we did . . . Sudan wanted it done in 18 months and we did it, even though we knew we wouldn't make any money."[1401]
China admitted that it brought in a team of 10,000 Chinese laborers so the GNPOC project could be completed by the NIF's tenth anniversary (June 30, 1999). Its labor costs were low: "Our workers are used to eating bitterness . . . they can work 13 to 14 hours a day for very little."[1402] Similarly, the Chinese subcontractor (also a Chinese government enterprise) brought in two Chinese crews for the seismic phase of the Lundin operation in Block 5A. They were new, straight from Beijing. Some did not know how to drive a vehicle.[1403]
It was widely rumored in the oil business in Sudan that the Chinese planned to bring in prisoners to build the pipelines, which was allegedly how they underbid others to get the pipeline contract.[1404] Still, it is difficult to see how Chinese laborers brought to Sudan could live and work for less than southern Sudanese laborers, even Chinese prisoners, because of the transportation cost-even if the transport was one-way for many who may have perished from disease in the inhospitable swamps and baked savannahs. China also admitted that the Sudanese army had to protect the Chinese workers from rebel attacks.[1405]
The Chinese companies' failure to hire local staff led to copious complaints from southerners. In Block 5A, Lundin and its Chinese subcontractor had a crew of sixty people in the "highland" location (Ryer/Thar Jath), forty-five of whom were (northern) Sudanese, the rest Chinese. On the "swamp crew" of sixty (on the White Nile), thirty to forty were Sudanese, the rest Chinese. The Chinese spoke no English and translations were done by the Chinese party chief, who spoke rudimentary English.
The Chinese subcontractor had recruited in the north and hired northern Sudanese to work on this Block 5A project, though they did not have any technical expertise and had to be trained on the job. The Rappaport security consultant to Lundin advised Lundin and the Chinese that it was not a good idea to take northerners to the south to work. Everyone from the Bentiu area, from the governor to the local hires, complained that there were not enough locals on the job, he reported. The Chinese subcontractor insisted on bringing in these northern workers, however. After some incidents, the security company put its foot down on hiring northern Sudanese, and the Chinese subcontractor relented.[1406]
The Chinese companies involved in GNPOC did all this work, their spokesman said, for no profit-for valuable experience overseas-which, as China omitted to mention, was gained mostly under Talisman as project manager. The Wall Street Journal nevertheless reported in 1999 that the Sudan project accounted for U.S. $ 500 million of a record $ 710 million in revenues (unaudited) for China Petroleum Engineering & Construction (Group) Corporation.[1407]
China's First Initial Public Offering on the N.Y. Stock Exchange Backfires
CNPC announced in April 1999 that it planned to begin selling shares to the public in China and overseas to help fund new projects.[1408] This was to be the first initial public offering (IPO) that the Chinese government was to make, to be followed by many more as it restructured and privatized its state-controlled economy. China planned to open with a big splash in the U.S.: the CNPC IPO was to be the biggest IPO Wall Street had ever seen, at some U.S. $ 10 billion. CNPC would become the first Chinese state company to be listed and traded on the NYSE.
The listing and the IPO immediately ran into trouble on account of China's record of human rights abuses and the CNPC investment in Sudan. U.S. Representative Frank Wolf (R-VA) on September 30, 1999 wrote the U.S. Securities and Exchange Commission (SEC, which regulates securities filings required for an IPO) asking it to disapprove the CNPC's listing on the NYSE. U.S. Representative Wolf said that permitting CNPC to raise U.S. money on the NYSE would bypass the U.S. economic sanctions imposed on Sudan, a state sponsor of terrorism and a CNPC partner in the oil project. It would also make it easier for Americans to unknowingly invest in a company "that is propping up a regime engaged in slavery, genocide, and terrorism."[1409] Representative Wolf claimed that Sudan was CNPC's largest venture and that it invested an estimated U.S. $ 1 to $ 2 billion in Sudan, on a total CNPC investment of U.S. $15 billion.[1410]
Roger W. Robinson, Jr., chair of the William J. Casey Institute of the Center for Security Policy and former official in Pres. Ronald Reagan's National Security Council, brought up additional reasons for objecting to the IPO: CNPC was in partnership elsewhere in the world with two other states on the State Department's list of countries sponsoring terrorism, Iraq and Iran.[1411]
The U.S. Commission on International Religious Freedom (U.S. CIRF),[1412] a creation of the U.S. Congress, on November 1, 1999, asked the U.S. Treasury to extend the stringent 1997 economic sanctions imposed on U.S. companies doing business with Sudan to CNPC and others using American debt and equity markets to raise money for the Sudan oil project. The grounds were that CNPC's oil interest in Sudan would fund a "war against the south . . . patterns of forced conversion to Islam, manipulation of food aid, bombing of refugee camps, hospitals, churches, and other civilian targets, as well as enslavement."[1413] This pressure came just as the Clinton administration was launching an effort to persuade Congress to approve China's admission into the World Trade Organization.[1414]
CNPC Erects a "Firewall" to Satisfy Activists
Two days after the U.S. CIRF demand, CNPC's investment bankers Goldman Sachs restructured the deal. They created a separate company to float the public offering, PetroChina Co., which would operate only inside China.
CNPC's domestic China holdings would be spun off to PetroChina and the CNPC would exclude its Sudan (and all other foreign) operations from the IPO.[1415] Oil analysts had already expressed disaffection with CNPC's overseas crude reserves, some of which had a low yield (such as in Peru) or political problems (such as in Iraq).[1416]
The proceeds of the IPO were to be used solely for development of China's domestic oil reserves[1417] and PetroChina would not use any of its funds for Sudanese operations, according to CNPC's investment bankers.[1418] The CNPC claimed it needed the IPO funds to build new infrastructure in China to transport crude as well as oil products within China. The Chinese government had already restricted oil imports so its domestic oil company, now PetroChina, could reap a profit.[1419]
PetroChina would rank as China's largest company, with 70 percent of the country's petroleum reserves and accounting for two-thirds of its oil and gas production. It would immediately become the world's fourth-largest publicly traded oil and gas company, although the Chinese government, through CNPC, would still own 80 to 90 percent of PetroChina's stock after the public offering.[1420]
PetroChina maintained it was neither a U.S. nor a Sudanese company nor would it have direct business dealings with Sudan.[1421] Upon closer examination, this was not the divorce it first appeared to be for at least two reasons: income and debt. Critics charged that the CNPC, as the parent company, would receive 90 percent of PetroChina's income, including funds raised in the IPO. PetroChina's chairman denied the company would use proceeds from its stock offering to fund projects in Sudan.[1422]
When created, PetroChina inherited U.S. $ 15 billion in debt from CNPC, giving critics the opportunity to point to more overlap: this debt, incurred partly in connection with the GNPOC project, would be borne by PetroChina.[1423] Pressure in the U.S. against CNPC mounted: in December 1999 170 civic and religious leaders urged President Clinton to amend U.S. sanctions on Sudan to ban CNPC access to U.S. capital markets as long as it was a partner in Sudan's oil development, arguing that "the fungibility of money and the scale of CNPC's activities in Sudan thoroughly undermine the credibility of this [PetroChina] contrivance."[1424]
In February 2000, President Clinton extended the 1997 U.S. sanctions on Sudan to GNPOC and Sudapet by executive order.[1425] In a setback for the campaigners, however, the U.S. Treasury Department answered Rep. Frank Wolf's letter in April 2000, ruling that the 1997 presidential executive order imposing economic sanctions on doing business with Sudan did not prohibit U.S. citizens from investing in non-Sudanese companies doing business in or with the Sudanese government.[1426]-describing CNPC and Talisman to a "T." Some experts claimed it would be unprecedented to apply such sanctions to stock and bond transactions, since sanctions are usually limited to trade and investment. President Clinton said he shared U.S. CIRF's concerns about new oil revenue for Khartoum. But extraterritorial or third country sanctions, he maintained, would "ultimately prove counter productive and hurt U.S. ability to use diplomatic means to maintain pressure on [Khartoum]."[1427]
But these protest actions, and those of the other campaigners on Sudan, delayed the Chinese financial offer by at least four months and substantially cut back the funds raised.[1428]
Opposition Undercuts PetroChina Initial Public Offering, March 2000
After CNPC spun off the PetroChina subsidiary to avoid Sudan protests, the PetroChina IPO was still not quite on track: it was further delayed by extensive questions by the NYSE.[1429] U.S. Congressmen on March 1, 2000, signed a letter opposing the PetroChina IPO on human rights and other grounds.[1430]
Then the largest American trade union federation, the AFL-CIO,[1431] entered the fray, urging investors to stay away from the PetroChina offer. The union claimed the money raised would be used to lay off one million oil workers in China.[1432] In response to Goldman Sach's road show promoting the PetroChina public offering, the AFL-CIO launched its own "alternative road show." AFL-CIO Chairman John Sweeney, in a teleconference call with forty-two leading global institutional investors in March, warned about the hazards of buying PetroChina's stock.[1433]
On March 22, 2000 the AFL-CIO and the NGO Free Tibet co-sponsored a protest at the office of PetroChina's investment banker Goldman Sachs in New York City.[1434] Bill Patterson, director of AFL-CIO's office of investments, was convinced that political opposition and subsequent negative press reduced interest in PetroChina's IPO: "We haven't found a single fund yet that even wants to get near this deal."[1435]
BP Amoco PLC offered to purchase up to one billion dollars, or twenty percent, of PetroChina's IPO. In return, BP Amoco, a long-time investor in China, received the right to establish a gas-marketing joint venture in eastern China.
In response, the broad anti-PetroChina coalition began a boycott of BP Amoco gas stations in the U.S. in March 2000.[1436] Although BP Amoco had not directly invested in Sudan or GNPOC, any affiliation with PetroChina or CNPC, direct or indirect, continued to invite harsh criticism. The head of one advocacy group warned PetroChina investors with this sound bite: "If you want to be tarred with this radioactive slave stock then we will do that."[1437] Ultimately the PetroChina IPO raised U.S. only $2.9 billion.[1438] The anti-PetroChina coalition represented possibly the most effective example of shareholder activism since the South Africa divestment campaign. CNPC continued to hold 90 percent of PetroChina stock.
CNPC did not respond to Human Rights Watch correspondence mailed or faxed to its Sudan office and in care of the Chinese embassy in the U.S.
2001
In 2001, confirming earlier trends, Chinese oil industry officials announced that CNPC had targeted Sudan as the centerpiece of its ambitions to triple overseas production by 2005. CNPC planned to establish two new oilfields in Sudan with a combined output of 180,000 barrels per day, on top of its "biggest overseas windfall," in the GNPOC concession. The two new oilfields would be in Blocks 3 and 7 (Melut Basin), and Block 6 (Muglad Basin in western Sudan, northwest of the GNPOC concession).
CNPC had received revenue of more than U.S. $ 600 million from the GNPOC concession since exports began in September 1999, and Sudan accounted for two-thirds of CNPC's overseas production in 2000.[1439] CNPC's dependence on Sudanese crude oil continued to expand, importing 2.69 million tons from Sudan in January to June 2001, up 38 percent from the year before.[1440]
But China's involvement in Sudan continued to draw criticism and reports of military cooperation. One journalist said that CNPC "reportedly purchased a high-tech radar system for the government last year [2000]."[1441] This allegation remains to be investigated.[1442]
CNPC Participation in Government Refinery
The Khartoum refinery, inaugurated with great fanfare on the tenth anniversary of the Islamist-military coup of June 30, 1989, was built to suppl the bulk of petroleum products consumed in Sudan. Described in the press as a private enterprise, it has been described by the IMF as a joint venture between Sudan and the CNPC, with mostly Chinese financing.
The CNPC secured a valuable concession in the contract: if debt service on this refinery is not met, the CNPC has the right to lift the equivalent of crude oil in kind-which would leave Sudan without its domestic fuel to refine. As the IMF put it, as to the debt to CNPC for the refinery, "nonpayment thus is not a realistic option."[1443] Debt service payments for the Khartoum refinery, amounting to U.S. $ 60 million, would have priority over all other debt service payments, such as to the IMF, the World Bank, and other creditors.[1444]
OTHER OIL COMPANIES
Petronas: Partner in GNPOC, Lundin, and Block 5B Concessions
Petronas Carigali Overseas Sdn Bhd (Petronas) invested in the GNPOC project (30 percent) on December 6, 1996, and in Lundin's Block 5A on February 6, 1997 (28.5 percent). It was the second largest owner in both projects, and in 2003 became the largest owner in Block 5A when Lundin sold its interest to Petronas.
A 60 percent subsidiary of Petronas was also awarded a management consultancy services contract for the pipeline/export terminal project serving the Heglig and Unity fields in 1998.[1445] In addition, Petronas' subsidiaries were awarded other oil-related jobs in Sudan, including the GNPOC award of the contract for the second phase of the Muglad Basin Oil Development project (oilfields Munga and Bamboo in Block 4) to OGP Technical Services Sdn Bhd, in October 2000.[1446]
Petronas is wholly owned by the state oil company of the government of Malaysia, Petroliam Nasional Berhad (Petronas), which is the largest company in Malaysia, headquartered in its capital Kuala Lumpur. Petronas has a record of conducting its business in and with countries with extremely bad human rights records, including China, Cambodia, Burma, and Vietnam.[1447]
Petronas was leading the way for other Malaysian companies to invest in Sudan. Ten Malaysian companies invested in Sudan by February 1999, up from three in 1998, and the number was expected to exceed thirty by the end of 1999. Tenaga Nasional, a large Malaysian company, completed feasibility studies for power generation. Bank Rakyat was involved in the development of 10,000 hectares of land for palm oil cultivation, and Metrobus, a public transport company, was pledged to produce 1,500 buses for Sudan and operate part of its public transport system.[1448] Discussions between Sudan and Malaysia centered on expanding Malaysian investments-so far some U.S. $ 1 billion-in the oil industry as well as other investments in 2000.[1449]
Petronas, as a national oil company, was proud of its own development and its promise of extending a helping hand to the people of Sudan.[1450] In a letter of reply to Human Rights Watch, it stressed its interest in human rights.
We wish to inform that we are as equally concerned over reports of alleged human rights violations around the areas in southern Sudan where the consortium which we are part of is carrying out petroleum activities. Within our sphere of influence we will continue to work closely with concerned parties to contribute where possible to any required improvement of the human rights situation in the Sudan.[1451]
The company cited its Corporate Mission Statement, a set of business principles to contribute to the well being of the people and nation wherever it operates, and its presentation to its personnel on human rights and codes of conduct. It has sent some representatives to participate in international workshops and seminars on human rights, including a round table conference on human rights and principles of conduct of company operations within the oil industry, held in November 2000 in Mulheim, Germany. It contributes to community improvement projects and offers scholarships and sponsorships to nationals of host nations including Sudan.[1452]
Petronas' letter refers to issues and the statement of facts (about civilian displacement from the Sudanese oilfields where Petronas has a presence, the GNPOC block and Block 5A) raised in the Human Rights Watch letter. It says only that it "will closely work with our consortium partners in the Sudan to address these, within our own spheres of influence."[1453] It also mentions with approval Amnesty International's recommendations about the Sudan oil industry.
Petronas continues to seek greater participation in Sudan's oil industry. On May 3, 2001, Lundin announced that Petronas and Sudapet would be joint operators with it on Block 5B neighboring Block 5A, with interests of 41 percent and 10 percent respectively. Lundin Muglad Limited, wholly owned by Lundin and the Austrian company OMV, would each have a 24.5 percent interest in Block 5B.[1454] Block 5B includes the Nyuong Nuer towns of Nyal and Ganyliel in Western Upper Nile/Unity State. These two towns saw fighting between Nuer and Dinka prior to the West Bank Covenant at Wunlit (1999), and the Peter Gatdet (Bul Nuer) SPLA troops attacked Nyal in February 2001, after which an emergency meeting of the West Bank Peace Council was held in Ganyliel.[1455]
Petronas has also invested in the Ethiopian west, where the Melut Basin extends from Sudan. Petronas has been described as on the Fortune 500 list of largest companies.
OMV (Sudan): Excited about Thar Jath Discoveries
OMV (Sudan) Exploration GmbH is a 100 percent-owned subsidiary of Austria's OMV Aktiengesellschaft, which has many retail fuel outlets in Central Europe. The parent company OMV is traded on the Vienna, Munich, and Frankfurt stock exchanges.[1456] It is one of Austria's largest industrial companies listed on the Vienna Stock Exchange and one of the leading oil and gas groups in Central and Eastern Europe. It also conducts international exploration and production activities outside the core European region. OMV Aktiengesellschaft also owns subsidiaries doing business in Libya, Vietnam, Albania, Bulgaria, and Russia, among other countries.[1457]
OMV (Sudan) owned 26.125 percent of the consortium that is developing Block 5A. Following the successful exploratory well at Ryer/Thar Jath in early 2001, Gerhard Roiss, member of OMV's Executive Board, stated: "OMV exploration has drilled in the last months an impressive row of new oil discoveries, but Thar Jath has the potential to be by far the largest one."[1458] OMV regarded its exploration success in Sudan "as a major step forward following the company's strategy to strengthen its Exploration & Production Division in its prime growth area North Africa / Middle East."[1459]
The statement most nearly regarding corporate responsibility is in OMV's "Guiding Principles" on its website: "We are guided in our work by responsibility for people, the environment, and technical progress."[1460] There is no mention of operations conducted in a country at war or of human rights per se.
OMV answered an August 2000 letter from Human Rights on April 6, 2001. OMV took the same position as all the other oil companies that responded to Human Rights Watch:
We have reached the conclusion that, despite problems, the influx of oil revenues could improve the social and humanitarian conditions of the Sudanese. Oil exploration activities also represent immediate benefits to the local population, in terms of employment, infrastructure developments and humanitarian assistance. . . .
While human rights issues are very clearly addressed in OMV's HSE policy and in a more general way in OMV's corporate mission statement the operator Lundin has adopted an explicit code of conduct. Our role is to constantly monitor the situation on the ground and to turn our perception of business ethics into reality by responsible action. . . .[1461]
Only after the publication of the European Coalition on Oil in Sudan (ECOS)'s report, "Depopulating Sudan's Oil Regions, January-March 2002," on May 14, 2002, concerning OMV's Block 5A did OMV publicly acknowledge any concern, saying in a written statement to Reuters, "On any occasion and regardless of who the aggressors may be, we regard the situation as alarming."[1462]
OMV met with European human rights advocates in 2002, led by Sudan Platform Austria, and told them that it had commissioned an independent report on the human rights situation. It also said that it would not make the results public.[1463] It also reiterated to the press, "For us, it is very important that human rights are respected, and this is very much in the foreground."[1464]
OMV sold out of Blocks 5A and 5B a few months after Lundin left Block 5A. OMV agreed on September 2, 2003 to sell its investments to ONGC Videsh.[1465] The results of its human rights investigation, if any, have not been disclosed.
TotalFinaElf: Courted by Khartoum Government
The French/Belgian company TotalFinaElf, created from the mergers of three large European-based oil companies, is one of the leading oil companies in the world. In or about 1980, its predecessor Total acquired the concession for Block 5, which encompasses the place where the El Muglad and Melut Basins join. Block 5 stretches with zigzag borders south from Malakal to Bor and east to the Ethiopian border.[1466] At approximately 120,000 square kilometers, it is by far the largest oil concession in southern Sudan, and reportedly the richest.
Total carried out seismic surveys in Sudan in the early 1980s and found that Block 5 (then Block B) had a "huge potential" for oil production. The company suspended operations in Sudan for security reasons in 1985,[1467] a year after Chevron halted southern operations, but it maintained its ownership of the concession rights. Total executives made yearly trips to Sudan and met with the government so as to not lose the concession. The civil war made it impossible to develop Block 5, and qualified as a "force majeure" exception to the time limits set forth in the agreement, in the opinion of Total, and the Sudanese government either agreed or acquiesced.[1468]
What accounts for the extraordinarily long "force majeure" time period-not extended to the U.S. company Chevron at the same time-is no doubt Sudan's desire to keep at least one huge multinational involved in Sudan. According to the Indian Ocean Newsletter, Sudanese Minister of Petroleum Awad al Jaz set off on a European tour in September 1999. He met what were then TotalFina officials in Paris, asking them to resume work on their permit in southern Sudan and offering further prospecting rights. He claimed that safety was improving. TotalFina officials reportedly decided to send a mission, accompanied by Sudanese officials, to check out the safety situation in Bor,[1469] but it is not clear that the journey was ever made.
Following the oil minister's pleas, TotalFina's Director for East Africa Exploration announced in October 1999 that the company was planning to return to Sudan after a fourteen-year absence, focusing initially on further explorations in its existing concession of 120,000 square kilometers, Block 5. He said, "We plan to extend our presence in Sudan as the security seems to be improving."[1470] This statement, however, was made just a few weeks after the (September 1999) first sabotage of the GNPOC pipeline and the mutiny of several thousand of Gen. Paulino Paulino Matiep's Bul Nuer militia troops, led by Cmdr. Peter Gatdet, who joined the SPLM/A. Block 5 is well inside various rebel lines-including those of the SPLM/A; Dr. John Garang, commander-in-chief of the SPLA, was born in Bor County, whose rural areas remain under SPLA control.
Meanwhile, Sudan's oil minister said that TotalFina had bid for another concession, and that Sudan was eager to offer TotalFina the possibility of acquiring another tract.[1471] On October 27, 1999, the French ambassador to Khartoum Michel Raimbaud reportedly told a Sudanese official that more French companies would invest in Sudan, particularly in the field of energy. The French ambassador made his comments the day after the Canadian government said it might impose sanctions on Sudan.[1472]
As of the writing of this report, TotalFinaElf has not taken any visible steps to expand its activity or interest in Sudan. Its concession is far from the pipeline and from the front line of the oil war. But the possibility that this giant would step in to the largest block in the south was always in the air, behind the government's push to clear the way for the smaller companies on the smaller blocks.
Royal Dutch/Shell
The Shell Transport and Trading Company, the U.K. holding company of the Royal Dutch/Shell Group of companies, acquired the first oil exported from Sudan in 1999, to be refined in its Singapore refinery. Royal Dutch/Shell was trying to get an integrated, continuous, and long-term contract to purchase Sudanese crude oil, the government said.[1473]
Royal Dutch/Shell produced aviation fuel in Sudan. In May 2000, the Sudanese ministry of energy and mining declared that Sudan had begun producing aviation fuel.[1474] Shell would have less of the Sudanese aviation fuel market and could expect its profits to drop.
Royal Dutch/Shell met with European campaigners urging it to withdraw from Sudan in early 2001. At its annual meeting, it was subjected to criticism for doing business in Sudan. It undertook to prevent the sale of its aviation fuel to the Sudan military. This decision not to sell aviation fuel to the Sudanese government was made easier by local competition from a Sudanese government enterprise.
THE UNITED STATES: DIPLOMACY REVIVED
Overview
After 1989, when a coup deposed the elected government and imposed a military-Islamist junta on Sudan, the Sudanese government became internationally ostracized for its gross human rights abuses. The U.S. was legislatively mandated to vote against the Sudanese government in international lending institutions, and did so. The U.S. under the administration of Pres. Bill Clinton (1993-2001) developed a policy of isolation of the hard-line Sudanese government and worked diplomatically with U.S. regional allies (also referred to as the "Front Line States," Eritrea, Ethiopia and Uganda) to bring pressure to bear on the Sudanese government. In late 1997 the U.S. also imposed economic sanctions prohibiting U.S. entities from doing business with the Sudanese government.
When the "Front Line States" isolation strategy failed because the key regional actors became sucked into their own wars (Uganda in the Democratic Republic of Congo, Eritrea and Ethiopia against each other), nothing replaced it.
The conservative religious lobby in the U.S., which began in the 1990s to develop greater concern with religious persecution in other countries, put Sudan at or close to the top of its priority list, describing the situation there as "genocide." It attracted grassroots attention with campaigns to collect money to free slaves (described as "Christians" enslaved by Arabs or Muslims) in Sudan. It pressured the U.S. government to maintain a harder line on Sudan, including increased sanctions and "nonlethal" support for the rebel SPLM/A, despite its bad human rights record.
Sudan attracted the concern of high-level officials in the administration of Pres. George W. Bush starting in early 2001, including the president himself. On September 6, 2001, in the White House Rose Garden, President Bush announced the appointment of his special envoy for peace in Sudan, former U.S. Sen. John Danforth. He initiated a process to establish whether either side-the Sudanese government or the SPLM/A-was interested in peace.
The forward momentum on Sudan was accelerated when U.S. foreign policy after September 11, 2001, became concentrated on a war on the terrorists who attacked the U.S., believed to be part of an international conspiracy headed by Osama bin Laden. The U.S. called on all countries to cooperate. Sudan, which had hosted Osama bin Laden between 1990 and 1996, quickly announced that it would cooperate with the U.S.
The U.S. did not limit its interest in Sudan to the sole issue of terrorism. Senator Danforth vigorously pursued his mandate, setting up four tests for the two Sudanese parties to pass to demonstrate their commitment to peace. In May 2002 he found that their interest was sufficient to warrant serious U.S. engagement in a diplomatic solution to the crisis. Further talks resulted in a July 2002 agreement at Machakos, Kenya, between the warring parties addressing the key issues of self-determination and the relationship between the state and religion, and a ceasefire agreement was reached in October 2002 in the context of the on-going peace negotiations. As of the writing of this report, the negotiations have not produced a final peace agreement.
Clinton Administration Policy on Sudan
The Clinton administration policy on Sudan evolved into a hardline policy of attempting to isolate that country as a "pariah state." Sudan had been one of the few countries in the world to side with Iraq after that country invaded Kuwait in 1990. In 1992, several Sudanese employees of U.S. AID working in Juba were summarily executed by the army following an SPLA incursion into that southern capital city. In 1993, the U.S. State Department designated Sudan as a state sponsor of terrorism whereby additional sanctions were imposed on U.S. relations with Sudan.[1475]
In June 1995 there was an attempted assassination of Pres. Hosni Mubarak of Egypt while he was in Addis Ababa, Ethiopia, to attend an OAU conference. Three Egyptians, apparently part of the assassination team in Sudan, fled back to Sudan immediately after the attempt with the help of the Sudanese embassy in Addis. Sudan's know-nothing response to Ethiopia's extradition request for the three lead the U.S. to try to impose Security Council sanctions on Sudan for its failure to honor the extradition order. Minor diplomatic and air travel sanctions went into effect.[1476] They were not lifted until September 2001: the extradition order was never honored.
The U.S. Congress also passed a military assistance bill providing funds to help the three "Front Line States" fight their own rebels-which rebels were supported by Khartoum. It was widely assumed that this money was intended to pass through to the SPLM/A, which each of these countries had a history of supporting. The SPLM/A, however, complained bitterly that it saw none of it at all.[1477]
In February 1996, the U.S., for security reasons, withdrew its American staff from its embassy in Khartoum, although the embassy was never closed. In April 1996, President Clinton signed the Antiterrorism Act, which restricted U.S. commerce with nations designated as sponsors of terrorism by the State Department. The U.S. Treasury Department granted the Occidental Petroleum company a secret waiver from restrictions on investment in Sudan in August 1996. The Sudanese government, however, claimed it excluded the company from consideration as an investor because of uncertainly about diplomatic relations with the U.S., in November 1996. The whole story was not known publicly in the U.S. until January 1997.[1478]
U.S. Bombs Khartoum, August 1998
In June 1998, the U.S. embassies in Nairobi, Kenya, and Dar es Salaam, Tanzania, were simultaneously attacked by suicide bombers in trucks, killing hundreds, mostly Kenyans and Tanzanians. The U.S. attributed the attacks to the Islamist militant group Al Qaeda, led by Osama bin Laden from bases in Afghanistan.
On August 20, 1998, the U.S. struck Khartoum with two cruise missiles, destroying its target, the Al Shifa pharmaceutical plant, which the U.S. suspected of involvement with the alleged embassy bombers and chemical weapons. One person was killed and eleven workers injured in the nighttime attack.
The Sudanese government strongly protested the attack and called on the U.N. Security Council to investigate the plant and determine if chemical weapons had been there, but the U.S. defeated efforts to put the matter on the Security Council agenda. The U.S. further refused to disclose evidence which would be sufficient to justify-to the international community-its belief that the factory or its owners were involved in the embassy bombings, chemical weapons, or terrorism, claiming that this would compromise U.S. security methods and personnel.[1479]
The Al Shifa bombing therefore became a setback to U.S. diplomatic efforts to lead its allies and world opinion with regard to Sudan, particularly to lead them to isolate Khartoum as a means of pressuring the Sudanese government. In addition, the U.S. regional allies, the "Front Line States" of Eritrea, Ethiopia, and Uganda-who had long been assisting the SPLA militarily for their own reasons-lost interest in Sudan as they became mired in other wars. Eritrea and Ethiopia fought each other in a bloody crossborder war from 1998-2000, and Uganda in 1998 ventured into Congo, where its fought on the side of rebel groups in northeast Congo, agreeing only in 2002 to withdraw. The Ugandan forces also participated-with strong-arm tactics-in exploiting and trading in Congo's abundant and valuable mineral wealth, according to a report by a U.N. panel of experts.[1480] To show its disapproval, the U.S. held up part of the U.S. military package (wrongly but popularly believed to be destined for the SPLM/A) designated for the Ugandan military. Since that withdrawal from Congo, it appears that U.S. military assistance to Uganda has been recommenced.[1481]
U.S at the U.N.
The U.S., as noted, was opposed to the Canadian effort to put Sudan and the East African regional Intergovernmental Authority on Development (IGAD) talks on the agenda for the U.N. Security Council to consider in 2000, when Canada had the presidency of the Security Council and could set the agenda. The U.S. did not want to open up discussion of its August 1998 bombing of the Khartoum pharmaceutical plant. Ultimately, the only action involving Sudan and the Security Council for 2000 was a vote at the General Assembly in September 2000 against seating Sudan on the Security Council. The U.S. used all its diplomatic muscle to achieve this unprecedented result.[1482]
After September 11, 2001, and Sudanese cooperation on terrorism, however, the U.S. did not oppose the motion to lift the minor Security Council sanctions on Sudan imposed in 1996 related to the Sudanese failure to extradite to Ethiopia suspects in the Mubarak assassination attempt.[1483]
U.S. Congress Gets in on the Act
In 1998 Congress overwhelmingly passed the International Religious Freedom Bill. The bill resulted in the creation of a new office in the State Department to monitor and issue yearly reports on the state of international religious freedom, and in the establishment of a U.S. Commission for International Religious Freedom (U.S. CIRF) as a watchdog over that office.
The U.S. CIRF was to suggest countries that the U.S. might consider taking action against on account of their violations of religious freedom. Most of the commissioners initially appointed to the U.S. CIRF by President Clinton were conservative rather than liberal in outlook, reflecting the outlook of the bill's sponsors.[1484]
In September 1999 the State Department designated Sudan as a "country of particular concern" under the legislation although it did not impose any sanctions on Sudan additional to the broad ones in effect. Meanwhile, Sudan was and remains one of the top priorities of the U.S. CIRF. Its first hearing was on Sudan, on February 15, 2000.[1485] In its first, May 2000, report the U.S. CIRF found "that the government of Sudan is the world's most violent abuser of the right to freedom of religion and belief."[1486]
In June 1999, in its first specific reference to Sudan in years, the U.S. Congress adopted a "sense of the Congress" resolution condemning the Sudanese government for a wide range of human rights abuses.[1487] Later in 1999, Congress passed an appropriations bill containing provision for food aid to the rebel SPLA, at the discretion of the U.S. president.[1488] Several U.S.-based NGOs operating in Sudan, as well as Human Rights Watch, lobbied against the U.S. giving food aid to the SPLA, citing SPLA abuses, concern about NGO staff safety, and the need to preserve NGO neutrality.[1489] The SPLA denounced these NGOs.[1490] On February 10, 2000, President Clinton wrote a letter to the U.S. Congress as required by the legislation, informing that "at this time" he would not exercise his discretion to allow U.S. food aid to the SPLA.[1491]
There were only a handful of Congressmen interested in Sudan in the mid-1990s: Congressmen Donald Payne (D-NJ), Tony Hall (D-OH), and Congressman Frank Wolf (R-VA) stood out in their efforts to rouse Congress to the plight of the Sudanese. In 1999, a few more members of the U.S. Congress began to devote time and interest to Sudan, in response to pressure from U.S. conservatives and religious groups who believed that the Muslims of Sudan were persecuting the minority Christians of Sudan in a "genocidal war" and were enslaving southern Christians in the course of the war.[1492] One was newly-elected Congressman Tom Tancredo (R-CO), in whose district schoolteacher Barbara Vogel was already raising money for slave "redemptions." Another was freshman Senator Sam Brownback (R-KS), who was one of the most outspoken senators on Sudan.
An important supporter of peace in Sudan was Senator Bill Frist (R-TN), who had gone to southern Sudan with World Vision in his capacity as a medical doctor during the 1998 famine. He was appointed Senate Majority Leader in 2002 and took another trip in his medical capacity to southern Sudan in 2003, discomforting U.S. officials concerned about his safety in the south despite the ceasefire.[1493] He was said to lead Senate opinion on Sudan.
A lobbying group that focused on Congress, and was frustrated by the U.S. State Department, was the Boston-based American Anti-Slavery Group (AASG), a group created in 1995. It began its work on Sudan that year by focusing attention on why U.S. African-American Congressmen and other leaders did not take a position on "black African slavery" in Sudan.[1494]
Its work grew as the phenomenon of slave "redemption" of "Christian" southern Sudanese slaves from "Arab Muslim" raiders/masters grew. A few Christian NGOs- not including those who had relief and medical operations on the ground in Sudan-had started to buy back slaves in Sudan as a means of freeing them. In lightning trips conducted under great secrecy to northern Bahr El Ghazal in Sudan, the "slaves" were presented to first-time visitors to Africa (who spoke no Arabic or local languages) by an "Arab" "go-between" who had allegedly gathered them from their owners in western Sudan and walked them south into SPLA territory.[1495]
The Sudanese churches recognized the problem of slavery but did not endorse these buy-backs.[1496] Many operational NGOs took a similar position.[1497] A scandal regarding the misuse of the redemption funds and bogus "slaves" surfaced, in which even some Christians who had formerly participated in the "redemptions" renounced the practice.[1498]
The redemption campaign in its simplicity proved emotionally appealing. Steady campaigning on the slavery issue at the grass roots, fund-raising through appeals to "buy-back" slaves, and spreading the word to African-American churches had an effect, as did the removal by illness of the Black Muslims' Louis Farrakhan from the debate. Farrakhan, who commanded a following among African-Americans in the U.S., had visited Sudan and was a defender of the Islamic government of Sudan even after meeting with southern Sudanese who appealed to him as Africans to condemn the Sudanese government's persecution of them.
The U.S. African American community was split on the Sudan issue until Farrakhan faded out on the issue in the late 1990s. U.S. Rep. Donald Payne (D-NJ), who had been a vocal supporter of military aid to the SPLA long before Sudan became an issue of religious rights, was key in the effort to bring the Congressional Black Caucus (CBC) along in a coalition with the white religious conservatives on Sudan.
There was thus ongoing constituent pressure on Congress to "do something" on Sudan. But Sudan was already subjected to a stringent sanctions regime, with only one visible hole, that of gum Arabic; Sudan was the source of more than 90 percent of this product, used to suspend particles in soda pop cans, in the world.[1499]
This conservative religious/Black Caucus coalition, and another including operational NGOs responsible for programs regularly caring for hundreds of thousands of southern Sudanese in need, more established churches, and human rights groups (such as those groups opposing food aid to the SPLA), were both seeking ways to rachet up U.S. pressure on Sudan. At the same time, the Europeans and other U.S. allies were going in exactly the opposite direction, that of normalizing their relations with Sudan, greased by the participation of their companies in the growing oil business in Sudan and despite the efforts of European NGOs operational in Sudan.
Campaign Against Oil Investment
Pressure to Sell Off Talisman Shares
U.S. pressure groups of many persuations were concerned that, although U.S. companies were already barred from doing business in Sudan, non-U.S. oil companies were undercutting the economic boycott. These included Talisman, a company based in neighboring Canada, where Canadian activists had been mounting a campaign to force the Canadian government to rein in Talisman. U.S. activists kept up continuous and unforgiving pressure on Talisman. But it had not been enough.
Canadian NGOs had campaigned against Talisman and its predecessor Arakis since at least 1995, urging them to pull out of Sudan on account of the gross human rights abuses committed by the Sudanese government. They also pressured Talisman shareholders to sell off their Talisman shares in protest, targeting large, institutional Canadian shareholders. Probably as a result of this pressure, Vancouver's Citizens Bank of Canada sold off its undisclosed Talisman holdings.[1500]
The faculty and students of the University of Toronto and York University, Ontario, lobbied to rid their pension and endowments funds of Talisman stock as well.[1501] The head of the Ontario Teachers Federation, Barbara Sargent, announced that the federation would lobby its pension fund board to divest its Canadian $184 million worth of Talisman stock if it could corroborate evidence of violations in Sudan where Talisman operates. The teachers welcomed the Canadian government's human rights fact-finding mission to Sudan in 1999.[1502] Their Ontariopension fund board, in contrast, said that it had no plan to sell its 4.5 million Talisman shares (3.2 percent of Talisman's publicly traded shares). It said it bought Talisman shares because it buys positions in all stocks included in the Toronto Stock Exchange's index of 300 leading stocks.[1503] As of December 2000, the Ontario teachers' pension fund held a diminished number of Talisman shares, 3.8 million, or 2.7 percent of Talisman's outstanding stock. In 2002 it still held a substantial block of Talisman stock, despite the unions' displeasure.[1504]
U.S. groups joined the campaign because Talisman's shareholders included a large roster of U.S.-based pension funds and institutional investors. Smith College Professor of English Eric Reeves ran a prolific one-man email campaign for human rights in Sudan, focusing on the oil industry and divestment of Talisman shares, then the capital market sanctions amendment. Activists sent letters to mutual fund companies and pension funds that held Talisman shares, urging them to sell off their Talisman holdings.[1505] AASG said the funds included Fidelity Investments, Vanguard Group, State Street, the State of New Jersey Division of Investment, the California Public Employees Retirement Plan (CALpers), the New York State Common Retirement Fund, and the State of Wisconsin Investment Board.[1506] Other groups were targeted for divestment as well, including Capital Management Group, the Teacher Retirement System of Texas,[1507] and TIAA-CREF, the world's largest private pension fund. As of May 1, 2001, more than ten major institutional shareholders had divested more than 3 million Talisman Energy shares, with a value of more than U.S. $ 100 million.[1508]
The activists lobbied the manager of New York City's U.S. $ 90 billion pension fund, Alan Hevesi, who was reported in October 1999 to have hopes of convincing Talisman to threaten a withdrawal from Sudan as a means of pushing Sudan to end slavery and the civil war. CEO Buckee replied that he welcomed discussions with the funds but believed Talisman was doing more for the Sudanese people by keeping cordial relations with the Sudanese government and asking questions about government policies.[1509] The Council of the City of New York, urged by Alan Hevesi, held a hearing to examine the city's involvement with corporations doing business in Sudan.[1510] New York City finally sold all its Talisman shares in the fall of 2000 and did not publicly dispute the characterization of the sale as a divestment.[1511]
Several large investors targeted by the campaign decided to sell out after taking months of hammering. In December 1999, TIAA-CREF said that it had sold its 260,000 Talisman shares on the grounds that the time was right to sell and move on.[1512] Activists applauded the sale and expressed skepticism about the financial explanation for it.[1513]
The Teacher Retirement System of Texas and CALpers sold off their Talisman shares after being lobbied by Sudan activists.[1514] The New Jersey Pension Fund sold its 780,000 shares of Talisman in early 2000, though it claimed that the sale was a business move, not a moral statement.[1515] The Vanguard Group also sold off all its shares in mid-2000 after coming under divestment pressure.[1516] Smith College issued a preemptive divestment statement, pledging that it would not acquire any shares of Talisman while Talisman remained a part of GNPOC.[1517]
Manning and Napier Advisors sold off its 1 million shares but also denied this was a divestment, although its public comments made it clear that the company knew about the divestment campaign.[1518]
In a response to the divestment campaign, Talisman announced that it would be buying back up to $ 300 million worth of its own shares in 2000, in an effort to keep the per share price up.[1519] On February 28, 2001, Talisman renewed its offer to buy back up to 5 percent of its outstanding common stock for the year starting March 5, 2001.[1520]
Although the stringent prohibitions on Americans doing business with Sudan remained in place under a Clinton administration executive order, the Khartoum government was hopeful that from January 2001 it would receive better treatment under the administration of George W. Bush. President El Bashir went so far as to invite "U.S. oil companies to participate in oil exploration and production."[1521] President Bush nevertheless renewed the stringent sanctions in November 2001, and again in November 2002.
The Campaign for Capital Market Sanctions
A novel human rights strategy emerged, which appeared to be the brainchild of Roger W. Robinson, Jr., chairman of the William J. Casey Institute, a conservative think-tank. Robinson was previously in President Reagan's National Security Council.[1522] The strategy was capital market sanctions: the idea that foreign companies-in the oil business in Sudan-should not be allowed to raise money in U.S. capital markets. The reasoning was that Sudan had been designated by the State Department as a terrorist-sponsoring gross human rights abuser, U.S. companies were subject to stiff sanctions barring them from doing business with Sudan, and, because the Sudanese government claimed the subsoil rights, anyone in the oil exploration, development, or production business in Sudan would therefore be engaged in business with the government.
The impact of U.S. economic sanctions on Sudan were defeated by foreign companies which benefited from access to U.S. capital markets as they dodged U.S. sanctions. The efforts to convince the U.S. president, the Treasury Department, and the Securities and Exchange Commission to bar these foreign companies from U.S. capital markets were ultimately unsuccessful in this first test case, but in the process the campaigners brought enormous pressure on the oil companies and financial community, and not least of all on the Sudanese government.
More than 200 U.S. religious and civic leaders signed a petition to U.S. President Bill Clinton in December 1999, urging that he take a visible, personal stance on the "genocide" in Sudan and specifically that he construe or amend the executive order imposing sanctions on Sudan to bar the CNPC from access to U.S. capital markets as long as it continued to be a 40 percent partner in GNPOC.[1523] The president declined to impose capital market sanctions on CNPC or anyone, as did his successor President Bush.
The Department of the Treasury, in response to inquiries from the Senate Foreign Relations Committee, responded on September 8, 1999 and April 13, 2000 that the comprehensive sanctions program against the government of Sudan did not apply to Talisman as a Canadian corporation trading on the N.Y. Stock Exchange. The sanctions would, however, prohibit U.S. persons from contracting to underwrite or purchase shares in a new public offering by Talisman-if the proceeds were for use to support a project in Sudan.[1524] Although this would prevent Talisman or any other foreign company from raising money in the U.S. for a Sudan project, it would not deter Talisman from raising money in the U.S. for its other projects. Talisman argued that its Sudan project comprised only 10 percent of its assets.
In mid-May, 2001, the SEC the responded in a manner more favorable to the activists. It said, in answer to a letter from Rep. Frank Wolf, that it would require greater disclosure from foreign firms in their mandatory filings pertaining to shares listed and traded in U.S. capital markets.[1525] The SEC held, "The fact that a foreign company is doing material business with a country, government, or entity on [U.S. Office of Foreign Assets Control]'s sanctions list is, in the SEC staff's view, substantially likely to be significant to a reasonable investor's decision about whether to invest in that company."[1526]
Many hailed this as a "victory" for human rights groups.[1527] Rep. Frank Wolf's charges that PetroChina and Talisman may have failed to disclose material information in reports filed with the SEC was referred to the SEC's division of enforcement.
Failing to provoke executive agencies into decisive action, however, the campaigners sought U.S. legislation to prohibit foreign companies engaged in the oil business in Sudan from listing or trading their shares on any U.S. stock exchange.[1528] In June 2001, the U.S. House of Representatives passed the Sudan Peace Act together with a last-minute amendment offered by Rep. Spencer Bachus (R-AL) regarding capital market sanctions.[1529] The Bush administration indicated that it opposed capital market sanctions, but President Bush did not overtly threaten to veto the bill.[1530] The State Department said the administration "supports generally" the aims of the pending Sudan Peace Act, but "some of its amendments" could infringe on the prerogatives of the SEC.[1531] Federal Reserve Chairman Alan Greenspan opposed the proposed capital market sanctions.[1532] International response to the U.S. barring companies working in Sudan from the U.S. capital markets was predictably negative as well.[1533] The Senate bill that passed did not contain the capital market sanctions provision,[1534] despite lobbying efforts.
A Talisman spokesman said that his lawyers believed the legislation applied to companies actually operating in Sudan and not parent corporations like Talisman. Talisman owns a Dutch subsidiary, Talisman (Greater Nile) B.V., which owned 25 percent of GNPOC, which operates the oilfields.[1535] The oil company press release maintained that its presence in Sudan was positive and Talisman remained "a strong advocate for human rights."[1536]
Later in the month of June 2001, however, Talisman CEO Jim Buckee said that if it were a choice between loosing its access to the NYSE and holding on to its Sudan project, Talisman would choose the stock exchange.[1537] The Sudanese government hastened to add that if Talisman pulled out of Sudan, there were other "reputable companies" that would take over.[1538]
While the capital market sanctioners were still pressuring the Senate to support the Sudan Peace Act and its capital market amendment, the September 11 attack on the World Trade Towers and the Pentagon intervened. At the request of the U.S. president, this and other contentious legislation was postponed.
The capital market sanctions issue was shortly revived by activists, outraged that an outgoing Republican Senator, Phil Graham of Texas, imposed a hold on Senate consideration of the capital market sanctions. Then the National Foreign Trade Council, representing more than 500 U.S. companies, weighed in with what were the underlying concerns of the financial and manufacturing communities. It considered that Sudan was the "stalking horse for China," and vowed to continue lobbying against the Sudan Peace Act.[1539]
Avoiding raising more dust on the capital market sanctions issue, however, Talisman in January 2002 issued shares through the Toronto Stock Exchange rather than the NYSE.[1540]
Talisman Sued by Displaced under the Alien Tort Claims Act in New York
Although Talisman had a temporary reprieve when the Sudan Peace Act seemed to be relegated to the back burner, Talisman's troubles were not at an end. On November 8, 2001, the Presbyterian Church of Sudan and individuals displaced from the oilfields brought a class action lawsuit in U.S. federal district court for the Southern District of New York against Talisman and the Sudanese government. [1541]
The amended complaint alleged that "Defendants have collaborated in a joint strategy to deploy military forces in a brutal ethnic cleansing campaign against a civilian population based on their ethnicity and/or religion for the purpose of enhancing Defendants' ability to explore and extract oil from areas of southern Sudan by creating a cordon sanitaire surrounding the oil concessions located there."[1542] Talisman's motion to dismiss was denied and the suit is pending as of the writing of this report.[1543]
U.S. Aid to Sudanese Rebel Groups
The most controversial position of the U.S. CIRF and the conservative religious lobby on Sudan, for those not in the financial community, was that the U.S. should provide assistance to the rebel SPLA. The U.S. CIRF recommendation of aid to the SPLA, made in 2000, was objected to by one of the commissioners, Dr. Laila Al-Marayati.[1544] In its 2001 report the U.S. CIRF scaled back the recommendation (in line with congressional changes) to recommend support for the National Democratic Alliance (NDA), to which it referred as "the political opposition in Sudan." This description is misleading. The NDA comprises military as well as political opposition. The SPLA is by far its largest member.[1545]
Initially the aid was sought in the form of an amendment to the appropriations bill for the fiscal year 2000, which began October 1, 1999. The amendment, sponsored in the Senate by first-term U.S. Sen. Sam Brownback and in the House by Reps. Donald Payne, Frank Wolf, Tom Tancredo, and others, would at the discretion of the president supply food aid to the SPLA.
The move to give food aid to the SPLA was met by the resistance of most of the American operational NGOs involved in relief activities in northern and southern Sudan. These American organizations were concerned that the U.S. supplying food aid to rebels would become merged-in the mind of the Khartoum government-with their own food-supplying activities to needy civilians, and they might become military targets. They wanted the appearance of neutrality in the delivery of humanitarian assistance to be preserved, not compromised. President Clinton ultimately decided not to supply food aid to the SPLA.[1546]
Another U.S. $10 million dollars for the NDA-for "nonlethal nonfood" assistance-was inserted into the next appropriations bill, for fiscal year 2001 (October 2000-September 2001). No executive action was taken on that, however, until after the U.S. presidential elections were held in November 2000. Apparently the outgoing Clinton administration through the State Department sent out requests for bids for a U.S. $ 3 million project designed to provide training in negotiations and office support for the NDA, for "building its capacity to participate in the peace process."[1547] The U.S. CIRF supported this project.[1548]
News of the contract, on which only DynCorp[1549] of Reston, Virginia, bid, was not publicly disseminated until a story appeared in the Washington Post on May 25, 2001, about this U.S. $ 3 million contract for an avowed opposition group.[1550] The new secretary of state, Colin Powell, hastened to explain that this contract would not extend the conflict and would boost the NDA's capacity to negotiate politically;[1551] a State Department officer said that it did not include vehicles or communications equipment,[1552] two of several dual-use objects mentioned in the Congressional report language.[1553]
The reasons for supporting the NDA with U.S. $ 3 million were confusing. The training was for capacity-building so that the NDA could participate in the peace process. Northern politicians, who are the principal group of civilians in the NDA, are already skilled political negotiators, dating from their participation in multiparty politics in Sudan before the military coup of 1989 which lead to the banning of all political parties and to their exile. It seems that the training was intended for SPLM/A negotiators, whose negotiating skills are less developed.
Another puzzling aspect of the U.S. $ 3 million was that it was intended to improve NDA capacity for participation in peace negotiations-when the NDA is not a party to the IGAD peace negotiations, the only peace process that the U.S. wholeheartedly backs.
It appears that the U.S. completely ignored one aspect of the U.S. CIRF recommendations, however: their qualification that "aid should not be given to any opposition group unless it is making substantial and verifiable efforts to adhere to international human rights norms."[1554]
DynCorp began to administer the contract in 2002, and its official admitted that it was providing a Washington, D.C., office for the NDA and paying its staff, all pursuant to State Department approval.[1555] One staff member of the NDA office was the person who had long been the SPLA representative in Washington. DynCorp maintained that the contract was for only $ 2.8 million and that it was also refurbishing and supporting an NDA office in Asmara, Eritrea. DynCorp insisted that its work did not involve any military aid at all, and that it had retained a U.S. human rights professor especially to work on its Sudan project.[1556]
Meanwhile, much of the Economic Support Fund funding for fiscal year 2001 (U.S. $ 10 million) and for fiscal year 2002 (October 1, 2001-September 30, 2002, another $ 10 million) was going not to the NDA as permitted in the authorizing language, but to support the high-level peace effort conducted by Senator Danforth, under the "not withstanding any other provision of law" clause of the legislation. Some of the funds were going to pay for transport and lodging and per diems for the SPLM/A delegates to the talks, however.
U.S. Special Envoy for Humanitarian Assistance to Sudan: May 2001
The new administration, which took office in January 2001, early on expressed its interest in resolving the Sudan conflict and bringing an end to the suffering of its peoples. On March 6, 2001, the new Secretary of State, Colin Powell, testified at a House International Relations Committee hearing, "There is perhaps no greater tragedy on the face of the Earth today than the tragedy that is unfolding in the Sudan."[1557]
While Colin Powell was determined to cut back substantially on the proliferation of special envoys and return diplomacy to the State Department, Sudan was an exception. The term of appointment had lapsed for former U.S. Representative Harry Johnston, President Clinton's special envoy for humanitarian affairs, peace, and human rights to Sudan. Recognizing, however, the serious nature of the permanent humanitarian emergency in Sudan, President George W. Bush appointed his U.S. AID director, Andrew Natsios, as special envoy for humanitarian assistance to Sudan in May 2001, announcing:
Such crimes [as a Russian pogrom in 1903] are being committed today by the government of Sudan, which is waging war against that country's traditionalist and Christian peoples. Some 2 million Sudanese have lost their lives; 4 million more have lost their homes. Hospitals, schools, churches and international relief stations have often been bombed by government warplanes over the 18 years of Sudan's civil war. The government claims to have halted air attacks. But they continue. Women and children have been abducted and sold into slavery. UNICEF estimates that some 12,000 to 15,000 people are now held in bondage in Sudan.
. . . Sudan is a disaster area for human rights. The right of conscience has been singled out for special abuse by the Sudanese authorities. Aid agencies report that food assistance is sometimes distributed only to those willing to undergo conversion to Islam.
We must turn the eyes of the world upon the atrocities in the Sudan. Today, I have appointed a special humanitarian coordinator, USAID Administrator Andrew Natsios. He will provide the leadership necessary to ensure that our aid goes to the needy, without manipulation by those ravaging that troubled land. This is the first step. More will follow. Our actions begin today-and my administration will continue to speak and act for as long as the persecution and atrocities in the Sudan last.[1558]
Andrew Natsios was no stranger to Sudan. He had served in U.S. AID before, and was later director of the American nongovernmental relief agency World Vision. He had visited World Vision's projects in rebel-held areas of southern Sudan. (which had been substantially discontinued in March 2000 because of the Memorandum of Understanding dispute with the SPLM/A). Roger Winter, who had just been named as one of the top executives at U.S. AID, quickly became a key member of the Sudan team inside AID.
The AID team, led by Natsios, visited Sudan, north and south, in July 2001 and Natsios promised, and delivered, emergency relief to the government side for the drought and displaced persons in Darfur-uprooted as a result of SPLA capture of a town in western Bahr El Ghazal.[1559] This was the first delivery of emergency relief supplies by the U.S. government to the Sudanese government side of the conflict in many years. The AID team expanded as did the AID budget for Sudan, and its members became involved in the Danforth initiative and the IGAD peace process. It played a major role in successfully negotiating with the Sudanese government for humanitarian access to the Nuba Mountains, Southern Blue Nile, and most of southern Sudan, which was achieved after much effort.
U.S. Special Envoy for Peace in Sudan: September 2001
President George W. Bush appointed former Sen. John Danforth as his special envoy for peace in Sudan on September 6, 2001. Announcing the appointment in the Rose Garden of the White House, President Bush said:
For nearly two decades, the government of Sudan has waged a brutal and shameful war against its own people. And this isn't right, and this must stop. The government has targeted civilians for violence and terror. It permits and encourages slavery. And the responsibility to end the war is on their shoulders. They must now seek the peace, and we want to help.[1560]
Danforth's mission was to report to the president as to whether the two main parties to Sudan's nineteen-year civil war-the Sudanese government and the SPLM/A-were ready for peace negotiations. If he found that they were, then the U.S. would undertake an intensive diplomatic effort to assist in the negotiating process. If they were not serious about peace, then the U.S. would not substantially set up its engagement in Sudan. Senator Danforth and his team of U.S. State Department and U.S. AID officials and others especially appointed to serve on this task force, including Amb. (Ret.) Robert Oakley, visited Sudan and the region in waves from October 2001 to January 2002; several higher-level officials went more than once.
Senator Danforth approached his mission by proposing four tests that the two main parties to the conflict-the Sudanese government and the rebel SPLM/A-must meet in order to satisfy the U.S. that they were committed to the search for peace: (1) The signing of a ceasefire agreement in the Nuba Mountains, allowing humanitarian access, to be monitored by a team of fifteen to twenty-five international personnel; (2) An agreement by both sides not to attack or target civilians or civilian objects in the war in the south, also to be monitored, by a verification mission of fifteen international professional staff; (3) The appointment of a commission consisting of eminent persons from many countries which would investigate and make recommendations for practical solutions to the problem of slavery in Sudan; and (4) respect for "zones of tranquility" in the conflict areas, enabling medical humanitarian agencies to carry out polio immunizations and campaigns against bovine rinderpest and guinea worm.[1561]
U.S. Policy in Sudan, 2002
The forward momentum on Sudan was accelerated when overall U.S. foreign policy after September 11, 2001, became focused on the response to the terrorists who attacked the U.S., believed to be part of an international conspiracy headed by Osama bin Laden and his Al Qaeda movement. The U.S. called on all countries to cooperate. The Sudanese government and individual Islamists in the Sudanese government had hosted and done considerable business with Osama bin Laden when he lived and invested in Sudan between 1990 and 1996. The Sudanese government asked him to leave in 1996 (he moved to Afghanistan), as part of a campaign since 1993 to remove itself from the U.S. list of countries supporting terrorism. Sudan remained eager to improve its poor relations with the U.S. government, and perhaps feared a repeat of the cruise missile bombings of Khartoum (August 1998). After September 11 the Sudanese government immediately and publicly announced its cooperation with the U.S. on terrorism.
Senator Danforth's work as special envoy and the imposition of the four tests, initially received with skepticism, produced some positive results for the promotion of human rights and the prospects for peace in Sudan. There was early agreement on a slavery/abduction investigation to be conducted by an international commission of eminent persons. The Nuba Mountains ceasefire agreement was signed by both parties January 19, 2002, in Switzerland. Progress was also made on negotiating "zones of tranquility" access for three medical programs.
The agreement to cease attacking civilians and civilian structures, as it was expanded, was the most difficult to negotiate. A February 20,2002, attack by government helicopters on an emergency food delivery location in the village of Bieh, not far from the Ryer/Thar Jath drilling site in the Lundin Block 5A area, resulted in a death toll of at least seventeen [later confirmed to be twenty-four] civilians.
This was the straw that broke the camel's back. The U.S. State Department demanded "an explanation of how one part of the government can negotiate with the United States an agreement to end attacks against civilians while another part of the government is deliberately targeting civilians."[1562] It suspended all negotiations with Sudan on the war until the explanation was forthcoming.[1563] The Sudanese government protested the U.S. suspension of peace talks and denied that it deliberately targeted civilians. According to Senator Danforth, the government had accepted an international mechanism to verify protection of civilians (part of the agreement not to attack civilians) just one week before the Bieh bombing. "This is part of a pattern of repeated attacks. It is also part of a pattern whereby the government says one thing and does another,"[1564] he noted.
The Sudanese government finally signed the "no attacks on civilians or civilian objects" agreement proposed by Danforth, on March 10, 2002. The SPLA signed on March 25.[1565] Oil remained central to the parties' concern about this "no-targeting civilians" agreement. The Sudanese government sought language stating that oil installations were "civilian objects" and the SPLA sought the reverse language. The agreement was silent on this point, leaving it to the monitors to decide on a case-by-case basis, should there be any other attacks on oil installations.
Senator John Danforth's report to President Bush was made public on May 10, 2002. It summarized the state of compliance by the parties with the four agreements and concluded that the parties had shown sufficient commitment to finding a negotiated end to the war that the U.S. should continue its engagement. The report concluded that there were massive human rights abuses being committed in Sudan, and that its judicial system was completely unable to provide any redress.
Senator Danforth also put forth his opinion that "the fair allocation of oil resources could be the key to working out broader political issues if it were possible to find a monetary formula for sharing oil revenue between the central government and the people of the south" in whose territory the oil is found. He urged the U.S. government to dedicate resources and staff to "develop our best thinking on how the distribution of oil revenues might further the cause of peace in Sudan."[1566]
The peace talks, hosted by Kenya under the auspices of IGAD, the East African and Horn intergovernmental authority, proceeded with noticeable momentum in June and July 2002. These talks under IGAD had intermittently engaged the parties' attention since 1994 when the government and the SPLM/A reached an initial breakthrough in the signing of a Declaration of Principles (DOP).[1567]
Under the Clinton administration the U.S., Norway, Canada, and several other countries formed an IGAD Partners' Forum group (IPF) designed to provide stepped-updiplomatic and financial support to the IGAD peace process.[1568] In 2002 the international actors coordinated their pressure on Sudan, lead by an informal "Troika" composed of the U.S., the U.K., and Norway, with the Kenyan government playing a leading role and providing the chief mediator.
This team succeeded in achieving the signature of the Sudanese government and the SPLM/A on a ground-breaking agreement on July 20, 2002, addressing the key DOP issues on self-determination and the relationship between the state and religion. The agreement was that a self-determination referendum would be conducted to determine southern choice (between unity or independence)-six and a half years after the signing of the final peace agreement. As to religion, shari'a was confirmed as the religion and source of laws in the northern two-thirds of the country, and the south was free to be a secular or other state as it desired during the interim six and a half year period, when a southern regional government would have substantial autonomy within a unified Sudan.
The mediators also managed to reconvene and push forward the second round of talks in October 2002, although the government had walked out of the talks in September on the grounds that the SPLA had captured the government garrison town of Torit, in Eastern Equatoria. As of the writing of this report, the parties have come to verbal agreement on security (military) arrangements but other items remain. An agreement on sharing the oil and other revenue has not been concluded, however, although the parties are said to have agreed on a formula and most details save for the exact percentage each will receive under that formula. The World Bank provided technical expertise to the parties.
The U.S. and its diplomatic allies have shown unprecedented willingness to bring enormous pressure to bear on the parties. Short of full international engagement in the Sudan peace process, however, the parties would likely continue to fight indefinitely. Congressional attention to Sudan also continued, responding to the peace process. In October 2002, the original Sudan Peace Act providing for capital market sanctions on companies doing business in Sudan was jettisoned and a compromise reached between key legislators on the sanctions. The bill was refashioned to put pressure on the Sudanese government to continue participating in the peace process (at the time, it had walked out of the talks). If within six months of the enactment of the bill (i.e., April 21, 2003) the president certified that the Sudanese government (1) was acting in "bad faith," or (2) had "unreasonably interfered with humanitarian assistance efforts," then four sanctions would be enacted, including taking "all necessary and appropriate steps" to ensure that the Sudanese government could not use oil revenues for the purchase of military equipment.[1569] If the SPLM/A was in bad faith and negotiations failed, then the sanctions would not apply to the Sudanese government. This bill was signed into law by President Bush on October 21, 2002.[1570]
The bill also provided that the rebels would receive one hundred million dollars, regardless of the Sudanese government's compliance, over a three-year period. The ability or willingness of the U.S. government to provide these funds, if the peace talks collapse, may be called into question in the aftermath of the U.S. military engagement in Iraq.
EUROPEAN UNION
The European Union (E.U.) has been engaged in political dialogue with the government of Sudan, beginning with a meeting in November 1999. That dialogue was intended to lead to normalization of relations. Normalization included reestablishing development aid programs to Sudan, previously suspended because of the war-although in 1999 the war had not abated and has even escalated in the Muglad Basin oil region. The E.U. target date of year-end 2002 for making the normalization decision, however, was deferred in order for the E.U. to coordinate its efforts with the rest of the international community that was deeply involved in the IGAD peace negotiations.
The political dialogue with the Sudanese government was conducted through regular meetings between E.U. ambassadors in Khartoum and government officials. An African-Caribbean-Pacific-European Union (ACP-E.U.) Joint Parliamentary Assembly mission to Sudan in June-July 2001, however, reported disappointment with the government's lack of cooperation in the dialogue since the end of 2000. It noted several areas of human rights concerns that were discussed but not addressed by the government, such as detention without charges, restrictions on press freedom, abduction and forced labor, and bombing. Notably, the government declared a state of emergency and suspended the National Assembly in December 1999, shortly after the commencement of the E.U. talks. The state of emergency was extended for several years [and continues to date of the writing of this report]. The National Assembly was recalled after the president's group, headed by First Vice President Osman Ali Taha (a key decision-maker in the peace talks), effectively removed from power their former mentor Dr. Hassan al Turabi.
The E.U. economic assistance program called "humanitarian plus" of € 15 million was the subject of discussions beginning in 1999 and was to be implemented in 2001, focusing on food security, health, water, and education. This activity accompanied a surge in European commercial and investment interest in Sudan, which was never barred by any E.U. or individual country sanctions, except an E.U. ban on arms trade with Sudan.
The E.U. took the laboring oar in drafting human rights resolutions at the General Assembly and at the U.N. Commission on Human Rights when the U.S. dropped this effort in 1998 following the Al Shifa bombing. These E.U.-drafted resolutions, however, did not mirror the views of the successive special rapporteurs on human rights in Sudan appointed by the U.N. Commission on Human Rights. The resolutions were progressively watered down but the rapporteurs found very little improvement in human rights.
E.U.-Sudan Political Dialogue
The E.U. suspended development aid to the Sudanese government in 1990 because of its concern about human rights, democracy, rule of law, and peace talks. There were no E.U. restrictions on its members' investments in the Sudan oil industry, although an arms embargo was put in place. The E.U. funded the humanitarian efforts of NGOs in Sudan through the European Commission's Humanitarian Aid Office (ECHO).
By 2001, the ECHO humanitarian financing for Sudan had amounted to some € 160 million since 1994, averaging about € 23 million a year, slightly half of which was spent in the rebel-controlled areas of the South, mostly to non-SPLM/A controlled areas after February 2000, when the E.U. suspended aid to SPLM/A areas in response to the SPLM/A position on the Memorandum of Understanding issue.[1571] This meant that NGOs in receipt of E.U. funds were barred from working in SPLM/A-controlled areas, a policy the E.U. gradually moved away from as the peace talks progressed.
The E.U.'s political dialogue with the Sudanese government from November 1999 addressed five particular issues: human rights; democracy, the rule of law and good governance; the peace process; terrorism; and cooperation between the Sudan and neighboring countries. E.U. representatives said the November 1999 meeting was useful and had produced "very positive results."[1572]
Significant progress was made in monthly meetings until the end of 2000, according to the report of the ACP-E.U. delegation that visited in June-July 2001. "Since then [December 2000] there was a discernible lessening of enthusiasm and engagement on the Sudanese side, which the EU Member States found most discouraging."[1573] This coincided with the continuation of the state of emergency and the split within the National Congress Party, with Dr. Turabi forming a new, separate Islamist political party; suspension of the National Assembly; the separate arrests of opposition National Democratic Alliance members and Dr. Turabi; and the time when the special rapporteur of the U.N. Commission on Human Rights noted deterioration in the movement toward human rights and democracy.
An ACP-E.U. delegation noted in its September 2001 report that "a major issue was that of the use of oil revenue. . . . There seems to be a complete lack of transparency in this area. . . . At the EU-Sudan political dialogue meeting on 15 May, the Minister of Justice promised to provide figures to show how government oil revenues were being used."[1574] Otherwise, "Most time had been spent discussing human rights."[1575]
By the time of this mid-2000 visit, the European Commission had begun implementing a new program, "Humanitarian Plus," budgeted at € 15 million, financed in the form of a grant. This aid was to focus on re-establishing self-reliance in the sectors of food security, basic health, water, and sanitation-considered medium-term operations-to strengthen the delivery of basic services at the local community level.[1576] It was not being implemented in the SPLM/A areas because the SPLM/A insisted on control of the programming.[1577]
In a November 2001 resolution on Sudan, the ACP-E.U. Joint Parliamentary Assembly stated that it was "aware of the currently destabilizing effects of oil production but also of its extremely valuable potential contribution to the country's economic development." It also stated, on the oil issue, that the assembly:
15. Believes that oil production has increased the stakes in the civil war;
16. Calls on the GoS [government of Sudan] to publish a clear statement of all its revenues and expenditures which would show the purposes to which oil money was being put;
17. Believes that the GoS would improve its own position, and increase the chances of a durable peace within the whole country, were it to ensure that oil revenues were used to a greater extent to alleviate hardship and strengthen the economy;
18. Feels it important that those oil companies operating in the Sudan should increase their employment of people from the oilfields region and expand their involvement in providing health services and basic education, as well as developing in-house training programs . . . .[1578]
Following the urging of the ACP-E.U. delegation, the European Union dispatched representatives of the E.U. "troika" (the governments of the current, outgoing, and incoming E.U. presidents) to visit Sudan in December 2001.[1579] This marked the close of the second year of political dialogue. The troika, led by Ambassador Frank De Coninck, Director General in the Foreign Ministry of Belgium, representing the E.U. Presidency, met on December 8 and 9, 2001, in Khartoum with Under-Secretary of the Ministry of Foreign Affairs Dr. Mutrif Siddiq. In a joint communiqué, they announced that the management unit for the Humanitarian Plus programme would start its activities in Khartoum in January 2002. They said that Sudan and the E.U. would strive for progressive normalization of relations[1580] under article 8 of the Cotonou Agreement that regulates relations between the E.U. and ACP states, referring to political dialogue.[1581] The E.U. termed it "possible resumption of development assistance," contingent on reassessment of the progress in political dialogue at the end of 2002.
Within the framework of the Cotonou agreement, two grant allocations were envisaged for Sudan: € 135 million for the next five years (poverty reduction) and € 20 million potentially available for emergency assitance, debt relief, and mitigation of unstable export earnings. The amounts were indicative, not entitlements, and might be revised. Releasing Sudan's unused allocations from previous funds would substantially increase these figures.[1582]
The Presidency on behalf of the European Union, however, joined in the chorus of condemnation of the government of Sudan helicopter gunship killings in February 20, 2002 in Bieh, Western Upper Nile/Unity State.[1583]
European civil society began to weigh in on Sudan policy, however. In May 2000, a broad coalition of European NGOs formed the European Campaign on Oil in Sudan (ECOS) to lobby the E.U., European governments, and European companies involved in the oil business in Sudan. ECOS urged these companies to pull out of Sudan because of the Sudanese government's gross human rights abuses.
In April 2002 ECOS published a report on continued displacements from Blocks 5A and 4, citing testimonies of people displaced in 2001 and up through the end of February 2002.[1584]
The Council of Ministers[1585] met on June 17, 2002, and concluded that, as the continuation of the conflict and continuing human rights violations constituted the main obstacles to development, the European Union should make its contribution to the peace process a priority. It endorsed the continuation of existing E.U. policy toward Sudan, with the main priorities being: support for the IGAD peace process, the Declaration of Principles, and other international efforts; promotion of respect for human rights and humanitarian law; promotion of the rule of law; encouragement of the transition to democracy; and support for the process of economic and social development, subject to progress towards a peace settlement.
Despite the gripping testimonies of deliberate displacement of civilians from the Block 5A concession where the European companies Lundin and OMV were invested, the Council of Ministers in its resolution did not refer once to the relationship between oil and war and human rights abuses in Sudan.[1586]
E.U. Leadership at the U.N. Commission on Human Rights
This movement toward resumption of normal relations despite Sudan's worsening human rights record underscored the E.U. trend to separate itself from U.S. leadership with regard to Sudan policy. This trend had been growing at least since the August 1998 U.S. bombing of the pharmaceutical plant in Khartoum. Indeed, in some diplomatic arenas the U.S. no longer sought to lead its European allies regarding Sudan.
This was most remarkable from a human rights perspective when, in 1998, the U.S. mission to the U.N. did not, as in all previous years starting in 1993, draft and present the annual resolution by the General Assembly condemning human rights abuses in Sudan. The E.U. took no action, believing the U.S. would eventually shoulder the burden, but that did not happen. As a result, there was no General Assembly condemnation of human rights abuses in Sudan that year, despite the gross abuses associated with the 1998 famine and the continuing war.
At the March-April 1999 session of the U.N. Commission on Human Rights, the E.U., under the leadership of the German presidency, undertook to draft the resolution on Sudan, with an eye to continuing the mandate of the special rapporteur on human rights in Sudan, renewable yearly. The special rapporteur's mandate was first approved in the 1993 session. The resolution had previously been drafted and backed by the U.S., and voted on by the commission.
The E.U. draft resolution for the U.N. Commission on Human Rights was different, however, in that the E.U. undertook to have the consent of the Sudanese government to the resolution. It believed that it could thereby gain the commitment of the Sudanese government to uphold human rights, particularly in the specific areas mentioned in the resolution. The Sudanese government negotiated the content of most of the resolution with the E.U., but did not finally agree to it until the E.U. threatened to withdraw its resolution and let a stronger U.S. alternative resolution proceed. Among other things, the U.S. resolution condemned Sudan for slavery, a charge the Sudanese government regarded as untrue and offensive. The E.U. draft did not use the word "slavery," but referred instead to "abductions."[1587] This word change came despite the special rapporteur's specific findings on "slavery."
This consensual drafting process has since become the pattern at the U.N. human rights commission for Sudan and other countries as well. The E.U. continued to draft resolutions on Sudan, until the U.S. resurrected its diplomatic profile on Sudan. The mandate of the special rapporteur was continued-one of the primary objectives of the E.U. as well as the U.S.-but the condemnations of the Sudanese government were watered down, while those against the SPLM/A, which is not afforded participation in the consensual process, became sharper. For instance, in the 1999 resolution on human rights in Sudan, the government was not "condemned" for any human rights abuse, but the SPLM/A was, for the killing of four humanitarian workers near Pariang, Western Upper Nile/Unity State, in March 1999.[1588] In 2000, neither was "condemned," but the commission expressed its concern about the "conditions imposed by the [SPLM/A] on humanitarian organizations working in southern Sudan" and about the "murder of, attacks on and use of force against United Nations as well as humanitarian personnel, in particular by the [SPLM/A]."[1589]
The report of the special rapporteur on human rights in Sudan of April 19, 2000, specifically mentioned displacement of Nuer populations by the government "with the purpose of ensuring military control of oil industry operations in Upper Nile." He expressed concern "at the use of oil industry airstrips for military purposes" and hindering relief assistance particularly in Western Upper Nile/Unity State mainly by restricting and denying flight access. He was convinced that the oil issue in Western Upper Nile/Unity State "lies at the heart of the conflict and believes that it is not fair for the civilian population to be once again the most affected target in this scenario. Oil exploitation has resulted in the exacerbation of the war." He recommended that all efforts be made to facilitate the return of displaced people to their place of origin, and that the use of oil facilities for military purposes come to an end.[1590]
The commission, however, did not mention oil development specifically in its resolution of April 18, 2000 (adopted by 28 votes to none, with 24 abstentions).[1591]
The U.N. special rapporteur on human rights in Sudan, Leonard Franco (of Argentina), resigned in late 2000 and was replaced on December 28, 2000, by Gerhart Baum (of Germany, an E.U. country), who visited Sudan in March 2001.
Baum in his oral remarks to the commission on April 27, 2001, noted that he had gathered further evidence that "oil exploitation leads to an exacerbation of the conflict with serious consequences on the civilians." [1592] He detailed destruction of certain villages by name, and said, "It seems that, under the conditions of the on-going war, oil exploitation is often preceded and accompanied by human rights violations, particularly in terms of forced displacement. . . . Government officials . . . assured me that displaced individuals are compensated accordingly."[1593] Human Rights Watch knows of no such cases of individual compensation in the south.
Baum also appealed to the oil companies operating in Sudan "to fully comply with their corporate responsibilities with a view to minimizing any negative impact of their operations, particularly before planning new ones. The link between oil exploitation and human rights abuses should continue to be monitored intensively," he stated.[1594]
The commission resolution of April 20, 2001, finally expressed "deep concern" at the "forced displacements of populations, in particular in areas surrounding the oilfields . . . ."[1595] The resolution also expressed concern over the "widespread and indiscriminate aerial bombardments by the Government of the Sudan,"[1596] in contrast to the 2000 resolution, which did not specifically mention the culpability of the Sudanese government in bombardment.
In the resolution-related press release of April 20, 2001, the commission highlighted its deep concern at forced displacements in oilfield regions.[1597]
The E.U. and the commission resolution, however, did not did not follow the lead of the special rapporteur with regard to his findings about the link between oil development and human rights abuses. The special rapporteur, however, did not relent. In his January 2002 report to the commission, he stated that "oil has seriously exacerbated the conflict while deteriorating the overall situation of human rights." He also said that he had received information that "oil exploitation is continuing to cause widespread displacement . . . ." [1598]
Again, the commission resolution in April 2002 mentioned oil development but did not link oil development with the increase in human rights abuses. Specifically, the resolution expressed the concern of the commission at the "ongoing plight of internally displaced persons in Sudan, in particular women and children, and their lack of access to protection and assistance, including in areas surrounding the oilfields."[1599] The resolution, however, did reauthorize the mandate of the special rapporteur.
This Sudan resolution, weaker than the special rapporteurs's report, in fact passed by only one vote at the commission.[1600] This was the closest the commission had ever come to defeating a resolution on human rights in Sudan and to not renewing the mandate of the special rapporteur. In the 2002 session, African states bridled at the proliferation of special rapporteurs assigned to monitor human rights in African countries, and determined as a body to vote against extending their mandate-in the context of human rights criticism of Zimbabwe by the developed countries. The only African country at the commission to vote in favor of the Sudan human rights resolution was Uganda, with South Africa abstaining.[1601]
In the 2003 session of the U.N. Commission on Human Rights, the Sudanese government finally attained its goal of blocking any resolution on human rights in Sudan, by a vote of 24-26-3: twenty-four in favor of a resolution, twenty-six opposed, and abstentions. All E.U. members of the U.N. Commission on Human Rights voted in favor of the resolution, which the E.U. drafted. Uganda abstained; in 2002 Uganda voted in favor of the resolution. All the other African members of the U.N. Commission on Human Rights voted against the resolution, led by South Africa.[1602] The mandate of the special rapporteur for human rights in Sudan, which had lasted ten years, was defeated by two votes-and the war was not over, nor had human rights conditions improved.
PART V: CONCLUSIONS AND RECOMMENDATIONS
CONCLUSION
Human Rights Watch believes that corporations may become complicit in human rights violations where their activities facilitate or exacerbate human rights violations, or where they benefit from past or on-going violations.
Complicity occurs in several cases. First, when corporations benefit from the failure of government to enforce human rights standards. Second, when corporations are involved in systematic violations of rights and the state, aware of such violations, and fail to meet its obligations under international human rights law; this constitutes human rights abuse by state omission and corporate commission. Third, when a corporation facilitates or participates in government human rights violations. Facilitation includes the company's provision of material or financial support for governmental forces which then commit human rights violations.
In some rare cases, companies cannot avoid the taint of complicity in human rights violations: their activities are inextricably intertwined with the abuses, the abuses are gross, the corporate presence either facilitates or continues to benefit from violations, and no remedial measure exists to mitigate those abuses. This amounts to inappropriate corporate presence, meaning that a corporation should not operate in a particular area because of its unavoidable, negative impact on human rights.
Based on the facts and law set forth above, Human Rights Watch concludes that the participation of international oil companies in two Sudanese oil concessions, Blocks 1,2, 4, and Block 5A, amounts to inappropriate corporate presence.
There are grave and systematic human rights violations taking place within Sudan, particularly with regard to the conduct of the war in the oil-producing regions and elsewhere, that the government of Sudan has been unable or unwilling to address and to date have not been susceptible to remedy through the ordinary mechanisms of the state's legal system nor through international mechanisms; and no form of pressure from the international community has had any reasonable prospect of having a significant effect in reducing or mitigating the abuses.
In Sudan, the deliberate, forcible displacement, without notice or compensation, of tens and even hundreds of thousands of civilians from the southern oil regions in Western Upper Nile/Unity State has occurred during several periods since the discovery of oil in the south, and is still occurring. The means are military, used by government army or government-armed militias against civilian populations in the context of a war that has been going on for almost twenty years. The oilfields have become the "main conflict area" in Sudan, according to the U.N.[1603]
The government's military campaign in the oil producing regions was specifically designed to clear the civilian population out of the area to facilitate oil production. In this regard, the oil companies clearly benefited from grave and systematic abuses by the state-without such a vicious displacement campaign, the companies would not be able to operate, or so the government seemed to believe. The government chose to depopulate the areas rather than reach and keep peace agreements or other arrangements with those who lived in and had a historical claim on the land.
Contrast the treatment that southern Sudanese agro-pastoralists living in oil areas received to the treatment that GNPOC and the government provided for northern Sudanese living along the pipeline. The latter had the benefit of an environmental assessment (including the human environment) and compensation in cash, for instance, when they were moved to a safe (two kilometers) distance from the pipeline. Whether or not these payments were adequate, they did at least constitute an attempt to mitigate the possible adverse effects of oil development. Southerners, as described above and in many other reports on the subject, received no environmental assessment and no compensation. Instead, they were moved by military force off their land, their houses and communities were destroyed, their grain and livestock stolen, and some family members lost, killed, or injured. They had to find food and shelter as best they could, while still under military threat. Not only did the government and the oil companies fail to compensate them, they provided no emergency assistance (except for a token amount of aid Talisman provided in August 2000), and the government actively prevented relief agencies from reaching those displaced in the oilfields on countless occasions.
Sudanese pastoralists are not so very different from Canadians, Swedes, Austrians, or other people who live in countries where the oil companies have their headquarters. They want the peaceful enjoyment of their homes. If they are to be taken away from their homes in the name of "development," they want to have some say in it, and at a minimum they deserve fair (not violent) treatment, a just process to determine the need for their displacement, and adequate compensation for their losses. Canadians, Swedes, and Austrians would not be impressed by the treatment the southern Sudanese have instead received at the Sudanese government's and the oil companies' hands. They would not think that a few water wells, a clinic, and relief handouts were an adequate compensation for having their livelihood and homes destroyed and their families subjected to attack, injured, perhaps killed, dispersed, and forced to live in intolerably substandard conditions exposed to life-threatening epidemics for an indefinite period of time, deprived of the opportunity to return to self-sustaining life.
The oil companies have claimed to be ignorant of facts that are readily apparent to those who want to see. The oil companies acquiesced in the government's mistreatment of its citizens, while claiming that "development" would promote peace-a claim for which they offered absolutely no evidence, and which has in no way been borne out by the progress of the war in Sudan.
Oil development also has tended to retard peace and in some cases is a causus belli for insurgents. That is certainly the case in Sudan. In two other countries in Africa that have large reserves, Nigeria and Angola, the oil wealth has neither been used to improve conditions for the poor, nor has it contributed to progress towards democratic government.[1604]
The means by which the Sudanese government chose to protect the oil companies were draconian and arbitrary: it expelled rural people from their land and livelihood, killed their family members, and robbed and burned their property, because these people lived in areas where oil was found-and were presumed on grounds of their ethnic origin to be opposed to the government of Sudan exploiting that oil. Those it did not expel on the first or second wave were left economically insecure and terrified of another raid. The government not only failed to compensate and provide adequate substitute shelter for the displaced, it actively hindered agencies that tried to reach the displaced with emergency relief.
The oil operations, on-line since August 1999, have introduced a new source of revenue to a very abusive government, enabling it to increase its expenditures for military and security operations during which egregious rights violations continue to be committed.. After receiving this new income, the government escalated the level of warfare in the south, the Nuba Mountains, and the east, illustrated by the more frequent use of helicopter gunships and increased aerial bombing hitting civilians and civilian infrastructure such as hospitals, relief centers, churches, and schools. The government admitted that it was spending its oil income to build its own arms and munitions factories, and its own budget figures showed that it was spending a substantial chunk of its oil income on defense.
Indeed, the flow of oil may still work as a disincentive to peace, depending on the outcome of pending peace talks. The issues of power sharing and revenue or resource sharing for the six-and-a-half-year interim period between the signing of a peace agreement and the self-determination referendum remained outstanding issues in the peace negotiations sponsored by IGAD as of the writing of this report.
The oil companies constructed transportation infrastructure such as airstrips and all-weather roads, which served to extend government control. These facilities were nonexistent in these areas before. The government provided "protection" to these oil operations, and used oil company infrastructure and transport vehicles, including occasionally company helicopters, to ferry army officers and others around. The roads brought closer to the oil operation areas villages which previously were too remote to be of interest to the various warring parties or to threaten oil installations by their presence. The roads in turn enabled the government to conduct attacks on the villages in vehicles; whereas before soldiers would have had to advance on foot, at much greater danger from rebels. The government used the consortiums' airstrips, particularly the long runway at Heglig, as military staging points to conduct war on the southern oilfields and beyond. Although Talisman said that it asked the government not to make offensive military use of the airstrip, by Talisman's own admission the government used the airstrip for military offensives at least four times in the year 2000. Thus, the airfield and road infrastructure required, justified, and facilitated an ever-expanding area of displacement and discriminate military attacks against civilians.
The completion of the pipeline through Blocks 1 and 2 to the Red Sea led inexorably to the extension of the program of forced displacement into Block 5A, which had been overlooked in the conflict until then. The pipeline, designed with excess capacity to carry anticipated production from Block 5A and other concessions in the area, spurred oil activity in Block 5A and indeed was the reason for the economic feasibility of Block 5A.
In turn, the local rebel forces tried to resist the government's control of the area, leading the government to move in with massive army and militia force, displacing as they went. In 1999 the government established its toehold: two new military bases in Block 5A to guard the oil, one at the well site, Ryer/Thar Jath, and another in Ler, the largest settlement in Block 5A. Since then military posts have proliferated. Oil development extended the geographical area of conflict, enmeshing pastoralists who had previously not been directly affected by the civil war.
None of the companies operating in Sudan has taken adequate steps to prevent or stop abuses from taking place. The human rights abuses continue, and even worsened from 1999 to 2003 according to the U.N. special rapporteur on Sudan's report to the April 2003 session of the of the U.N. Commission on Human Rights. Tens of thousands of people were displaced from wider and wider areas around oilfields in the GNPOC and Lundin concessions (Blocks 1, 2 and 4 and Block 5A) during that time period. Far from preventing this mass forced displacement from taking place after they commenced operations in 1999, the oil companies denied any forced uncompensated displacement was taking place, while taking few steps to establish the truth. Nor have oil companies protested the bombing (with one belated private exception), the continued suspension of the constitution, the denial of free assembly and movement rights, and the blockade of humanitarian relief to civilians displaced from oilfields, some few of Sudan's many human rights violations.
GNPOC and its non-Sudanese members, Talisman Energy, Petronas Carigali, and the China National Petroleum Company; and Lundin, OMV, and Petronas Carigali; operating respectivel in Blocks 1, 2 and 4 and in Block 5A throughout most of the period covered by this report, are not able to avoid complicity in these abuses. They cannot reliably ensure that they and their operations, individually or jointly, do not facilitate or benefit from human rights abuses. Indeed, they operate in the midst of the abuses, arguing that their presence alone, and small-scale development assistance, constitutes responsible corporate behaviour.
For these reasons, Human Rights Watch concludes that the companies are inappropriately operating in Sudan and should suspend their operations unless and until the steps recommended below are taken by both the companies and the government of Sudan.
RECOMMENDATIONS
Human Rights Watch recommends that the Greater Nile Petroleum Operating Company (GNPOC), the Lundin Block 5A Consortium, the Petronas 5B Consortium, and each of their member companies, namely Talisman Energy (and its successors), CNPC, Petronas, Lundin Oil, OMV (and its successors), and Sudapet should suspend their activities in Sudan. None of these nor any oil company, including TotalFinaElf, nor industry contractors and subcontractors, should resume or commence operations in Sudan unless the following minimum benchmarks are met:
I. Minimum Benchmarks
Displacement
The companies
The companies adequately finance a team, under the supervision of the U.N. High Commissioner for Human Rights, composed of independent experts on southern Sudan to compile an authoritative, credible survey of the identities and numbers of civilians forcibly displaced in or from the relevant oil concessions. The survey should attempt to determine the scope of human rights abuses since displacement from oil concession areas began, and who was responsible for their forcible displacement. Its findings should be made public. The survey should be in a form usable for determining future compensation.
The government
The government provides temporary accommodation for those who have been displaced in accordance with the standards utilized by the UNHCR, including the U.N. Guiding Principles on Internal Displacement.[1605] Furthermore, the government implements a credible and verifiable process to allow those forcibly displaced to return to their homes, with adequate compensation. If return is not possible, it provides them with adequate compensation for an acceptable place of relocation. The U.N. Guiding Principles on Internal Displacement state that:
Competent authorities have the duty and responsibility to assist returned and/or resettled internally displaced persons to recover, to the extent possible, their property and possessions which they left behind or were dispossessed of upon their displacement. When recovery of such property and possessions is not possible, competent authorities shall provide or assist these persons in obtaining appropriate compensation or another form of just reparation. . . . (Principle 29(2))
[Furthermore,] competent authorities have the primary duty and responsibility to establish conditions, as well as provide the means, which allow internally displaced persons to return voluntarily…to their homes or places of habitual residence, or to resettle voluntarily in another part of the country. . . . (Principle 28)
The compensation should include not only relocation funds, but also compensation for the loss of livelihood, family members, and property, and pain and suffering as a result of government army or militia attack and subsequent displacement.
The government protects returnees from all forms of harassment, abuse, or further displacement by its agents or others, and provides full access for independent monitoring of the conditions of their resettlement.
The government ceases all use of oil company airfields, transport, and infrastructure for military purposes, except to treat or evacuate the injured, wounded, or dead.
The government takes credible, verifiable steps to cease forced displacement from concession areas, and targeted or indiscriminate aerial bombardment or other attacks on civilian areas, including on civilian infrastructure such as relief sites, hospitals, churches, and schools.
The government permits unimpeded access to the oil-producing areas for Sudanese citizens, international organizations, human rights monitors, journalists, and humanitarian organizations.
Transparency
The companies
Oil companies, consortia members, and subcontractors disclose whether they have provided cash or in kind equipment or services for military, security, or dual use purposes.
The government
The government adheres in full to the International Monetary Fund (IMF) Code of Good Practices for Fiscal Transparency (see Appendix B). The government publishes the audits that the IMF Auditor General has conducted of Sudapet oil revenue and Sudanese government revenue from 1999 through 2002, and of the year 2003, and future such audits.
II. Failure to meet benchmarks
To the European Union and its member states (notably Sweden, Austria, France, Germany, and the United Kingdom), and the governments of Canada, China, and Malaysia, and any other state where oil companies operating in Sudan are headquartered:
Should the minimum benchmarks not be met within six months and companies based in your countries fail to withdraw from Sudan, pressure them to do so through targeted legislation and other measures.
III. Additional Recommendations
To the companies:
Publicly and privately condemn human rights violations by all parties in Sudan, and the inappropriate use of oil facilities by the government forces, and establish procedures to ensure that the activities of the consortia, their company members, and theirsubcontractors do not result in, benefit from, or contribute to human rights abuses.
Engage high-level government officials in active dialogue about human rights on a regular and timely basis. Actively monitor the status of Sudanese government or U.N. human rights investigations and press for their resolution.
Contribute to a trust fund to benefit the victims of human rights abuses in the oil producing areas, including compensation for those forcibly displaced. The fund should be transparent and fully audited.
Contribute to a fund to establish an independent human rights monitoring organization for all Sudan oilfields and related territory, and work to ensure that the organization has full access to the oil producing areas. The organization should include qualified, salaried, and experienced full-time staff based in the area and region, with supervision by the U.N. High Commissioner for Human Rights, and other independent human rights professionals.
Adopt internal guidelines for the provision of security by public or private forces for facilities in oil producing areas, emphasizing the need to respect human rights, to institute effective monitoring to ensure the guidelines are being followed, and to initiate disciplinary proceedings when they are violated. Those guidelines should prevent conduct that would be in violation of the international humanitarian rules of war if carried out by government or rebel forces and be in line with the U.N. Code of Conduct for Law Enforcement Officials, U.N. Basic Principles on the Use of Force and Firearms by Law Enforcement Officials, and the various corporate codes of conduct in effect.
Allow and cooperate with independent verification of compliance by GNPOC, Lundin, and Petronas consortia, their members, and subcontractors, with international human rights and humanitarian law standards.
Issue independent and verified reports on the government's compliance with international standards of human rights and humanitarian law. Issue independent and verified reports on internal company compliance with the International Code of Ethics for Canadian Business or any other code of conduct which any of the consortia, companies, or subcontractors may have adopted.
Ensure human rights training for all public or private security providers, based on the U.N. Code of Conduct for Law Enforcement Officers and international humanitarian law.
To the Government of Sudan:
Protect all civilians in war zones and refrain from targeted or indiscriminate attacks upon population centers or other civilian settlements, and on civilian objects including relief sites, hospitals, churches, and schools.
Demonstrate your commitment to international human rights and humanitarian law by ratifying or acceding to and respecting the Convention on the Prohibition of the use, stockpiling, production and transfer of antipersonnel mines and on their destruction (the Mine Ban Treaty); the Convention Against Torture and Other Cruel, Inhuman or Degrading Treatment or Punishment; the Convention for an International Criminal Court; and the Optional Protocol to the Convention on the Rights of the Child on the involvement of children in armed conflict.
Disarm and disband the Baggara militia (muraheleen), on account of their abusive record, and any Popular Defence Force or army units in which they are included.
Cease funding or using in any military activities any other armed groups who are reported to have carried out widespread and systematic abuses.
Ensure that any military unit operating with the Sudanese army observes the same rules of international humanitarian law by which the Sudanese government is bound.
Investigate and prosecute those alleged to be responsible for attacking civilians and civilian objects, looting, kidnapping, abducting, or engaging in forced labor practices or slavery.
Permit the ICRC to conduct inspections of all detention and jail facilities, and to conduct private interviews with any prisoners or others detained in connection with the conflict. Permit the ICRC to have access to military places of detention.
Contribute to a trust fund for the compensation of individuals who have been displaced by the government or government agents from their homes in the oil concessions. The fund should be transparent and fully audited.
Adhere in full to the IMF Code of Good Practices on Fiscal Transparency and publish a detailed account of military expenditures and the source of such revenue under IMF guidance, allowing for a reasonable balance between full detail and valid national security concerns.
Develop legislation and regulations requiring present owners and prospective purchasers of oil concessions and other oil facilities to conduct an independent human rights and environmental impact assessment and to protect the human rights of those living in or near the oil projects.
To the United States:
Condemn abuses by all parties to the conflict-including the Sudanese government armed forces and its ethnic militias, SSDF, Baggara militias, Popular Defence Force, SPLM/A, and others-and insist that those responsible for abuses be held accountable.
Continue existing sanctions on Sudan until concrete and measurable progress has been made toward ceasing human rights abuses.
Avoid providing funding, directly or indirectly, to or through any rebel movement, armed force, or coalition, whether it be U.S. AID or Economic Support Funds or other, until that rebel, armed, or coalition force has demonstrated that it will respect human rights and humanitarian law in the conduct of its own troops, officers and members. Specific actions would include investigation and appropriate punishment for human rights abusers, past and present.
Investigate allegations of abuses by any rebel formation, and issue a public report to Congress on rebel abuses every six months, with specific steps that the U.S. will take to help prevent such abuses in the future.
To the Canadian Government:
Put Sudan on the Area Control List for selective trade restrictions in support of human rights objectives.
Enact legislation that would permit Canada to apply unilateral economic sanctions to companies engaged in the oil business in Sudan. Apply sanctions if the minimum conditions listed above are not met within a limited time frame.
In conjunction with Canadian human rights experts and the nongovernmental Canadian-based organizations which have been associated with the Sudan oil campaign, establish and finance a Canadian monitoring office for the Sudan oilfields. It should operate under the direction of human rights experts and the campaigning NGOs, and issue reports on human rights abuses in the oilfields and related territory. It should monitor government and rebel conduct, as well as compliance by Canadian and other companies and the consortia of which they are members with the International Code of Ethics for Canadian Business, whether or not they have signed it.
To the governments of Canada, China, and Malaysia:
Contribute to a trust fund for the compensation of individuals who have been displaced by the government or government agents from their homes in the oil concessions. The fund should be transparent and fully audited.
To the European Union and its member states, notably Sweden, Austria, France, Germany, and the United Kingdom:
Initiate a consultation with the government of Sudan under Article 96 of the Cotonou Agreement between the E.U. and the African-Caribbean-Pacific (ACP) states, and insist on measurable progress including remedies for past human rights abuses, an immediate cessation of government bans on relief flights and denial of access to relief operations, and cessation of targeting civilians and civilian objects. In particular the consultation must stress abuses in the oil areas.
Authorize and fund an independent and professional human rights and environmental assessment of all oil concession areas in Sudan where E.U. companies have invested or provided good or services, supervised by the U.N. High Commissioner for Human Rights-where at least a full year is provided for field work-to determine whether or not oil development has contributed to human rights abuses, the spread of the conflict, loss of livelihood of original residents, or potential or actual environmental damage.
Authorize and fund an independent and professional investigation of possible breaches of the E.U. arms embargo on Sudan, including any arms sales or transfers by E.U. aspiring members.
Devise regulations for transnational companies incorporated or based in the E.U. regulating their conduct so that they do not become complicit, directly or indirectly, with human rights abuses in countries where they are doing business.
Seek from all companies incorporated or based in the E.U. which are engaged in oil-related business in Sudan detailed annual reports relating to their compliance with international business codes and international business human rights norms.
To the members of the United Nations Security Council:
Impose and enforce an embargo on trade or transfer of all arms and other war materiel between any person, company, or country and the Sudanese government or any rebels operating inside Sudan until concrete and measurable progress in compliance with international human rights and international humanitarian law is made toward ending human rights abuses, as established by the U.N. High Commissioner for Human Rights.
To the World Bank:
Refrain from lending to or funding of the government of Sudan, including funding for research, until the above minimum benchmark conditions are met.
To the rebel forces: the SPLM/A and other anti-government armed groups:
Publicly condemn abuses against civilians by your forces, and adhere to human rights and humanitarian law standards.
Conduct investigations of human rights and humanitarian law abuses.
Ensure the protection of civilians in war zones, including smaller ethnic groups, Muslims, women, and children.
Allow unimpeded access to humanitarian organizations, human rights monitors, and journalists.
Cooperate with efforts of international, national, and U.N. human rights monitors to investigate and publicize abuses of human rights and humanitarian law occurring within your territory.
Permit the ICRC (according to its modalities) to conduct inspections of all detention and jail facilities, and to conduct private interviews with any prisoners or others detained in connection with the conflict.
Immediately demobilize all child soldiers under the age of eighteen and cooperate with UNICEF, Rädda Barnen, and others in their efforts to reunite the children with their families.
For the SPLM/A, stop supporting Nuer factions, whether inside or outside of the SPLA, that engage in fighting other Nuer.
APPENDIX A: CHART OF BOMBING CONDUCTED BY THE GOVERNMENT OF SUDAN, 2000-2001
Best Estimates, Compiled Regularly from Reliable Sources by Sudan Focal Point-Africa, Nairobi[1606]
2000[1607]
Month, Year |
Number of bombs |
Number of Incidents |
Number of civilians injured |
Number of civilians dead |
March, 2000 |
127-140 |
27 |
29-44 |
7-8 |
June, 2000 |
29-30 |
6 |
1 |
0 |
July, 2000 |
254-270 |
32 |
12-32 |
2-6 |
August, 2000 |
106-108 |
20 |
101 |
6-8 |
Sept. 2000 |
35-38 |
3 |
13 |
1 |
October, 2000 |
138 |
14 |
9 |
1-2 |
Nov. 2000 |
176-180 |
34 |
74 |
31-32 |
Dec. 2000 |
147-151 |
32 |
14 |
6 |
Total, June-Dec: |
885-915 |
141 |
224-244 |
47-55 |
Total 2000 available: |
1012-1055 |
155 |
253-288 |
54-63 |
2001
Month |
Number of bombs |
Number of incidents |
Number of civilians injured |
Number of civilians dead |
January, 2001 |
82-83 |
17 |
5 |
9 |
February, 2001 |
28 |
25 |
1 |
3 |
March, 2001 |
19-20 |
15 |
1 |
0 |
April, 2001 |
48-52 |
14 |
6-9 |
2 |
May, 2001 |
89-91 |
15 |
1 |
0 |
June, 2001 |
93-98 |
28 |
9 |
14 |
July, 2001 |
70-72 |
13 |
16 |
16-19 |
August, 2001 |
22 |
6 |
0 |
0 |
September, 2001 |
18-38 |
5 |
6 |
6 |
October, 2001 |
96 |
9 |
44 |
37 |
November, 2001 |
45 |
9 |
9 |
19 |
December, 2001 |
* |
N/A |
N/A |
N/A |
Total: | ||||
January-Dec. |
610-645 |
156 |
98-101 |
106-109 |
* There were no confirmed reports of bombing during December 2001.
2002
Month |
Number of bombs |
Number of incidents |
Number of civilians injured |
Number of civilians dead |
January, 2002 |
33 |
9 |
0 |
5 |
February, 2002 |
26 |
6 |
16 |
35 |
March, 2002 |
* |
4 |
0 |
0 |
April, 2002 |
* |
1 |
0 |
0 |
May, 2002 |
16 |
1 |
100 |
35 |
Total: | ||||
January-May |
75 |
21 |
116 |
75 |
* There were no confirmed reports of number of bombs or civilian injuries or casualties. Comparison of Bombing; Years 2000 & 2001, June-November (Based on Median Numbers)
|
Totals
|
Year 2000, June-November |
Year 2001, June-November |
Difference |
Percentage Change |
Number of Bombs |
751 |
357.5 |
393.5 |
52%(decrease) |
Number of Incidents |
109 |
70 |
39 |
36%(decrease) |
Number of Civilians Injured |
220 |
84 |
136 |
68% (decrease) |
Number of Civilians Dead |
40.5 |
93.5 |
53 |
131% (increase) |
APPENDIX B: International Monetary Fund, Code of Good Practices on Fiscal Transparency
Updated March 23, 2001
http://www.imf.org/external/np/fad/trans/code.htm (accessed May 23, 2002)
Introduction
This update of the Code of Good Practices on Fiscal Transparency, was approved by the Executive Board on March 23, 2001 and subsequently acknowledged by the IMF. The basic principles remain the same as those of the original Code. The revised version gives added emphasis to assurance of the quality of fiscal data and includes other minor modifications derived from experience in implementing the Code. Modifications to the Code will continue to be considered periodically, in light of the experience with its application.
The Interim Committee stressed the importance of good governance when it adopted the Partnership for Sustainable Global Growth in September 1996, and again at its September 1997 meeting in Hong Kong SAR. Fiscal transparency would make a major contribution to the cause of good governance. It should lead to better-informed public debate about the design and results of fiscal policy, make governments more accountable for the implementation of fiscal policy, and thereby strengthen credibility and public understanding of macroeconomic policies and choices. In a globalized environment, fiscal transparency is of considerable importance to achieving macroeconomic stability and high-quality growth. However, it is only one aspect of good fiscal management, and attention has to be paid also to increasing the efficiency of government activity and establishing sound public finances.
Because of its fiscal management expertise and universal membership, the IMF is well placed to take the lead in promoting greater fiscal transparency. The IMFC is therefore seeking to encourage IMF member countries to implement the following Code of Good Practices on Fiscal Transparency. The Code is based around the following key objectives: roles and responsibilities in government should be clear; information on government activities should be provided to the public; budget preparation, execution, and reporting should be undertaken in an open manner; and fiscal information should attain widely accepted standards of data quality and be subject to independent assurances of integrity.
The Code sets out what governments should do to meet these objectives in terms of principles and practices. These principles and practices are distilled from the IMF's knowledge of fiscal management practices in member countries. The Code will facilitate surveillance of economic policies by country authorities, financial markets, and international institutions. Guidelines to the implementation of the Code are provided in a supporting manual, which has been revised in line with the changes in the Code, and updated in a number of areas.
The Code acknowledges diversity across countries in fiscal management systems and in cultural, constitutional, and legal environments, as well as differences across countries in the technical and administrative capacity to improve transparency. Most countries have scope for improvement in some aspects of fiscal transparency covered in the Code. Diversity and differences across countries, however, inevitably imply that many countries may not be able to move quickly to implement the Code. Moreover, it is recognized that there may be a need for technical assistance if existing fiscal management practices are to be changed. The IMF, together with other international organizations, will give some priority to providing technical assistance to those countries that need help and are strongly committed to improving fiscal transparency.
Revised Code of Good Practices on Fiscal Transparency
I. Clarity of Roles and Responsibilities
1.1 The government sector should be distinguished from the rest of the public sector and from the rest of the economy, and policy and management roles within the public sector should be clear and publicly disclosed.
1.1.1 The structure and functions of government should be clearly specified.
1.1.2 The responsibilities of different levels of government, and of the executive branch, the legislative branch, and the judiciary, should be well defined.
1.1.3 Clear mechanisms for the coordination and management of budgetary and extrabudgetary activities should be established.
1.1.4 Relations between the government and nongovernment public sector agencies (i.e., the central bank, public financial institutions, and nonfinancial public enterprises) should be based on clear arrangements.
1.1.5 Government involvement in the private sector (e.g., through regulation and equity ownership) should be conducted in an open and public manner, and on the basis of clear rules and procedures that are applied in a nondiscriminatory way.
1.2 There should be a clear legal and administrative framework for fiscal management.
1.2.1 Any commitment or expenditure of public funds should be governed by comprehensive budget laws and openly available administrative rules.
1.2.2 Taxes, duties, fees, and charges should have an explicit legal basis. Tax laws and regulations should be easily accessible and understandable, and clear criteria should guide any administrative discretion in their application.
1.2.3 Ethical standards of behavior for public servants should be clear and well publicized.
II. Public Availability of Information
2.1 The public should be provided with full information on the past, current, and projected fiscal activity of government.
2.1.1 The budget documentation, final accounts, and other fiscal reports for the public should cover all budgetary and extrabudgetary activities of the central government, and the consolidated fiscal position of the central government should be published.
2.1.2 Information comparable to that in the annual budget should be provided for the outturns of the two preceding fiscal years, together with forecasts of the main budget aggregates for two years following the budget.
2.1.3 Statements describing the nature and fiscal significance of central government contingent liabilities and tax expenditures, and of quasi-fiscal activities, should be part of the budget documentation.
2.1.4 The central government should publish full information on the level and composition of its debt and financial assets.
2.1.5 Where subnational levels of government are significant, their combined fiscal position and the consolidated fiscal position of the general government should be published.
2.2 A commitment should be made to the timely publication of fiscal information.
2.2.1 The publication of fiscal information should be a legal obligation of government.
2.2.2 Advance release date calendars for fiscal information should be announced.
III. Open Budget Preparation, Execution, and Reporting
3.1 The budget documentation should specify fiscal policy objectives, the macroeconomic framework, the policy basis for the budget, and identifiable major fiscal risks.
3.1.1 A statement of fiscal policy objectives and an assessment of fiscal sustainability should provide the framework for the annual budget.
3.1.2 Any fiscal rules that have been adopted (e.g., a balanced budget requirement or borrowing limits for subnational levels of government) should be clearly specified.
3.1.3 The annual budget should be prepared and presented within a comprehensive and consistent quantitative macroeconomic framework, and the main assumptions underlying the budget should be provided.
3.1.4 New policies being introduced in the annual budget should be clearly described.
3.1.5 Major fiscal risks should be identified and quantified where possible, including variations in economic assumptions and the uncertain costs of specific expenditure commitments (e.g., financial restructuring).
3.2 Budget information should be presented in a way that facilitates policy analysis and promotes accountability.
3.2.1 Budget data should be reported on a gross basis, distinguishing revenue, expenditure, and financing, with expenditure classified by economic, functional, and administrative category. Data on extrabudgetary activities should be reported on the same basis.
3.2.2 A statement of objectives to be achieved by major budget programs (e.g., improvement in relevant social indicators) should be provided.
3.2.3 The overall balance of the general government should be a standard summary indicator of the government's fiscal position. It should be supplemented where appropriate by other fiscal indicators for the general government (e.g., the operational balance, the structural balance, or the primary balance).
3.2.4 The public sector balance should be reported when nongovernment public sector agencies undertake significant quasi-fiscal activities.
3.3 Procedures for the execution and monitoring of approved expenditure and for collecting revenue should be clearly specified.
3.3.1 There should be a comprehensive, integrated accounting system which provides a reliable basis for assessing payment arrears.
3.3.2 Procurement and employment regulations should be standardized and accessible to all interested parties.
3.3.3 Budget execution should be internally audited, and audit procedures should be open to review.
3.3.4 The national tax administration should be legally protected from political direction and should report regularly to the public on its activities.
3.4 There should be regular fiscal reporting to the legislature and the public.
3.4.1 A mid-year report on budget developments should be presented to the legislature. More frequent (at least quarterly) reports should also be published.
3.4.2 Final accounts should be presented to the legislature within a year of the end of the fiscal year.
3.4.3 Results achieved relative to the objectives of major budget programs should be presented to the legislature annually.
IV. Assurances of Integrity
4.1 Fiscal data should meet accepted data quality standards.
4.1.1 Budget data should reflect recent revenue and expenditure trends, underlying macroeconomic developments, and well-defined policy commitments.
4.1.2 The annual budget and final accounts should indicate the accounting basis (e.g., cash or accrual) and standards used in the compilation andpresentation of budget data.
4.1.3 Specific assurances should be provided as to the quality of fiscal data. In particular, it should be indicated whether data in fiscal reports are internally consistent and have been reconciled with relevant data from other sources.
4.2 Fiscal information should be subjected to independent scrutiny.
4.2.1 A national audit body or equivalent organization, which is independent of the executive, should provide timely reports for the legislature and public on the financial integrity of government accounts.
4.2.2 Independent experts should be invited to assess fiscal forecasts, the macroeconomic forecasts on which they are based, and all underlying assumptions.
4.2.3 A national statistics agency should be provided with the institutional independence to verify the quality of fiscal data.
APPENDIX C: CHRONOLOGY: OIL, DISPLACEMENT, & POLITICS IN SUDAN
Political and military events |
Effects of War/Displacement |
Oil Developments |
1956 Sudan independent from Anglo-Egyptian Condominium. | ||
1960s-72 Separatist southern war by Anyanya rebels. | ||
1969 Jafa'ar Numayri comes to power in a military coup. | ||
1972 The first civil war is settled by giving regional autonomy to the three southern states. |
1974 Chevron is granted large oil concessions in Sudan. |
|
1975: Southern separatists continue low-level warfare as Anyanya II. |
1978 Chevron discovers oil in Western Upper Nile (WUN), southern Sudan. |
Political and military events |
Effects of War/Displacement |
Oil Developments |
1983: Pres. Numayri revokes autonomy agreement and civil war resumes. |
Early 1980s Baggara militias with government support displace Nuer and Dinka from their lands in WUN. |
|
1983: SPLM/A formed in Ethiopia, with training and arms from Ethiopia. |
February 2,1984 Anyanya II attacks Chevron camp, killing three expatriates; Chevron suspends southern operations. |
|
April 6,1985 The Numayri government is overthrown by a popular uprising. |
1986 Agreement between SPLM/A and Baggara halts WUN raids temporarily. |
April 1985 The SPLA announces that it is still at war and will continue to block Chevron's operations. |
1986-89 Parliamentary government is elected; peace talks with SPLM/A. |
1988 Devastating famine in Bahr El Ghazal resulting from drought and Baggara looting, kidnapping, killing, destruction and displacement. |
June 30,1989 The National Islamic Front and Islamist army officers come to power through a military coup, aborting peace with SPLM/A. | ||
1990: IMF suspends Sudan's voting rights due to unpaid debt service. U.S. votes against Sudan in international financial institutions. |
May 1991 Pres. Mengistu Haile Meriam of Ethiopia is overthrown; one hundred thousand Sudanese refugees and SPLA rebels flee back to southern Sudan. |
|
August1991 Three SPLA commanders led by Riek Machar mount a failed coup against Col. John Garang, then form a rival faction; WUN with Riek Machar. Nuer Dinka border war starts. |
1991-1999 Nuer Dinka border war causes displacement and empties at least one hundred villages; 1991 "Bor massacre" by Nuer and Riek Machar forces displaces thousands of Dinka from area south of WUN. |
June 15,1992 Chevron sells its Sudan oil interests to Concorp, a Sudanese corporation. |
Political and military events |
Effects of War/Displacement |
Oil Developments |
1992 Government forces remove civilians who are "too near" prospective oil operations. |
December 8,1992 Canadian companies Arakis Energy Inc. and State Petroleum Inc. purchase some WUN concessions (later "GNPOC"). |
|
August 1993 U.S. State Department places Sudan on the U.S. list of countries that support international terrorism. |
December 1993 Government offensive clears civilians from oilfields near Heglig in WUN. |
August 22,1995 Two stock exchanges suspend trading in Arakis stock and investigate financial nondisclosures. |
April1996 Riek Machar faction and the government agree in Political Charter to southern self-determination referendum. |
July 1996 Arakis brings eight wells on stream and ships crude oil to El Obeid refinery for domestic use. |
October 1996 Sudanese government/muraheleen offensive displaces thousands north of Bentiu in WUN. |
December 6,1996 Arakis sells 75 percent of its GNPOC concession to Chinese National Petroleum Corp., (Malaysian) Petronas, Sudapet (40/30/5 percent respectively). |
February 6,1997 International Petroleum Company (IPC, owned by [Swedish] Lundin Oil), Petronas, (Austrian) OMV, and Sudapet buy Block 5A concession. |
Political and military events |
Effects of War/Displacement |
Oil Developments |
April 27,1997 Khartoum Peace Agreement signed by the government and Riek Machar, etc. |
March 1,1997 The GNPOC consortium agrees to build pipeline from its oil fields to the Red Sea. |
|
September 15,1997 Clashes in WUN between Cmdr. Paulino Matiep (government militia) and Riek Machar forces over governor elections for WUN (Unity State); in December Machar's candidate wins. |
November1997 U.S. executive order imposes criminal penalties on U.S. persons doing business with Sudan. |
June-August1998: Fighting between Matiep militia and Machar forces in WUN: Matiep forces three times enter and burn buildings in Duar, Koch, and Ler, WUN. |
July 1998 Displacement of civilians reflected in OLS report, concluding that WUN "experienced pre-famine conditions, in almost all cases as a result of military activity." |
July 16,1998 Arakis announces it is for sale. |
August 20,1998 In retaliation for the simultaneous bombings in June of two U.S. embassies in Africa, the U.S. bombs targets in Sudan(pharmaceutical plant), Afghanistan. |
August 1998 Environmental assessment of GNPOC pipeline route concludes that if an accident happens, it will affect rivers and agricultural and pastoral areas. |
August 1998 Talisman announces it will buy Arakis and its Sudan assets. Sale closed in October. Talisman speeds up completion of the pipeline from GNPOC concession to the Red Sea. |
February-May1999 The defense minister and Riek Machar disagree on whose forces protect Block 5A. |
November1998 U.S. economic sanctions on Sudan extended. |
Political and military events |
Effects of War/Displacement |
Oil Developments |
February 27-March 8,1999 (Nile) West Bank Nuer-Dinka reconciliation sponsored by the NSCC in Wunlit, Bahr El Ghazal, ending their border war. |
Early 1999 Matiep forces order Dinka in Ruweng county (GNPOC) to move to garrison town of Pariang or to the north (Khartoum). |
April 8,1999 Lundin drills an exploratory well in Block 5A, stresses importance of GNPOC pipeline. |
April 29,1999 Gen. Matiep expels Gov. Taban Deng from Unity state |
March 31, 1999 Four Sudanese captured while with ICRC in Ruweng county WUN killed in SPLA custody. |
April 1999 CNPC announces that it plans to begin selling shares to the public to help fund new projects. |
May 9-23,1999 Sudanese government forces launch an offensive on Dinka villages in Ruweng County (GNPOC area), using Antonovs, helicopter gunships, militia, and soldiers, burning and destroying civilian property and displacing thousands. |
May 4,1999 Talisman annual shareholders meeting: shareholder measure protesting Sudan project is not allowed on the ballot. Demonstrators protest Talisman's partnership with the abusive Sudan government. |
|
May 1999 The government announces its Popular Defense Force (PDF, Islamist militia under army jurisdiction) is dispatching "Protectors of the Oil Brigade" to the oil fields. |
May 5, 1999: Matiep and government army forces sweep through Block 5A to Adok, causing mass displacement of Nuer and property destruction. |
May 21,1999 Lundin announces discovery of a large oil deposit in Block 5A and suspension of operations until end of the rainy season. |
Political and military events |
Effects of War/Displacement |
Oil Developments |
May 31,1999 Completed pipeline at Heglig is inaugurated. | ||
June1999 The first resolution by the U.S. Congress on Sudan condemns human rights abuses there. |
June 1999 First waves of WUN Nuer displaced reach Dinka areas, welcomed. Late June WFP report on Ruweng area finds evident malnutrition. |
June 23,1999 The first oil flows into the GNPOC pipeline. |
July 3, 1999 Riek Machar forces (with SPLA supplies) conduct a surprise attack on Matiep militia in Ler, later fight in Koch, Boaw, and Nhialdiu in Block 5A. |
July 1999 Helicopter gunships attack Pariang area and a new relief airstrip at Biem in Block 1, with civilian casualties and displacement. |
June 30,1999 The Concorp refinery north of Khartoum, privately owned and financed by China, is inaugurated. |
July 11,1999 Gen. Matiep's agents abduct two state ministers and other civilians at night; the two are found dead and many others are detained at the Matiep base. |
July 1999 Government air power stops Riek Machar advance at Nhialdiu in WUN; government/militia forces push south and displace thousands. |
|
July 14,1999 Government bans relief flights to most of WUN. | ||
. |
July 24, 1999 Government forces destroy Bolyar village, five hours from GNPOC oil operations |
|
July 27,1999 WFP calls for lifting the government flight ban and warns that 150,000 civilians in WUN cannot be reached with necessary relief. | ||
|
August 27,1999 The IMF lifts its declaration of non-cooperation, imposed in 1990. |
August 1999 Sudanese government partially lifts WUN flight ban but access remains limited. Third round of fighting in Block 5A leaves thousands more displaced. |
August 30,1999 The first Sudanese export of crude oil: 600,000 barrels from the new port on the Red Sea. |
Political and military events |
Effects of War/Displacement |
Oil Developments |
September 9,1999 Cmdr. Peter Gatdet and troops mutiny from Gen. Matiep, capture Mankien base, turning against the government. |
September 19-25,1999 WFP suspends food distributions in Bentiu because of security. |
September 19,1999 The first sabotage on the pipeline occurs in northern Sudan, east of Atbara. |
Early October1999 More oil-related sabotage: two bomb blasts go off at a depot and service station in Kassala, eastern Sudan. |
September 23, 1999 Fighting and government flight bans block aid to WUN. |
September 30,1999 Rep. Frank Wolf asks the U.S. Securities and Exchange Commission (SEC) to disapprove the CNPC initial public offering (IPO) listing on the New York Stock Exchange. |
October 26,1999 The Canadian government sets forth its Sudan policy, with possible sanctions on Talisman. |
October 20,1999 Talisman estimates that the Heglig and Unity fields will earn the Sudanese government some U.S. $3 to $5 bn. |
|
November 4,1999 Realignment of Nuer forces in Waat, Upper Nile, forming the Upper Nile Provisional Military Command Council. |
November1999 WFP says many areas of WUN cannot be accessed and 140,000 vulnerable people do not receive needed emergency food aid, while an additional 360,000 lack access to basic health etc. |
November1999, PetroChina created to receive all CNPC China mainland assets and to remove Sudan-based objections to the CNPC IPO: the Sudan project will stay behind a "firewall" with CNPC. |
November 1999 A government minister tells oil industry analysts visiting Sudan, sponsored by Talisman, that military spending amounts to only 15 to 18 percent of the budget, and will not be increased. |
Late November1999 WFP says faction fighting and government flight bans have prevented delivery of food and other services to an estimated 800,000 people in the region |
November 28,1999 A pipeline importing oil products from Port Sudan to Khartoum is sabotaged. |
Political and military events |
Effects of War/Displacement |
Oil Developments |
1999 Military spending is 62.2 billion dinars. |
1999 Talisman and the Sudan government's profits almost double, due to an OPEC-led jump in crude oil prices. |
|
November 1999 U.S. economic sanctions on Sudan extended. | ||
December 13,1999 In an intramural government power struggle, an all-Sudan state of emergency is imposed and parts of the constitution suspended. |
1998-1999 WFP estimates 70,500 civilians in WUN displaced as a result of oil field conflict. |
December 1999 Canadian government human rights mission visits Sudan and oilfield areas. Sudan Update publishes Peter Verney's report on the role of oil in the Sudan civil war. |
January 31, 2000 Riek Machar resigns from government, forms another rebel army; Waat unity ends. |
January 2000 Rebels (Beja Congress) sabotage the pipeline. |
|
2000: Sudanese government oil revenue for the year is $ 140.9 bn dinars. |
January 2000 Lundin builds a bridge across the Bahr El Ghazal river at Bentiu and in February says drilling operations in Block 5A still stalled. |
|
February 2000 SPLM/A and Islamist leader al Turabi reach political agreement; al Turabi jailed by government. |
February 14, 2000 Sudan government bombs a school in Kauda, Nuba Mountains, killing fourteen. Bombing by Sudan government increases in 2000. |
February 14, 2000 The Canadian government human rights report says Canadian companies have responsibility for increased human rights abuses in Sudan; sanctions not imposed. |
February 2000 The U.S. extends its Sudan sanctions to U.S. entities doing business with GNPOC or Sudapet. | ||
Political and military events |
Effects of War/Displacement |
Oil Developments |
March-May 2000 Rebels ambush oil road construction work in Blocks 5A, 1. | ||
May 2000 Beja Congress on camelback sabotages the pipeline. | ||
July-August 2000 Three times, government bombs airstrips where relief planes are on the ground. Flights suspended. |
May 2000 Talisman annual meeting; shareholder resolution for independent report on Sudan projectwinsvotes but no majority. Internal report to be prepared. |
|
July 2000 Riek Machar's forces receive ammunition from government militias to fight the SPLA in WUN. |
July-August 2000 Scorched earth fighting between Gatdet SPLA and Riek Machar forces results in mass displacement. |
July-December 2000 Lundin completes roadwork on all-weather road from Ryer/Thar Jath to Bentiu. |
September2000 The U.S., in the U.N. General Assembly, keeps Sudan from a seat on the Security Council. | ||
December 2000 Sudan's national assembly, following elections, extends the state of emergency. | ||
2001 Sudanese government takes delivery of twelve attack helicopters and twenty-two armored combat vehicles from Russia; military spending doubled over 1999. |
February-April 2001 A new wave of displaced flees to Bentiu due to attacks and looting by government militia; WFP reports high malnutrition rates. |
January 2001 SPLA Cmdr. Peter Gatdet attacks oil installation in GNPOC concession. |
2001 Sudanese government military expenditures for 2001 (90.2 bn dinars) are 45 percent higher than 1999 and consume 60 percent of 2001 oil revenues. |
March 2001 Lundin announces a significant discovery in Block 5A. |
Political and military events |
Effects of War/Displacement |
Oil Developments |
April 2001 Wunlit West Bank Peace Council calls emergency session, calling for end to SPLA/ Riek Machar fighting in WUN. |
April 2001 A Swedish journalist travels Lundin's oil road and notes displacement as well as militarization of the road. |
April 2001 Talisman issues its Corporate Social Responsibility Report 2000, saying it paid compensation to the displaced-in the north, along the pipeline. |
April 27,2001 Sudanese army Brig. Gen. Gatluak Deng forms Nuer, Dinka, and Equatorian government militias into one unified force, SSDF. |
May 1, 2001 At annual meeting Talisman presents satellite images of seven small areas in its Sudan project as "proof" of non- displacement. Critics demonstrate. |
|
May 3, 2001 Petronas, Lundin, OMV, and Sudapet buy Block 5B south of Block 5A. | ||
May 8,2001 U.S. SEC requires foreign companies on U.S. exchanges to disclose material business done with countries "of particular concern" to State Department because of abuses. |
May 2001 Georgette Gagnon and John Ryle publish report on displacement and government attacks on civilians in Western Upper Nile |
May 2001 Talisman announces a projected expansion from six to ten oil fields within twelve months. |
June 2001 U.S. representatives pass Sudan Peace Act with capital market sanctions against foreign companies doing business with Sudan; law stalls in the Senate. |
June 2001 Gerhart Baum, U.N. special rapporteur for Sudan, reports that human rights worsened since 2000, fueled by conflict over oil. |
May 2001 A coalition of European NGOs forms the European Campaign on Oil in Sudan to lobby to cease oil operations in Sudan. |
September 6,2001 President Bush assigns John Danforth as his special envoy for peace in Sudan. |
July 2001 Wild polio virus confirmed in Ruweng County; WHO urges new immunizations. |
|
September 2001 After the September 11th attacks on the U.S., the Sudanese government announces its cooperation with the U.S. against terrorism. |
Political and military events |
Effects of War/Displacement |
Oil Developments |
September 2001 The U.S. abstains and 1996 Security Council sanctions on Sudan are lifted. | ||
October 27,2001 Kenyan Lt. Gen. Lazarus Sumbeiywo appointed IGAD chairman |
October 5-8, 2001 Sudanese government bombs relief operations in Bahr El Ghazal, with fifteen civilian casualties. |
November 1, 2001 U.S. economic sanctions against Sudan extended. |
November 13,2001 U.S. special envoy Danforth presents a four-point plan to the Sudanese government and SPLM/A. |
November 27, 2001 U.N. consolidated appeal for Sudan calls for almost U.S. $ 200 million in aid for 2002, cites food insecurity in WUN. |
November 8, 2001 A class action lawsuit on behalf of Sudanese displaced is filed against Talisman in New York, claiming it contributed to rights abuses. |
December 9,2001 Sudan's National Assembly extends the state of emergency. | ||
December 15,2001 The Russian Aircraft Corp. agrees to sell fighter jets to Sudan. Russia exported to Sudan in 2001 twenty-two armored combat vehicles and twelve attack helicopters. |
December 2001 Lundin helicopter shot down by government militia. |
|
January 7,2002 SPLM/A and Riek Machar faction unite. |
January 24-25, 2002 Government bombings in Koch, Ler, Mayendit WUN. |
January 2002 Talisman issues shares through the Toronto stock exchange, not NYSE. |
January 19,2002 Sudanese government and SPLM/A sign a cease-fire agreement for the Nuba mountains with U.S. and Swiss mediation. | ||
Early 2002: SPLA dry season offensive in WUN countered by government air and militia attacks. |
January-March 2002: Tens of thousands displaced from WUN away from oilfields. |
|
January 26 – February 1,2002 Cease-fire for WUN commanders formalized. |
January 23, 2002 The U.N. special rapporteur reports the human rights situation has not improved and that oil has exacerbated the conflict. |
Janurary 22, 2002 Lundin announces the suspension of its operations in Sudan due to deterioration of security conditions. |
February 7,2002 British Prime Minister Tony Blair announces appointment of Alan Goulty as special envoy for Sudan. |
February 9, 2002 Government bombing of Nimne in WUN kills five, including an MSF nurse. |
|
February 20, 2002: Sudan government helicopter attack on Bieh in WUN Block 5A kills twenty-four civilians. | ||
February 21,2002 The U.S. suspends negotiations with Sudan due to February 20 attack, which is denounced worldwide. |
March 2002 According to a joint WFP/OLS report, at least 174,200 civilians still displaced due to the oilfield conflict. |
|
March2002 The Sudanese government apologizes for February 20 attack; it and SPLA sign an agreement not to target civilians or civilian objects. |
March 1, 2002 The GOS raises the number of off-limit locations to relief agencies from 26 to 45. |
|
April 22,2002 Announcement that Sudan is to buy armaments from Russia and increase military-technical cooperation. |
January-October 2002 Sudanese government and militias fight SPLA in WUN, conducting a scorched earth campaign displacing tens of thousands; estimated 50,000-75,000 newly displaced from Block 5A. |
April 2002 Talisman Corporate Social Responsibility report for 2001 publishes government oil revenues, estimated at U.S. $ 674 million for 2001. |
March-April 2002 Two independent human rights investigations in WUN reports find continued displacement. |
Political and military events |
Effects of War/Displacement |
Oil Developments |
April 20, 2002 The U.N. Commission on Human Rights issues a resolution on Sudan mentioning abuses in the oilfields; by a one-vote margin, it continues the mandate of the special rapporteur. |
April 2002 MSF, Canadian NGO KAIROS, and Christian Aid/DanAid reports published on displacement in oil areas. |
May 2002 Talisman annual meeting of shareholder attracts criticism from shareholders and demonstrators outside. |
May 10,2002 Danforth's report to President Bush is made public; it recommends continuing U.S. engagement in the peace process. |
May 14, 2002 The European Coalition on Oil in Sudan publishes a report on recent displacement in Block 5A. |
May 2002 Austria's OMV issues a statement of concern about ECOS reports of abuses in Sudan. |
May 2002 WUN fighting intensifies, leading to displacement of 15,000-20,000 from Block 5A. |
May 22, 2002 An international commission of eminent persons finds that slavery is "commonplace" in Sudan. |
May 28, 2002 The Sudan government demands that southern relief operations be moved from Kenya to Khartoum, to bring them under government control. |
|
June 2002 IGAD peace talks revived. |
March-May 30, 2002 Humanitarian relief flights cut off then resume in WUN and Bahr El Ghazal. Up to 1.3 million people denied aid. |
May 2002 European Coalition on Oil in Sudan (ECOS) publishes "Depopulating Sudan's Oil Regions, January-March 2002, meets with OMV. |
2002 Talisman projections show that GNPOC oil production would peak in 2005 at 250,000 b/d then rapidly decline. |
June 26, 2002 OLS assessment in WUN estimates 150,000-300,000 persons affected by fighting and insecurity. 190,000 of them have fled into nearby area; food deficits in 2003 estimated at 50 – 100 percent of WUN population. |
|
Political and military events |
Effects of War/Displacement |
Oil Developments |
July 2, 2002 U.S. Assistant Secretary of State for African affairs Walter Kansteiner talks with President Bashir about peace. |
June 2002 WFP assessment in WUN finds widespread malnutrition, disease, and 60 percent of needy inaccessible because of flight bans. |
|
On July 20,2002 the Sudanese government and SPLM/A agree to self-determination after 6.5 year interim period and no shari'a in the south, in the Machakos Protocol reached in IGAD negotiations. |
Early July, 2002. Thousands flee following the fall of the rebel-held town of Mankien, WUN. |
July 30, 2002 Talisman announces daily production in Sudan over the second quarter averaged 60,600 b/d. |
July-October2002 Sudanese government continues WUN offensive. |
August-September 2002 Government continues partial WUN flight ban. |
August 9, 2002. Lundin says it will resume drilling in February 2003 if peace agreement finalized in September. |
September 2,2002 Government walks out of peace talks after SPLA captures town of Torit. |
September 27 – October 1, 2002 Sudanese government closes all humanitarian access to southern Sudan. |
|
October 2002 U.S. Congress passes the Sudan Peace Act, imposing sanctions on Sudan if it does not negotiate in good faith; capital market sanctions dropped. |
October 5, 2002 Sudanese government drops eighteen bombs on several villages between Koch and Bieh in WUN. |
|
October 16,2002. The government and SPLM/A sign a cease-fire, extended later, and peace negotiations resume. |
October 26, 2002 The Sudan government and SPLM/A agree to full humanitarian access. |
October 30, 2002 Talisman announces agreement to sell its Sudan assets to Indian state oil company. |
October 21, 2002 The U.S. Sudan Peace Act is signed into law. |
November 2002 U.S. renews economic sanctions on Sudan. |
|
Political and military events |
Effects of War/Displacement |
Oil Developments |
December 15, 2002 The Civilian Protection Monitoring Team issues its first report. | ||
2002 Russia sold eight armored combat vehicles and four attack helicopters to Sudan, and Belarus sold Sudan fourteen large-caliber Russian-made artillery systems. | ||
Late December 2002-January 2003 Government dry season offensive in Block 5A. | ||
February 4, 2003 After CPMT report documents Sudanese government ceasefire violations, the parties sign an addendum to the ceasefire agreement. | ||
February 2003 Cmdr. Tito Biel defects to the government. |
March 27, 2003 Lundin announced the resumption of oil activities. |
|
April 2003 After ten years, Sudanese government succeeds in achieving vote at U.N. Commission on Human Rights not renewing the mandate of the special rapporteur on human rights. | ||
April 2003 The South Sudan Defence Forces attend the security talks at IGAD and table a proposal that is ignored. |
April 27, 2003 Lundin agrees to sell its Block 5A interest to Petronas. |
April 21, 2003 First submission to Congress pursuant to Sudan Peace Act concludes both parties are negotiating in good faith. |
September 2, 2003 OMV signs an agreement to sell its Blocks 5A and 5B interests to ONGC Videsh. |
ACKNOWLEDGMENTS
This report was researched in southern Sudan, Khartoum, Nairobi, and elsewhere from February 1999 to November 2002 by Jemera Rone, Sudan researcher for the Africa Division of Human Rights Watch, and written by her. The information provided is up to date through November 2002, with some exceptions. Jemera Rone was assisted by research assistants Cecilia Lund, Ryan Hahn, Colin Relihan, Claire Johnson, Rose S. Shuman, Caroline Conway, Alex Belser, Melinda Coolidge, Luisa Boyarski, Shannon Sinton, and Linda Bembatoum.
The report was edited by Bronwen Manby, associate director of the Africa Division, Joseph Saunders, associate director of the Program office, and Michael McClintock and Malcolm Smart, formerly of the Program office of Human Rights Watch. Production and coordination assistance was provided by Jeff Scott and Colin Relihan, associates for the Africa Division, and Patrick Minges, director of publications. Encouragement and support were provided by Peter Takirambudde, director of the Africa Division.
The manuscript was reviewed and helpful advice received from Douglas H. Johnson, John Ryle, Sharon E. Hutchinson, and Diane de Guzman.
Victor Kovner, Tom Burke, and Jennifer Williamson of Davis Wright Tremaine LLP in New York and Paul Sutton of Orchard in London reviewed the text and provided invaluable legal advice.
Human Rights Watch would like to thank all of the victims and witnesses of human rights abuses who spoke with us in our research. We gratefully acknowledge the support and invaluable assistance of the directors and staff at World Vision in 1999, and of other operational inter-governmental and non-governmental organizations that wish to remain anonymous. We would also like to thank the Peace Desk of the New Sudan Council of Churches.
Support for this research was provided in part by the Steelworkers Fund for Humanity and World Vision Canada, and by the Richard and Rhoda Goldman Fund for work on the environment and human rights. Douglas H. Johnson funded the creation of the maps of the oil regions published in this report and at http://rightsmaps.com/html/sudmap1.html.
[1] See reports of the Civilian Protection Monitoring Team established by agreement of the parties, http://www.cpmtsudan.org.
[2] Saudi Arabia has 261 billion barrels of oil in reserves, Iraq 112.5 billion barrels. The U.S. has 21 billion barrels, the U.K. has 5.2 billion, and Canada has 4.9 billion. Sub-Saharan African countries rank 11th in the world (Nigeria, 22.5 billion barrels) and 17th (Angola, 5.4 billion). Libya is 8th in the world with 29.9 billion barrels, and Algeria, ranked 14th, has 9.2 billion barrels of oil reserves. Petronas, "Oil & Gas Reserves Ranking" (as at 1 January 2000), http://www.Petronas.com.my/internet/Business.nsf/dbcf3db8a4c05acbc825671c0017634c/ (accessed June 19, 2002). Congo Brazzaville has 1.5 billion barrels, and Brunei has 1.4 billion barrels of proved reserves. Energy Information Administration, U.S. Department of Energy, "World Crude Oil and Natural Gas Reserves" (as at January 1, 2001), http://www.eia.doe.gov/emeu/iea/table81.html (accessed June 26, 2002). Sudan's oil ministry estimated that it had 1.2 billion barrels of oil reserves, but this is not proven reserves. "Sudanese Oil Reserves Surpass 1 Billion Barrels," Xinhua, Khartoum, May 3, 1999. Proven reserves are 643.6 thousand barrels as of the end of 2002 for the principal producing fields in Blocks 1, 2, and 4. Talisman Energy, 2002 Annual Report, p. 64. See the glossary for definitions of probable and proved reserves.
[3] The Melut Basin (including Blocks 3 and 7), running north and south of Malakal, west to the Muglad Basin, and east to the Ethiopian border, remains less developed than the Muglad Basin and is not covered in this report.
[4] Talisman
Energy, powerpoint presentation, Center for Strategic and International Studies
(CSIS), Washington, DCWashington, D.C.,
April 2002. Talisman provided the figures of 19,500 square miles and 12.5
million acres, from which the square kilometers were calculated. See
http://www.csis.org/africa/index.htm (accessed October 30, 2002).
[5] Lundin Petroleum website, http://www.Lundin-petroleum.com/eng/sudan5a.shtml, http://www.Lundin-petroleum.com/eng/sudan5b.shtml (accessed June 26, 2002). The concessions vary in size over time based on arrangements with the government of Sudan to give back undeveloped areas. Lundin provided the figures for Blocks 5A and 5B in square kilometers, from which the square miles and acreage were calculated. Together Blocks 1, 2, 4, 5A, and 5B total some 35,344 square miles; 91,536 square kilometers; or 22.7 million acres.
[6] Talisman Energy was operating in Sudan through its wholly-owned Netherlands subsidiary, Talisman (Greater Nile) B.V.
[7] J.W. Buckee, "Talisman in Sudan," Globe and Mail (Toronto), Calgary, October 21, 1999. See Talisman Energy, "Sudan-The Greater Nile Oil Project. Background Paper," December 1998, p.6.
[8] Proved gross reserves according to Talisman were, for the years ending December 31, 1998: 403.6 million barrels; 1999: 528 million barrels; 2000: 562.8 million barrels; and 2001: 625.2 million barrels. Based on Talisman Energy 2001 Annual Report, p. 57.
[9] "Talisman Makes Sudan Discovery," The Oil Daily (New York), May 3, 2002.
[10] Talisman Energy, CSIS presentation, April 2002.
[11] Talisman
Energy, excerpt from 2001 Annual Report,GET PAGE CITE.p. 13.
[12] This figure is calculated from Talisman's share of 60,000 b/d in 2002. Talisman Energy, 2002 Annual Report, p. 21.
[13] Talisman Energy, CSIS presentation, April 2002, http://www.csis.org/africa/0208_SudanPFCSum.pdf (accessed August 21, 2003).
[14] Talisman press release, "Talisman to Sell Sudan Assets For C1.2 billion," Calgary, October 30, 2002, http://micro.newswire.ca/releases/October2002/30/c6739.html (accessed October 30, 2002).
[15] Due to corporate restructuring, the owner of the Lundin interest in Block 5A became Lundin Petroleum (also "Lundin").
[16] Lundin Petroleum AB press release, "Lundin Report for Nine Months ended September 30,2002;" C. Ashley Heppenstall, president and CEO of Lundin, letter to shareholders, November 15, 2002, http://www.lundin-petroleum.com/Documents/pr_corp_15-11-02_e.pdf (accessed November 18, 2002).
[17] Lundin Petroleum AB press release, "Update on activities in Block 5A, Sudan,"March 27, 2003.
[18] Lundin Petroleum, "Lundin Petroleum completes sale of Block 5A Sudan," June 23, 2003.
[19] This style of displacement-here for the purpose of gaining control of land and grazing areas-had already been practiced by the Baggara in the Dinka Abyei area of southern Kordofan, with disastrous results for the people of Abyei. David Keen, The Benefits of Famine: A Political Economy of Famine and Relief in Southwestern Sudan, 1983-1989 (Princeton: Princeton University Press, 1994). The story of Abyei is beyond the scope of this report.
[20] Relief Association of Southern Sudan (RASS) officer and former school administrator, Human Rights Watch interview, Nairobi, Kenya, August 1-2, 2000.
[21] Most southerners' names include the "proper" name first, the father's name (second), and the grandfather's name (last). To refer to Paulino Matiep as "Matiep" is to refer to that commander's father. Therefore the first and second names are used for southerners in this report, although in conversation southerners routinely refer only to the first name, i.e., "Paulino," with some exceptions such as using the father's name when the proper name is widely used, or a title, i.e., John Garang de Mabior may be referred to as "Garang"-or as "Dr. John."
[22] See http://www.usinternet.com/users/helpssudan/.
[23] Ghazi Salah Eldin Atabani, State Minister of Foreign Affairs, Human Rights Watch interview, Khartoum, May 4, 1995.
[24] Human Rights Watch interview, Elijah Hon Top (deceased 2000), chief of staff, South Sudan Defence Forces (SSDF), Khartoum, July 26, 1999.
[25] Report of the special rapporteur, Gerhart Baum, to the Commission on Human Rights, "Situation of human rights in the Sudan," E/CN.4/2002/46, January 23, 2002, http://www.unhchr.ch/Huridocda/Huridoca.nsf/TestFrame/64639579934bf6dcc125669d002cfbcd?opendocument (accessed June 20, 2002).
[26] Ibid.
[27] Ibid.
[28]
International Monetary Fund, "IMF Lifts Declaration of Noncooperation from
Sudan," News Brief No. 99/52, Washington, DCWashington, D.C.,
August 31, 1999.
[29] The only known exception occurred when Jim Buckee joined the international chorus of protest of the government helicopter gunning of an emergency food relief distribution location near Ler that killed twenty-four civilians in February 2002. He wrote a private letter to President El Bashir.
[30] James W. Buckee, Talisman CEO, "President's Letter to Shareholders," March 10, 1999, http://www.Talisman-energy.com/ar98pres.html (accessed February 3, 2001).
[31] Ralph R. Capeling, General Manager, GNPOC, Pipeline Division, Human Rights Watch telephone interview, Khartoum, July 28, 1999.
[32] Leonardo Franco, Special Rapporteur on the situation of human rights in Sudan, "Report on the situation of human rights in Sudan," prepared for the UN General Assembly, A/54/467, October 14, 1999, http://www.unhchr.ch/Huridocda/Huridoca.nsf/(Symbol)/A.54.467.En?Opendocument, (accessed August 13, 2003).
[33] Steven Edwards, Claudia Cattaneo, and Sheldon Alberts, "Calgary firm tied to Sudan 'atrocities'," National Post (Toronto), Khartoum and Ottawa, November 17, 1999.
[34] International Code of Ethics for Canadian Business, http://www.uottawa.ca/hrrec/busethics/codeint.html (accessed June 6, 2001).
[35] The pre-tax segmented revenue was U.S. $ 1,768 million in 2000, of which U.S. $ 184 million was attributable to its Sudan operations. The comparable amounts were revenue of U.S. $ 1,616 million in 2001, with U.S. $ 210 million derived from the Sudan operations, and revenue of U.S. $ 1,352 million in 2002, with U.S. $ 310 million derived from Sudan. Talisman Energy, 2002 Annual Report, March 4, 2003, p. 55.
[36] Talisman Energy, Corporate Social Responsibility Report 2000, p. 23.
[37]Talisman
(Greater Nile) B.V., "Community Development Strategy – 2001," undated, pp. 6-8.T to come O
COME.
[38] Talisman Energy, Corporate Social Responsibility Report 2000, p. 23. The GNPOC project expenses were deducted as expenses to the project.
[39] Talisman Energy, Corporate Social Responsibility Report 2001, pp. 11, 23. Talisman approved a U.S. $ 2 million community development work plan for 2001, but because it was not all expended, it put the balance (U.S. $ 581,515) into a trust. Ibid., p. 11.
[40] For the year 2002, in which Talisman sold out its interest in Sudan, it issued its Corporate Social Responsibility Report 2002 that did not include comparable information.
[41] "Statement by USAP on Oil," as reproduced in Sudan Democratic Gazette, Year X, no. 115, London, December 1999, p. 9.
[42]"Statement
by USAP on Oil," as reproduced in Sudan Democratic Gazette, Year X, no.
115, London, December 1999, p. 9. Ibid.
[43] New Sudan Council of Churches (NSCC), "Statement of the Sudanese Churches on the Oil Factor in the Conflict in the Sudan," press release, Geneva, April 12, 2000, http://www.pcusa.org/pda/sudanoil.htm (accessed June 24, 2001). The statement was signed by the chairmen and other officers of the Sudan Council of Churches (SCC) based in Khartoum and the NSCC based in Nairobi, April 14, 2000, the temporary branch of the SCC.
[44] "Human Security in Sudan: The Report of a Canadian Assessment Mission," prepared for the Canadian Ministry of Foreign Affairs, Ottawa, January 2000 ("Harker report"), p. 63: "But the point is that by seeking the truth, we think we have found it, &, within limits, were Talisman to actively seek the truth of what was/is going on around it, it too would find the truth as we have. And the truth can be uncomfortable."
[45] Ibid., p. 16.
[46] Talisman Energy, "Corporate Responsibility Report,"March 4, 2003, p. 8. ONGU Videsh Ltd. completed its purchase of Talisman's interest in GNPOC on March 12, 2003. http://www.talisman-energy.com/operatingareas/africa/sudan.html (accessed July 28, 2003).
[47] See Anna Koblanck, "Lundin Oil's road/DN in Sudan: On flight from the war over oil," Dagens Nyheter (Stockholm), April 28, 2001 (translated by Human Rights Watch).
[48] Lundin press release, "Lundin Petroleum Announces a Temporary Suspension of Activities in Block 5A Sudan," Geneva, January 22, 2002.
[49] Lundin press release, "Update on activities in Block 5A, Sudan," Geneva, March 27, 2003.
[50] Lundin press release, "Lundin Petroleum completes sale of Block 5A Sudan," Geneva, June 23, 2003. The announcement of the agreement to sell was made on April 28, 2003. Lundin press release, "Lundin Petroleum Sells Interest In Block 5A, Sudan To Petronas For USD 142.5 Million," Geneva, April 28, 2003.
[51] Madelaine Drohan, "Sudan play bad timing for Talisman," Globe and Mail (Toronto), Ottawa, October 27, 1999.
[52] Talisman did even not sign on to the code of conduct for Canadian businesses until after the Canadian government human rights investigative mission was actually on the ground in Sudan in late 1999.
[53] Harker report, p. 15.
[54] U.S. President William J. Clinton, Executive Order 13067, "Blocking Sudanese Government Property and Prohibiting Transactions with Sudan," Washington, D.C., November 4, 1997, http://www.pub.whitehouse.gov/uri‑res/I2R?urn:pdi://oma.eop.gov.us/1997/11/5/2.text.2 (accessed February 24, 2000). These sanctions were renewed by the Bush administration in November 2001 and 2002.
[55] The parties agreed to the Declaration of Principles (DOP) in 1994 and the Sudanese government spent considerable effort backing away from it until the Machakos Protocol was signed in Machakos, Kenya, on July 20, 2002. In the DOP the parties affirmed the "rights of self-determination of the people of South Sudan to determine their future status through a referendum" and agreed that a "secular and democratic state must be established in the Sudan." Declaration of Principles, articles 2 and 4, signed by representatives of the government of Sudan and the SPLM/A, Nairobi, May 20, 1994.
[56] The unimpeded access agreement was between the government, the SPLM/A, and U.N. Operation Lifeline Sudan. "Meeting Held On The Implementation Of Clause 5 Of The Machakos MOU On Unimpeded Humanitarian Access," Nairobi, October 25-26, 2002.
[57] Western Upper Nile is the name by which this part of Upper Nile province or region has been called in the twentieth century. It is roughly the same area as Unity State (al Wihda), created by the Sudanese government in 1994. Liech state is the name given to the area by the forces of Riek Machar, but originally that name applied only to the central portion of the Jagei and Dok Nuer areas, centered on Kot-Liech, the tree where the Nuer were supposed to have originated. Douglas H. Johnson, email to Human Rights Watch, April 30, 2001. In this report it is referred to as Western Upper Nile/Unity State.
[58] Some oil had been pumped before 1999, near El Muglad in Western Kordofan (in the north) and from the Melut area east of the White Nile in Upper Nile (in the south). The Melut oil, about 10,000 barrells per day, was barged down the Nile (north) and refined for domestic use in a refinery at El Obeid (Northern Kordofan). The Melut Basin (including Blocks 3 and 7), running north and south of Malakal, west to the Muglad Basin, and east to the Ethiopian border, remains less developed than the Muglad Basin and is not covered in this report, although there are plans to bring in other investors and pump oil sufficient to justify a pipeline.
[59] Douglas H. Johnson, Nuer Prophets: A History of Prophecy from the Upper Nile in the Nineteenth and Twentieth Centuries (Oxford: Clarendon Press, 1994), pp. 37-38.
[60] The Nuer and the Dinka call the seasonally river-flooded grasslands in the White Nile basin of southern Sudan the toic. Exposed late in the dry season as the floodwaters recede, the toic provides excellent pastureland.
[61]Bahr is Arabic for river. For the convenience of non-Arabic speakers this report refers to the rivers with their names followed by the English "River," i.e., Bahr El Ghazal River. Otherwise, Bahr El Ghazal refers to a region of southern Sudan.
[62] Aggrey Ayuen Majok and Calvin W. Schwabe, Development Among Africa's Migratory Pastoralists (Westport, Conn.: Bergin & Garvey, 1996), pp. 22-25.
[63] Also spelled hijlij and anglicized as heglig. This is a colloquial Arabic name for the balanite tree; another colloquial Arabic name is laloub. The Dinka call the tree aling and Nuer call it thou or pan thou.
[64] Majok and Schwabe, Development Among Africa's Migratory Pastoralists, pp. 22-25.
[65] Prior to the twentieth century, "the Sudd" referred to large dams of aquatic vegetation blocking the channels of the swamps in the White Nile of southern Sudan. Sudd came from the Arabic sadd meaning barrier or obstacle. "When in flood, the Sudd covers an area of 80,000 square kilometers, and this has been a critical factor in the prevention of Arab penetration of South Sudan." S.L. Laki, "The Impact of the Jonglei Canal on the Economy of the Local People," International Journal of Sustainable Development and World Ecology 1 (1994), p. 90.
[66] Nilotic is the language group to which the Dinka, Nuer, Anyuak, Luo, Meban, and Shilluk people of Sudan belong. Nuer and Anuak also live in western Ethiopia.
[67] David C. Col and Richard Huntington, Between a Swamp and a Hard Place (Cambridge, MA: Harvard Institute of International Development, Harvard University Press, 1997), p. 90. These studies were carried out in the area around Abyei, in Block 4 to the west of and on similar terrain with the GNPOC oilfields.
[68] Map, Sudan Survey Department, "Maslahat al-Misahah, Sudan, tribes, Sheet 3," drawn by Abugabel, exd. by I. F., Khartoum, Corr. 1969 (U.S. Library of Congress map collection).
On the use of the word "tribe" referred to in the map: according to historian Douglas H. Johnson, in both north and south Sudan, "tribe [is] a political and administrative unit, not confined to kinship." In the north it is a straight translation of Arabic qabila. Affiliation to a tribe is not merely a matter of birth: anyone can join a tribe. As applied to the Baggara, the Dinka, and the Nuer, Johnson says one can refer to these as "peoples" as well as to the different political "tribes" they both contain. Email, D. H. Johnson to Human Rights Watch, April 30, 2001.
Although many Sudanese freely use the term "tribe" while referring to themselves in English, African scholars urge that the word "tribe" not be used because of its negative colonial connotations. To avoid the distraction of the debate, this report for the most part refers to "ethnic group" instead of tribe, i.e., Bul Nuer are an ethnic group, the Nuer a people.
[69] The Nuer were first the subject of anthropological research by the father of modern anthropology, E.E Evans-Pritchard. See, The Nuer: A Description of the Modes of Livelihood and Political Institutions of a Nilotic People (New York: Oxford University Press, 1969), pp. 5, 142 (originally published in 1940). His books on the Nuer and others have since become well known and often studied by anthropologists. The Encyclopedia Britannica defines the Nuer as a cattle-raising people "who live in the marshy and savannah country on both sides of the Nile River," spending the rainy season in permanent villages built on the higher ground and the dry season in riverside camps. Politically, they "form a cluster of autonomous communities." "Nuer," Encyclopedia Britannica (1999-2001), www.britannica.com/eb/article?idxref=30583 (accessed April 27, 2001).
Nuer tribes, defined by Johnson as the largest group to combine in warfare, consist of a number of primary sections, which in turn divide into smaller and smaller sections. Each section (cieng) typically corresponds to a territory of permanent settlement, to which the section gives its name. The smallest section encompasses a number of villages. Johnson, Nuer Prophets, p. 56. This report suggests that the largest Nuer group to combine in warfare is a constantly-changing entity motivated by political as well as ethnic rivalry and outside interference.
[70] Others refer to the "Panaru Dinka" (Dinka Panaru) rather than the Ruweng Dinka in that region. See the report of the Canadian human rights delegation to Sudan in December 1999 led by John Harker: Harker report, p.10. Relief and medical agencies attempting to work in the area in the 1990s used the term "Panarou/Panaru Dinka" also. See "Army/Muraheleen displacement, 1992-98," below.
The Dinka, a people closely related to the Nuer but speaking a different Nilotic language, similarly live in the savannah country and the highlands, toic, and sudd (swamps) of the Nile basin in southern Sudan, moving their herds from riverine pastures to permanent settlements according to the season. Also like the Nuer, they form many independent groups of between 1,000 and 30,000 persons, each of which is "internally segmented into smaller political units with a high degree of autonomy." "Dinka," Enclyclopedia Britannica (1999-2001), www.britannica.com/eb/article?idxref=30583 (accessed April 27, 2001). The Dinka are a larger ethnic group than the Nuer, and there has been frequent intermarriage and warfare between them.
[71] Map, "Bahr el Arab," maps N.C. 35, 1:1,000,000 series, by the Sudan Survey, 1937, with administrative boundaries corrected in 1976 (U.S. Library of Congress map collection); map, "Sobat," maps N.C. 36, 1:1,000,000 series, by the Sudan Survey, 1928, with administrative boundaries corrected in 1968 (U.S. Library of Congress map collection).
[72] Map, "Ghabat el 'Arab, Sudan Sheet 65-L" (1:250,000), Survey Office, Khartoum, 1936 (University of Durham, U.K., Library Collection). See also the 1977 maps published by the Soviet Union on Sudan, showing settlements throughout the area.
[73]The figures of male heads of household given for Western Upper Nile ethnic groups were: Aak-Adok [Dinka]: 31,296; Nyuong [Nuer]: 16,111; Jagei [Nuer]: 20,539; [Eastern] Jikany [Nuer]: 32,248; Bul [Nuer]: 33,893; Leek [Nuer]: 24,552; Alor Dinka: 7,013; Awet Dinka: 7,652; Kwil Dinka:16,976. First Population Census of Sudan 1955/56, Notes on Omodia Map (Khartoum: Ministry for Social Affairs Population Census Office, August 1958), p.59, as cited in D.H. Johnson email, April 30, 2001. This census is recognized as the most accurate and only count of the ethnic population in Sudan. "Sudan: Ethnic Structure," Encyclopedia Britannica (1999-2001), www.britannica.com/eb/print?eu=10842 (accessed April 27, 2001).
[74] D. H. Johnson, email, April 30, 2001.
[75] Omer Eltay and Sultan Hashmi, "A Quarter Century of Population Change in the Sudan," in Population and Human Resources Development in Sudan, eds. Omer S. Ertur and William J. House (Ames: Iowa State University Press, 1994), p.41, table 3.5.
[76] The figures for this 1983 census would be 1,433,504 rural; 90,889 urban; 70,160 nomadic. Eltay and Hashmi, "A Quarter Century of Population Change . . . ," , pp. 40-43, tables 3.4-3.6.
[77] Much of the water flooding the Upper Nile region annually is lost to evaporation. The Jonglei canal was to be cut in an almost straight line from the White Nile south of Malakal to the Bahr Al Jebel River near Juba.. The canal would short-cut the Bahr Al Jebel River as it meanders through Blocks 5A and 5B, and channel the flat and flooded marshes and the waters of the Nile, thereby preventing their evaporation. The waters captured in the deep canal could be sold to Egypt's burgeoning population and used for agricultural development in northern Sudan under agreements pertaining to rights in the waters of the Nile. For a discussion of the Jonglei canal project, see S.L. Laki, "The Impact of the Jonglei Canal," pp. 89-96.
[78] For examples of administrative reports, see C.A. Willis, et. al, The Upper Nile Province Handbook: a Report on Peoples and Government in the Southern Sudan, 1931, ed. Douglas H. Johnson (Oxford: Oxford University Press for the British Academy, 1995).
[79] Jonglei Investigation Team (JIT), The Equatorial Nile Project and its Effects in the Anglo-Egyptian Sudan, Vol. IV, Maps and Diagrams, map E 7 and map E 10 (1954), pp. 213, 217.
[80] The concept of "permanent habitation" refers to geographically determined areas of settlement for the Nilotic-speaking agro-pastoralists of southern Sudan. It is one of three categories of land identified by the JIT, the other two being seasonally river-flooded pastureland and intermediate rain-flooded pastures. Jonglei Investigation Team, Vol. I, pp. 138-42.
[81] Ibid., pp. 145-47.
[82]Jonglei Investigation Team, vol. IV.
[83] Some refer to the segment of the Bahr El Ghazal (Nam) that proceeds from the intersection with the Jur River to Wangkei the "Jur River."
[84] Rupnyagai, southwest of Bentiu and south of the Bahr El Ghazal (Nam) River, became a market center for Baggara and Nuer after their 1986 agreement. Many commanders lived there because it was a commercial center. It was burned down in the first fighting between Paulino Matiep's militia and the Riek Machar forces in September 1997 and subsequently rebuilt. It was partly rebuilt but burned down several times thereafter. It is on the border between Blocks 4 and 5A.
[85] Boaw and Koch are located in the Jagei Nuer district inhabited primarily by the Jagei subgroup of the Nuer. Koch is ten hours from Boaw on foot. The five parishes in Jagei include Kuat, Gang, Guk, North Guk, and Boaw. William Magany Chan, RASS coordinator Koch (Jagei area), Human Rights Watch interview, Nyal, Western Upper Nile, August 18, 1999.
[86] Duar town is in the Jikany Nuer area. Jikany in Western Upper Nile is sometimes referred to as Western Jikany, to distinguish it from the Eastern Jikany area later settled by the Nuer in their eastward expansion.
[87] Ler, Adok, and Mayandit towns are in the Dok Nuer area.
[88] Sharon E. Hutchinson, Human Rights Watch telephone interview, Madison, Wisconsin, April 18, 2001.
[89] Majok and Schwabe, Development Among Africa's Migratory Pastoralists, pp. 50-56. Sudan ranks second in cattle and sheep in Africa. It has an estimated 20 million cattle held by the 80 percent of Sudanese who live in rural areas. About 35 percent of the cattle population is estimated to be in the south, most of whose population is migratory pastoralists. Ibid., p. 49 (as of 1987). Most of the southern cattle can be found in the lower Sudd-land. Sue Lautze, email, October 17, 2001.
[90] Majok and Schwabe, Development Among Africa's Migratory Pastoralists, pp. 28-29.
[91] The Baggara of southwestern Kordofan and southeastern Darfur include the Misseriya, Humr, Hawazma, and Rizeygat, together known as 'Ataya. The Humr and Misseriya were once two sections of the Misseriya ethnic group. The Humr were later considered an ethnic group and consisted of two main sections encompassing several omdiyas, or administrative units. Ian Cunnison, Baggara Arabs: Power and the Lineage in a Sudanese Nomad Tribe (Oxford: Clarendon Press, 1966), pp. 7, 197, and map, facing p. 224. This is the seminal work on the Baggara. Because of the contemporary negative connotations of Baggara, including as raiders and slave takers, they prefer to be called by their ethnic group name, such as Misseriya, instead of Baggara.
[92] Cunnison, Baggara Arabs, pp. 18-19.
[93] In 1961, the government moved the north-south border to incorporate into Darfur the uranium lands formerly in northern Bahr El Ghazal. The uranium lands were not near Western Upper Nile. See below.
[94] Elijah Hon Top , Human Rights Watch interview, Khartoum, July 26, 1999; Keen, Benefits of Famine, pp. 79-82. Some Nuer believe that the Bul Nuer had better relations with the Baggara than did the other Nuer, and that the Bul Nuer were armed before other western Nuer because they acquired guns from the Baggara, and even served as scouts for them in territory of other Nuer. This remains to be researched.
[95]See Alex de Waal, "Some Comments on Militias in Contemporary Sudan," in Civil War in the Sudan, eds. M.W. Daly and Ahmad Alawad Sikainga (London: British Academic Press, 1993), pp. 145-46.
[96] Ahmad Alawad Sikainga, "Sudan: Ethnic Structure," Enclyclopedia Britannica (1999-2001), www.britannica.com/eb (April 27, 2001); First Population Census of Sudan 1955/56. Notes on Omodia Map (Khartoum: Ministry for Social Affairs Population Census Office, 1958), as cited in D.H. Johnson email, April 30, 2001.
[97] We
follow the categories set out in the census without making any judgment as to
what constitutes an "Arab," noting that all Sudanese are East Africans and that
"Arab" is a cultural or language category. Just what these categories mean and
what defines a Sudanese is the subject of great political debate. See Francis
M. Deng, War of Visions: Conflict of Identities in the Sudan (Washington
DCWashington, D.C.: Brookings
Institution, 1995).
[98] The term "black Africans" is a recent introduction by some foreigners wishing to alert other foreigners to Sudanese racial differences.
[99] Juba Arabic, a version of Arabic which includes many words from southern languages, is used as a lingua franca among southerners. The educated usually speak English and Arabic as well as their birth language.
[100] Ahmad Alawad Sikainga, "Sudan: Ethnic Structure," Enclyclopedia Britannica (1999-2001), www.britannica.com/eb (accessed April 27, 2001). Polygamy persists among some southerners who otherwise consider themselves Christians.
[101] The controversial Leni Riefenstal played a role in bringing the Nuba to international attention. See Leni Riefenstahl, The Last of the Nuba (New York: St. Martin's Press, 1995), featuring those Nuba who still embrace their traditional religions, scarification, and dress.
[102] Deng, War of Visions.
[103] The title of a well-known work on the south expresses the southern view: Abel Alier, Southern Sudan: Too Many Agreements Dishonored, 2d ed. (Reading: Ithaca Press, 1992).
[104] Atif A.Saghayroun and Abdul-Aziz M. Farah, "The Nature and Determinants of Fertility and Mortality in the Sudan," in Population and Human Resources, p. 56.
[105] Saghayroun and Farah, "The State of Health and Nutrition in the Sudan," p. 69, table 5.2.
[106]Anyanya, the name by which these separatist guerrillas were known, is the word for a poison made in southern Sudan.
[107] In 1976, in the first of his "decentralization" moves, President Nimeiri divided each province into two. Thereafter the Southern Region had six provinces rather than three. Subsequent governments have drawn and redrawn states, regions, and provinces throughout Sudan.
[108] Article 26 (i), Addis Ababa Agreement, in Steven Wöndu and Ann Lesch, Battle for Peace in Sudan (New York: University Press of America, 2000), p. 202.
[109] Protocols on Interim Arrangement, Chapter II, Articles 1-4, ibid., p. 208. The interim arrangement was to to remain in force for five years, subject to revision by the Sudanese president. It provided that the armed forces in the Southern Region "shall consist of a national force called the Southern Command composed of 12,000 officers and men of whom 6,000 shall be citizens from the Region and the other 6,000 from outside the Region." The military commission ended up recruiting only the Anyanya: 2,000 non-commissioned officers and privates from Anyanya in each of three southern provinces (subtotal 6,000) plus a total of 203 officers. An additional 1,500 Anyanya from each southern province (subtotal 4,500) were absorbed into the police and prison forces.
[110] Some were resettled as traditional farmers and others went to work in government establishments, where many remained employed only until 1974, when central government special funding ended. The regional government then guided the remaining estimated at 3,500 to self-employment as farmers. Alier, Southern Sudan, p. 143.
[111] These former Anyanya were stationed in the southern towns of Bor, Ayod, and Nasir and they mutinied in mid-1983 and went to Ethiopia to join the SPLM/A.
[112] Speech, John Garang, March 3,1984, as reproduced in John Garang Speaks , ed. Mansour Khalid (New York: KPI, 1987), p.23.
[113] The International Monetary Fund (IMF), an international organization with 182 member countries, was established in 1946 to promote international monetary cooperation, exchange stability, and orderly exchange arrangements; to foster economic growth and high levels of employment; and to provide temporary financial assistance to countries under adequate safeguards to help ease balance of payments adjustment. Its operations involve surveillance as well as financial and technical assistance. See http://www.imf.org/external/about.htm. (accessed June 19, 2001)
[114] The history of Sudanese oil development is discussed in J. Millard Burr and Robert O. Collins, Revolutionary Sudan: Hasan Al-Turabi and the Islamist State, 1989-2000 (Leiden: Brill Academic Publishers, 2003).
[115] The company is now known as Chevron Corporation. According to its 2000 annual report, it is "one of the world's largest integrated petroleum companies . . . involved in every aspect of the industry, from exploration and production to transportation, refining and retail marketing, as well as chemicals manufacturing and sales. It is active in more than 90 countries and employs about 34,000 people worldwide." Chevron Annual Report, http://www.chevron.com (accessed April 24, 2001). In Africa it is active in Angola and Chad, among other places.
[116] Mansour Khalid, Nimeiri and the Revolution of Dis-may (London and Boston: KPI, 1985), p. 306.
[117] Alier, Southern Sudan, p. 198. See also Muriel Allen, "Sudan: Oil a Political Weapon in Southern Sudanese Politics," Middle EastTimes (London), July 11, 1997.
[118] Alier, Southern Sudan, p. 240. According a former governor of Unity State, "Heglig point" was twenty-four kilometers inside the state. Taban Deng Gai, former governor of Unity State, Human Rights Watch interview, Khartoum, July 26, 1999.
[119] The balanite tree was known by Dinka and Nuer names, Aling and Pan Thou, respectively. Ibid.
[120] The name used in that era was supplied by Eoin S.C. Mekie, Finance Manager, Shell Company of the Sudan Ltd.. Email, Egbert Wesselink to Human Rights Watch, May 2, 2001. The Shell Company of The Sudan, Ltd., the name in use in 2001, is a subsidiary of the Royal Dutch/Shell Group of companies. "Shell in Sudan," http://www.shell.com (accessed April 24, 2001).
[121] Talisman Energy, "Sudan-The Greater Nile Oil Project: Background Paper," December 1998, p. 4.
[122] Alier, Southern Sudan, p. 244. See The Southern Sudan: The Problem of National Integrations, ed. Dunstan M. Wai (London: Frank Cass, 1973), pp. 227, 229, 231.
[123] Alier, Southern Sudan, pp. 200, 238.
[124] Alier, Southern Sudan, pp. 239-40. In 2000, the government sold gold and copper concessions in Hofrat en Nahas in southwestern Sudan (now in Southern Darfur State) to a firm in the United Arab Emirates, provoking a strong condemnation from the SPLM/A. Samson L. Kwaje, SPLM/SPLA press release, "SPLM/SPLA Strongly Opposes Annexation Of Hufrat Al-Nahas [sic] To Southern Darfur State," Nairobi, April 20, 2000; "Sudan Grants Gold, Copper Concession to UAE Firm," Reuters, Khartoum, April 18, 2000.
[125] Alier, Southern Sudan, p. 239; see the insightful article published in October 1983 about the weaknesses in the Addis Ababa agreement by Nelson Kasfir, "Why the Addis Ababa Agreement No Longer Regulates the Links between the North, the National Government and the South in Sudan" (Working Manuscript, Dartmouth College, October 1983), p. 19.
[126] Alier, Southern Sudan, pp. 241-42.
[127] Between 1980 and 1983, President Nimeiri recombined provinces into regions. The three former provinces that made up the single Southern Region were each called regions when the Southern Region was broken up in 1983, using the former names: Bahr El Ghazal, Upper Nile, and Equatoria.
[128] Nelson Kasfir, "Why the Addis Ababa Agreement . . . ;" Sharon E. Hutchinson, Nuer Dilemmas: Coping with Money, War, and the State (Berkeley: University of California Press, 1996), pp. 3-5; D. H. Johnson, TheSouthern Sudan, Minority Rights Group Report No. 78 (London: MRG, 1988); D.H. Johnson, "North-South Issues," in Sudan After Nimeiri , ed. Peter Woodward (London: Routledge Press, 1991).
[129] Groups calling themselves Anyanya operating out of Ethiopia had existed since at least 1976. They did not agree with the Addis Ababa agreement and the creation of a southern autonomous region. They wanted southern independence instead. Various Nuer SPLA forces were never in Anyanya II: they included Riek Machar (studying outside of Sudan), later SPLA zonal commander of his home region, Western Upper Nile, and Cmdr. William Nyuon Bany (in the Sudanese army), the highest-ranking Nuer in the SPLM/A until his defection in 1992.
[130] Nelson Kasfir, "Why the Addis Ababa Agreement . . . ,"p. 16; D.H. Johnson and Gerard Prunier, "The Foundation and Expansion of the Sudan People's Liberation Army," in Civil War in the Sudan, p. 124. Earlier threats to transfer a southern battalion from Wau to the north sparked off the first civil war, in 1955; note that the Kasfir article says, "That event [transfer of the Wau battalion] is popularly, if incorrectly, considered to have initiated the civil war." Actually, the level of armed insurgency during the first Anyanya war was low until the early 1960s, when Maj. Gen. Abboud came to power in 1958 and began to impose Islamization and Arabization measures on the south. Kasfir, "Why the Addis Ababa Agreement . . . ."
[131] A soldier in Anyanya, John Garang had been integrated into the Sudanese army pursuant to the Addis Ababa agreement in 1972 and gradually promoted to the rank of colonel. While in the Sudanese army, John Garang earned a Ph.D. at Iowa State University (U. S.) in agronomics, focusing his research on the adverse effects on southern Sudan of the planned Jonglei canal.
[132] Alier, Southern Sudan,pp. 264-66; email, D. H. Johnson, April 30, 2001.
[133] See Nelson Kasfir, "Why the Addis Ababa Agreement. . . ."
[134] Before the mutiny, Col. John Garang and Samuel Gai Tut had been running guns to Anyanya II. Kerubino had been fighting Anyanya II. See D.H. Johnson and G. Prunier, "The Foundation and Expansion of the Sudan People's Liberation Army," pp. 117-41.
[135] Nuer mutineers from the Sudanese army in Western Upper Nile did not all go to Ethiopia. Some stayed with their arms in their area to protect their people against the Baggara, who were increasing their attacks on Nuer and Dinka communities with the aid of government or Umma Party armament. Some armed Nuer engaged in banditry.
[136] One of the first to benefit from this Ethiopian support was Sadiq al Mahdi of the Umma Party, following the failed Umma Party coup attempt in Sudan in 1976. Email, D. H. Johnson, April 30, 2001; M.W. Daly, "Broken Bridge and Empty Basket: The Political and Economic Background of the Sudanese Civil War," in Civil War in the Sudan, p. 20.
[137] Carol Berger, "From Cattle Camp to Slaughterhouse: The Politics of Identity Among Cuban-Educated Dinka Refugees in Canada" (unpublished dissertation for the Master of Arts at the University of Alberta, Calgary, Alberta, Canada, October 2, 2001).
[138] Biel Torkech Rambang, Nuer representative in the U.S., Human Rights Watch interview, Washington, D.C., March 6, 2001.
[139] These were originally young Baggara armed men who traveled with their families' cattle herds to provide protection. Muraheleen is the Misseriya Baggara word for travelers, which now refers to all Baggara militias of southern Darfur and Kordofan. The Rizeigat word for this group of young men is fursan, or cavalry, although they are called muraheleen.
The government, which initially came to power in a military-Islamist coup in 1989, incorporated the muraheleen into their army (usually as Popular Defence Forces or PDF), used army officers to train and command them, and conducted joint military operations in the south with them, particularly along the Babanusa-Wau railway.
[140] The population around Mayom was about one person per square mile in peacetime, according to a development worker. Roger Schrock, formerly affiliated with the NSCC, Nairobi, Human Rights Watch telephone interview, Iowa, October 28, 1999.
[141] Social scientist David Keen observes that political and economic developments starting in the mid-1960s eroded the earlier system of protection by exposing the vulnerability of southern Sudanese to exploitative processes. At the same time these developments provided certain groups in the north, such as the marginalized Baggara, with both the motive and the ability to deepen this exploitation through the use of force. Keen, Benefits of Famine, pp. 18-19.
[142] The year 1982 saw the last efforts of the Sudanese government army to keep the peace-in particular the last clashes between government soldiers and the armed Baggara in Western Upper Nile (between Abiemnon and Mayom), wherethe government attempted to quell Baggara raids into the south. Roger Schrock, interview, October 28, 1999. The central government, however, continued to support peace conferences among northern and western ethnic groups who had disputes over cattle raiding and land use. See De Waal, "Militias," p. 146; Human Rights Watch, "Sudan," World Report 2000 (New York: Human Rights Watch, 1999), p. 80.
[143] The Ngok Dinka lived in Abyei District in southern Kordofan on the northern side of the north/south border. Keen, Benefits of Famine, p. 79. Their displacement appears related to Baggara land and water hunger rather than oil, but the Baggara were nonetheless favored by the government in this contest between Arab and African citizens.
[144] Human Rights Watch, Famine in Sudan, 1998:The Human Rights Causes (New York: Human Rights Watch, 1999), pp. 31-35.
[145] Among these Baggara were poachers; non-Baggara poachers also entered the Unity oilfield area in the early 1980s hunting for a herd of about seventy-six elephants between Pariang and Bentiu. The hunters caught most of these elephants, and by 1983 only twelve remained. To reach the herd, the nomads came from Muglad through Heglig to Unity, then back by the eastern Nuba Mountains. Roger Schrock, interview, October 28, 1999.
[146] All outsiders who have worked with the Nuer and other southerners note that the Nuer, on foot, cover twice as much territory as outsiders, in the same time. Therefore what is two hours walking (or "footing") for the Nuer is four hours walking for outsiders.
[147] Former combatant, Human Rights Watch interview, Kenya, August 3, 2000.
[148]Ibid.
[149] Former school administrator, interview, August 1-2, 2000.
[150] Ibid.
[151] Ibid. Bilpam, Ethiopia, had been the main training camp for southern rebels during the 1955-72 civil war, and was a base camp for Anyanya II in the 1970s and early 1980s. S. E. Hutchinson, interview, April 18, 2001.
[152] See former school administrator, interview, August 1-2, 2000. There were nine Bul Nuer sections on the 1954 taxpayers' list, organized into two main sections, the Nyang (also called Kwac) and Gok. D. H. Johnson, email, April 30, 2001. See former school administrator, interview, August 1-2, 2000.
[153] Ibid.
[154] The Ruweng (Panaru) Dinka on the east of the Block 1 oilfields tended to stay north of the river in Block 1 Nuer areas because there were no adjacent Dinka communities immediately to the south. Those Dinka who fled the Ruweng area occasionally went east to the Shilluk (Tonja) or to the Nuer areas of Duar and Nhialdiu south of Bentiu and the river. Ibid.
There is a pocket of Ruweng Dinka southeast of Tonja and south of the Nile, at Atar. Atar is an SPLA area from which its Dinka SPLA commander, George Atar, occasionally moves up into the Dinka area in northeastern Western Upper Nile (Block 1).
[155] Taban Deng was born in Kerial (Ker-riaal), a Leek village near the current Unity oilfield that has since been destroyed. He identifies himself as (western) Jikany Nuer. Taban Deng Gai, "Talisman False Community Development Claims in Western Upper Nile," South Sudan Post (Nairobi), February 2001, p. 12; Taban Deng, Human Rights Watch interview, Nairobi, April 9, 2001. The South Sudan Post is the only news periodical dedicated to events in southern Sudan. It is published in Nairobi and its editor is John Luk, an attorney, political activist, former commander in Lou Nuer areas, and sometime member of the SPLM/A.
[156]Taban Deng, interview, July 26, 1999. Another source said that in 1983, Chevron paid some compensation to the dislocated when it was building roads. Simon Kun, executive director, Relief Association of Southern Sudan (RASS), Nairobi, July 23, 1999.
[157] Hutchinson, Nuer Dilemmas, pp. 34-36. The author conducted fieldwork among the Leek Nuer west of Bentiu and north of the Bahr El Ghazal (Nam) River between December 1980 and February 1983. Sharon E. Hutchinson, Human Rights Watch telephone interview, Madison, Wisconsin, April 18, 2001.
[158] Hutchinson, Nuer Dilemmas, p. 5.
[159] Africa Watch, Denying "The Honor of Living"-Sudan: A Human Rights Disaster (New York: Africa Watch, 1990), p. 88.
[160] Ibid. Kala azar, a parasitic disease also known as visceral leishmaniasis, causes chronic fever, swelling of the spleen and liver, anaemia and diarrhea. If left untreated, more than nine out of every ten people infected die, usually from uncontrolled bleeding. Sudan has suffered many epidemics of the disease in recent history, resulting in tens, if not hundreds, of thousands of deaths. Treatment must be administered by trained health workers at regularly spaced intervals to have effect, and the medicine may be harmful if not used correctly. World Health Organization (WHO), "Leishmaniasis," Communicable Disease Surveillance and Response, http://www.who.int/emc/diseases/leish/leisdis1.html. (accessed April 30, 2001)
[161] Ibid.
The acacia forest is the prime habitat for the sandfly which carries the
parasite which causes kala azar; Médecins Sans Frontières (MSF), "Violence,
Health and Access to Aid in Unity State/Western Upper Nile,"
April 2002, pp. 20-23.
[162] According to MSF, the four factors associated with the spread of the disease are all related to the war: spread of the sandfly (re-growth of the acacia forests due to reduced cattle grazing led to an increase in the sandfly population, becoming a large vector pool for the parasite); introduction of the parasite (military moving within the area and between Ethiopia and Sudan in the mid-1980s); increased transmission of the disease (due to war and displacement, people seeking safety and foraging for food in the acacia forests); and high susceptibility to the disease (mass starvation in the mid-late 1980s, no health care services, limited humanitarian access). Ibid., pp. 20-21.
[163] Alier, Southern Sudan, p. 243.
[164] Africa Watch, Denying "The Honor of Living," p. 88.
[165] Carol Berger, "Oil and 'Spearchuckers,'" Economist (London), 1985 (author's copy).
[166] Carol Berger, "Drive to re-open Sudan oilfield," Africa Analysis (London), Muglad, Southern Kordofan, June 10, 1988.
[167] Muriel Allen, "Sudan: Oil a Political Weapon," July 11, 1997.
[168] Roger Schrock, interview, October 28, 1999.
[169] "Funeral Scheduled at Poteau for Oklahoman Shot in Sudan," Daily Oklahoman (Oklahoma City), December 8, 1983.
[170] Alier, Southern Sudan, p. 243.
[171] Biel
Torkech Rambang, Nuer representative in the U.S., Human Rights Watch
interview, Washington DC, March 6, 2001. Several
others gave similar versions of the event, all mentioning Bul Nyawan as
commander. "Anyanya II's commander Bul Nyawan attacked Chevron and closed it
down. He was fighting the Baggara since 1981 and closed down Chevron in 1983 [sic].
His deputy in that attack was Paulino Matiep. Also James Lial Dieu, who is with
SPDF now." James Kok, Nairobi representative for SPDF, Human Rights Watch
telephone interview, Nairobi, March 15, 17, 2001.
[172] "Chevron to Resume Sudan Operations," Dow Jones News Service (New York), March 9, 1984.
[173] Ibid.
[174] "Sudan Accord With Saudi Financier Puts Pressure on Chevron to Develop Oil Fields," Wall Street Journal (New York), November 1, 1984.
[175] See John Ashworth, Sudan Focal Point-Africa, Human Rights Watch interview, Nairobi, August 10, 2000. Ashworth was one of the priests. The other foreigner, Fr. Peter Major, reportedly now serves in northern Sudan.
[176]"Sudan Won=t Receive Any New IMF Loans," Wall Street Journal (New York), February 4, 1986. In 1982, the government had received a rescue package from the IMF, World Bank, and donor governmentsamounting to $ 1.5 billion a year in aid and, at the time of the default, the Sudanese had an accumulated foreign debt of U.S. $ 9 billion requiring annual interest payments of U.S. $ 800 million. David B. Ottaway, "U.S. Suspends $ 194 Million In Aid to Sudan," Washington Post, February 17, 1985; "Sudan Asks U.S. Help to Pay IMF Debt," AP, December 29, 1985; "Sudan Asks U.S., Saudis To Pay Arrears to IMF," Wall Street Journal (New York), Khartoum, December 30, 1985; James R. Peipert, "Sudan Near Agreement with International Monetary Fund," AP, January 25, 1986. The U.S. did assist Sudan by asking the IMF to help reschedule the debt several times. D. H. Johnson, email, April 30, 2001.
[177] David
B. Ottaway, "U.S. Suspends $ 194 Million in Aid to Sudan," Washington Post,
February 17, 1985; Charles T. Powers, "Washington Pushes for Reform; Debt,
Drought, and Chaos Plague U.S. Ally Sudan," Los Angeles Times, February
28, 1985. In 1990, the IMF issued a declaration of
noncooperation against Sudan, which remained in place until 1999. The IMF
suspended Sudan's voting and related rights in 1993 and did not reinstate them
until 2000, after the government had made certain reforms and paid some IMF
debt, and oil production and export had begun. IMF, "IMF Lifts
Declaration of Noncooperation from Sudan," News Brief No. 99/52, Washington,
DCWashington, D.C., August 31, 1999;
IMF, "IMF Lifts Suspension of Sudan's Voting and Related Rights," Press ReleaseNo. 00/46, Washington, DCWashington, D.C.,
August 1, 2000. Sudan's problems with the IMF coincided with its
failure to develop its oil resources. See, e.g., IMF, "Sudan: Recent
Economic Developments," Staff Country Report No. 99/53, Washington, DCWashington,
D.C., June 1999.
[178] Blaine Harden, "Rebel Chief Coming for Talks, Sudan Says Leader's Aides Deny It, Say War Is On," Washington Post, April 19, 1985.
[179] "Sudan Warns Chevron over Israeli Goods," San Francisco Chronicle, June 12, 1985. Chevron responded that the import of Israeli parts had been unintentional and the parts would be sent back to England.
[180] Apparently, en route to his office, Clement stopped his car in front of the PLO office to listen to a company message on his car radio, commonly used for communications within Sudan. This was mistakenly seen as a surveillance operation. "Sudanese Detain, Release American,"San Diego Union-Tribune, October 28, 1985.
[181] "Chevron to Suspend Exploration in Sudan," Dow Jones News Service (New York), December 24, 1985.
[182] The Umma Party continues to draw most of its support from the Ansar (Sufi) religious brotherhood in Omdurman and western Sudan, and the DUP most of its support from Khatmiyya (Sufi) brotherhood in the central Nile valley and eastern Sudan.
[183] An internal power struggle led to the formation of a breakaway party, the Popular National Congress Party, in June 2000. Mohamed Osman, "Sudan Islam Leader Forms New Party," AP, Khartoum, June 27, 2000.
[184] The Timsa Battalion was commanded by former Sudanese army officer Arok Thon Arok (deceased 1998), and the Tiger Battalion by Salva Kiir Mayardit, now chief of staff of the SPLA.. See, e.g., James Kok, interviews, March 15, 17, 2001; Biel Torkech Rambang, interview, March 6, 2001.
[185]While they were still in Anyanya II in the early 1980s, Maj. Bul Nyawan and his deputy, Cmdr. James Lial Dieu, tried to fend off the Baggara. Bul Nyawan joined the SPLM/A after it arrived in Western Upper Nile. Both sides, the SPLA and the Baggara muraheleen, sustained heavy losses in the March 1985 battle but subsequently the Baggara enterred into a peace agreement with Riek Machar, SPLA zonal commander. Bul Nyawan, who is fondly remembered by the Nuer, was killed in that battle. Biel Torkech Rambang, interview, March 6, 2001; James Kok, interviews, March 15, 17, 2001; RASS officer and former school administrator, interview, August 1-2, 2000.
[186] Riek Machar, former SPLA zonal commander of Western Upper Nile, Human Rights Watch interview, Nairobi, August 8, 2000. He said his forces, after walking several days, were exhausted when they reached Heglig and withdrew in the face of the fresh government troops based at the oilfield.
[187] Elijah Hon Top, interview, July 26, 1999.
[188] Former soldier under Tito Biel, Human Rights Watch interview, Kenya, August 21, 1999.
[189] Taban Deng, interview, July 26, 1999.
[190] Paulino Matiep allegedly saved Omar El Bashir's life on at least one occasion. During a traditional Nuer celebration in 1989, Lieutenant General Bashir (then serving in Mayom) reportedly joined in firing his gun into the air and accidentally shot dead a young Nuer woman. Her relatives were ready to kill him when Cmdr. Paulino Matiep intervened, paying cows to the family in compensation. President Sadiq al Mahdi accused Lieutenant General Bashir of killing the girl. RASS officer and former school administrator, interview, August 1-2, 2000. There are several similar versions of this episode.
[191] Deborah Scroggins, "Sudan: Waiting for Majaa Reet Goach: Nuer Tribesman," Atlanta Journaland Constitution, March 10, 1991, based on interviews in Rok-Rok, Sudan on December 5, 1990. In 1999, there were three garrisons in Bentiu: one near the civilian hospital (two battalions), one near the primary and secondary school complex (one battalion), and one at the end of the airport on the Bahr El Ghazal (Nam) River (one battalion). Thomas Duoth, SSDF military intelligence official, Human Rights Watch interview, Nairobi, July 22, 1999.
[192]Jallaba is an Arabic term for merchant, trader, or importer; in nineteenth and twentieth century Sudan it applied to itinerant petty merchants. In southern Sudan it has the additional (historical) meaning of slave trader, and applies generally to all northern Sudanese. Jallabiya refers to their typical robe of white cotton.
[193] Scroggins, "Sudan: Waiting for Majaa Reet Goach." The interviewee also told the journalist, "The jallaba want us to move away from there. The oil was found that time by the white people. But it was not functioning well. The jallaba, he is fighting for the oil. He cannot leave the oil there. That is why he is fighting people there. And we also know the oil is ours. That is why there is heavy fighting." Scroggins, Human Rights Watch telephone interview, Atlanta, May 15, 2000.
[194] Former combatant, interview, August 3, 2000.
[195] The third commander, Dr. Lam Akol, is Shilluk. He has written about his experiences inside the SPLM/A in Dr. Lam Akol, SPLM/SPLA: Inside an African Revolution (Khartoum: Khartoum
University Press, 2001).
[196] See Nyaba, The Politics of Liberation in South Sudan, p. 94. Nyaba blames the breakaway faction for initiating these summary executions and the attacks on civilians that followed.
[197] The Riek Machar faction and Nuer armed civilians (the White Army) conducted a massive series of raids into Dinka Bor County in Upper Nile, massacring about 2,000 civilians in the course of looting hundreds of thousands of cattle in 1991. Independent interviews at the time suggested that the raiders may have been partly inspired by perceived favoritism of the relief community, which was believed to be allocating more food to the Dinka than the Nuer. Douglas H. Johnson, The Root Causes of Sudan's Civil Wars (Oxford: James Currey, 2003), pp. 94-99.
[198] Human Rights Watch/Africa, Civilian Devastation: Abuses by All Parties to the War in Southern Sudan (New York: Human Rights Watch, 1994), p. 146. The triangle was formed by the villages Ayod, Waat, and Kongor, all in Upper Nile on the Dinka/Nuer border on the East Bank of the Nile. The first two villages are Nuer, the third Dinka.
[199] Jok Madut Jok and Sharon E. Hutchinson, "Sudan's Prolonged Civil War and the Militarization of Nuer and Dinka Ethnic Identities" (Loyola Marymount University, Los Angeles, and University of Wisconsin-Madison, 1999), pp. 10-11. By some estimates this fighting, until it was brought to a close, was more deadly than the SPLA-Sudanese government fighting. Ibid.
[200] Jok and Hutchinson, "Sudan's Prolonged Civil War," p. 6.
[201] Jok and Hutchinson, "Sudan's Prolonged Civil War," pp. 10-12. In fact, women and children had been killed in some Nuer-Dinka clashes long before 1991. But these tactics were not considered fair, and they were not the norm.
[202] The subordination of the chiefs to the military had begun in the 1930s. D. H. Johnson, email, April 30, 2001.
[203] Nyaba, The Politics of Liberation, p. 3. A RASS official said that they only received arms from the government from 1991-93. RASS official, August 2000 (anonymity requested).
[204] According to the Indian Ocean Newsletter, Khartoum sought 100 percent of the revenues for ten years and Cmdr. Lam Akol, representing the Riek Machar faction, proposed a 50-50 split of oil revenues for two years. No agreement on oil revenues was reached with this faction. "Sudan: Significant Air Crash," Indian Ocean Newsletter (Paris), September 11, 1993.
[205] Hereinafter the SSUM/A will be referred to as the Paulino Matiep militia, in order to limit the use of acronyms.
[206] Robert DiNardo, "Private Sudan Co. Buys Chevron Stake," Platt's Oilgram News (New York), June 16, 1992.
[207] "Chevron Sells Exploration Interests in the Republic of Sudan," PR Newswire, San Francisco, June 15, 1992. This was an enormous loss for Chevron, which together with Shell had sunk about U.S. $ 1 billion into the project. As a result of the sale, Concorp acquired all petroleum exploration and production rights in the concession, which included the exploration blocks in the Melut and Muglad Basins. Concorp was said to be partly owned by Mohamed Abdallah Jar Al Nabi, a Sudanese national. "APS Review Oil Market Trends," Arab Press Service Organisation, June 7, 1993. Concorp then sold blocks off the concession to various buyers, with the required approval of the Sudanese government.
Concorp, a private multinational company registered in Sudan, Uganda, the U.S., and India, later became the owner of the first private-sector oil refinery in Sudan, located in the Khartoum suburb of Al Shajarah, inaugurated on June 30, 1999. "Sudan's First Private Sector Oil Refinery Inaugurated," AFP, Khartoum, June 30, 1999.
[208] Headed by a Pakistani national, Latki Khan, State Petroleum was, according to an Arakis officer, "a paper corporation formed by Canadian Muslims primarily to seek the Sudanese concessions that had been given up by Chevron." "Arakis' Partner Gets Approval in Sudan," Platt's Oilgram News (New York), July 9, 1993.
[209] "Little-Known Firm in Canada Granted Sudan Properties," Platt's Oilgram News (New York), December 8, 1992.
[210] "Sudan Financing Is Reduced," Platt's Oilgram News (New York), New Orleans, March 30, 1993.
[211] "Arakis' Partner Gets Approval in Sudan," July 9, 1993.
[212] "Arakis Partner Gets Approval in Sudan," July 9, 1993 (referring to approval of development plans).
[213] Arakis spent only U.S. $ 125 million in the five years between 1993 and 1998, compared to the almost U.S.$ 499.5 million in capital expenditures that Talisman put into Sudan in two and a half years, 1998-2000-almost four times the investment in half the time; Talisman Energy, "Background Paper," pp. 4, 8; Talisman Energy press release,"Talisman Generates a Record $ 2.4 Billion in Cash Flow $ 906 Million in Net Income," Calgary, March 6, 2001.
[214] Arakis reported it had secured financing from a Saudi prince. Its price jumped, some insiders profited, then it developed that neither the money nor the royal connection was there, according to the British Columbia Securities Commission (BCSC)'s findings. Arakis had to pay a fine of Canadian $ 250,000 or about U.S. $ 200,000, and several persons associated with the scheme were penalized. BCSC, "In the Matter of the Securities Act (R.S.B.C.) 1996, c. 418, and In the Matter of Arakis Energy Corporation," Agreed Statement of Facts and Undertaking, May 12, 1998. Former chief executive officer James Terrence Alexander had to pay Canadian $1.2 million in fines for his role in these securities law breaches. Ibid.; "In the Matter of James Terrence Alexander," Agreed Statement of Facts and Undertaking, Vancouver, B.C., February 23, 1999; Allan Dowd, "Former head of Canada oil firm fined for insider trades," Reuters, Vancouver, February 24, 1999.
[215] "Sudan Pipeline Operational," Petroleum Economist (London), August 1, 1999, p. 15.
[216] Pratap Chatterjee, "Canada-Sudan: Activists Condemn Oil Company's Operations in Sudan," Inter Press Service (IPS), San Francisco, August 26, 1997, citing Martin Cohn, a reporter at the Toronto Star who had visited the site.
[217] Arakis Energy Corporation press release, "Arakis Forms Sudan Consortium,"Canadian Corporate News,December 6, 1996.
[218] Petronas Corporate Affairs press release, "Prime Minister Opens Petronas Office and Launches Petronas Operations in Sudan," Khartoum, May 15, 1998.
[219] James Norman, "Arakis Pulls In Two Hefty Partners for Sudan Work," Platt's Oilgram News (New York), December 9, 1996.
[220]The agreement awarded a management consultant services contract for the pipeline and export terminal project to a 60 percent subsidiary of Petronas. "Prime Minister Opens Petronas Office . . .," May 15, 1998.
[221] "Sudan Deal Signed by Arakis, Government, and Partners," Platt's Oilgram News (New York), March 4, 1997; Paul Knox, "Fighting in Sudan Threatens Oil Project-Despite Ottawa's Pleas, Calgary Firm Won't Move Workers to Safer Site," Globe and Mail (Toronto), February 14, 1998; Starr Spencer, "Arakis, Unable to Raise Funds, Forced to Seek Sale," Platt's Oilgram News (New York), July 17, 1998.
[222] Harker report, pp. 10, 47.
[223] Ibid., p. 10.
[224] Ibid., pp. 47-48.
[225] Ibid., p. 48.
[226] Ibid., p. 11. Athonj (El Toor) village was later forcibly removed by the government soldiers. See below.
[227] Since 1983, Ruweng (Panaru) County had been without any assistance from the outside world whatsoever. The security situation did not allow for any project to be implemented, even an emergency project, although the need was great. In 1993 and in 1994 it was assessed for civilian health and nutrition status by different agencies operating from the southern sector of Operation Lifeline Sudan. At the time relief airstrips were in Nyarweng, Awet, Ruweng (Panaru) County, Western Upper Nile. Security continued to be the main problem for those wishing to bring help to the seriously ill population. In 1994 and 1995 the Italian medical NGO Comitato Collaborazione Medica (CCM) visited the area three times, bringing medicine and medical equipment, intending to build a hospital in the Padit area. In 1995 two CCM doctors were captured by a government militia and taken to Khartoum, bringing to an end the work of CCM in the area. Also as a result of denial of airstrip clearance from the government of Sudan, no NGOs visited the area between 1995 and January 1998, when an agency assessment team visited; a U.N. agency assessed food needs in December 1997. Human Rights Watch, Behind the Red Line: Political Repression in Sudan, pp. 334-38; Human Rights Watch, CivilianDevastation, pp. 149-51; Agency assessment, Padit, Ruweng County, Western Upper Nile, Sudan, January 23-February 2, 1998 (anonymity requested). (An alternative spelling for Padit is Padiet, used in the assessment.)
[228] The sixteen villages were Ling, Awuc, Monykwo, Panpeth, Nyanjunga, Biem, Nyongjac, Kaigo, Ruckshuk, Panret, Kong, Pashuak, Lele, Agarak, and Patuok. Agency assessment, Padit, 1998.
[229] 1993 report annexed to Agency assessment, Padit, 1998.
[230] Agency assessment, Padit, 1998. These attacks remain to be investigated in more detail.
[231] Ibidt.
[232] Agency document, "Nyarweng Narrative Proposal," accompanying August 10-14, 1994 assessment (anonymity requested).
[233] Ibid.
[234] Agency assessment, Padit, 1998.
[235] The SPLM/A-United (earlier the SPLM/A-Nasir faction of rebels led by Riek Machar) was renamed the SSIM/A at a special convention following a Nuer reconciliation conference held in Akobo, Upper Nile in 1994.
[236] From 1987-92, Kerubino was held in a series of SPLA detention centers, in prolonged arbitrary incommunicado detention for alleged coup plotting. He escaped and joined Riek Machar's faction and later created his own force in Gogrial, a garrison town in Bahr El Ghazal. Since 1994 he also allied with the government of Sudan. See Human Rights Watch, Famine in Sudan, pp. 14-15.
[237]The Political Charter was negotiated by Taban Deng, later governor of Unity state in December 1997, and Riek Gai, governor of Jonglei at the same time. SSDF officer, Human Rights Watch interview, Wunlit, Bahr El Ghazal, March 1, 1999.
[238] Also called the Sudan Peace Agreement. Signatories in addition to Riek Machar and Commander Kerubino included Cmdr. Kwac Makuei Mayar (South Sudan Independents Group, Dinka of Aweil), Dr. Thisphohis Ochang Loti (Equatoria Defence Force), Samuel Aru Bol (a southern opposition politician with the Union of Sudan African Parties (USAP), based in Khartoum;a Dinka from Rumbek, he attended Wunlit and died in Khartoum in 2000), and Arok Thon Arok Kongor (Chairman, Bor Group, Dinka from Bor; he was an officer in the Sudanese army after the first Anyanya war, before joining the SPLA; he died in an accidental crash of a government military plane in 1998). Cmdr. Kwac Makuei was the target of an apparent government assassination attempt in Aweil in early 1998 and fled to Khartoum (he had already defected twice from the SPLM/A). His thirteen Dinka bodyguards were captured at his Aweil home when he was away. They were taken to the army garrison and summarily executed by northern government soldiers. Kwac Makuei, Human Rights Watch interview, Khartoum, July 26, 1999.
Signing the agreement shortly after Riek Machar were a Nuba Mountains faction, led by Muhammad Harun Kafi, and a Shilluk faction headed by Dr. Lam Akol. See Human Rights Watch, Famine in Sudan, p. 56.
[239]The National Democratic Alliance (NDA) included many political parties and armed groups from the north, east, and west of Sudan, but the SPLM/A was the only representative of the south.
[240] Nyaba, Politics of Liberation, p. 110.
[241] Khartoum Peace Agreement, Ch. 6, Sec. 8 (i), Khartoum, April 21, 1997.
[242] Ibid., Ch. 3, Sec. 3 (a) ((2) and (19).
[243] Ibid., Ch. 3, Sec. 3 (b) ((1).
[244] Elijah Hon Top, interview, July 26, 1999.
[245]This involved attacks on the SPLA in Kongor, Upper Nile, as well as fighting at Pagok on the Ethiopian border against Ethiopian government forces and Nuer and Anuak Ethiopian militias friendly to the SPLA. Battles also took place against the SPLA in Fangak, Jokau, Mading, and Maban (Adar and Punj), Eastern Upper Nile. Elijah Hon Top, interview, July 26, 1999.
[246] Elijah Hon Top, interview, July 26, 1999.
[247] An oil industry study supports this time frame of activity in this oilfield. El Toor #3, Block 1A, Unity Exploration Area (Muglad Basin) was spudded on February 20, 1998 and completed as a suspended oil well on March 23, 1998. IHS Energy Group, "Sudan Annual Synopsis 1998," scouting report, http://www.ieds.com/Scout_Reports/synopsis98/esasyn/sudtxt.htm (accessed November 15, 2000). (To spud is defined as "to begin to drill an oil well.") This was only one of the wells in the El Toor field.
[248] The removal or relocation of the village Athonj is borne out by satellite images that Talisman commissioned to prove that there was no displacement from its areas. According to testimonies of villagers, soldiers came twice to remove people; those witnesses were removed on the second time, in 1999. See below, "Government Army Displaces Villages Near El Toor Oilfield, Block 1, October 1999." "Kalagate Imagery Report, Sudan Oilfield Exploration Concession,"April 2001, published by Talisman Energy, Calgary. Inside the cover is the report of Geoffrey John Oxlee, Kalagate Imagery Bureau, "Report KIB/035-1/2001, Subject: Sudan Oilfield Exploration Concession," April 2, 2001, p. 7 and Figure 4: El Toor-1 & 4.
[249] Elijah Hon Top, interview, July 26, 1999.
[250] See Human Rights Watch, Famine in Sudan, pp. 58-60.
[251] SSDF
intelligence officer who was one of the detainees, Human Rights Watch interview,
Wunlit, Bahr El Ghazal, March 1, 1999; Biel Torkech Rambang, Human Rights Watch
interview, Washington, DCWashington, D.C.,
March 14, 2000.
[252]SSDF officer, interview, March 1, 1999; James Kuong Ninrew, Presbyterian Relief and Development Agency, Human Rights Watch interview, Nairobi, February 16, 1999.
[253] Relief agency assessment in Nhialdiu, Leek district, Western Upper Nile, May 12-15, 1998, dated May 16, 1998 (anonymity requested).
[254] SSDF officer, interview, March 1, 1999.
[255] James Kuong, SSDF officer, Human Rights Watch interview, Nairobi, February 16, 1999.
[256] "Kerubino Gives NIF a Run for Their Money while SPLA Watches," Sudan Democratic Gazette (London), Year IX, No. 93, February 1998. The Sudan Democratic Gazette was an opposition paper published in London for several years by Bona Malwal, a veteran southern politician and minister of information during the period of southern autonomy.
[257] "38 Reported Dead in Fighting Between Sudan Forces," Reuters, Khartoum, January 19, 1998.
[258] The Sudan Democratic Gazette noted this promotion in 1996.
[259]Maj. Gen. Paulino Matiep was reportedly given 2,000 AK 47 rifles by the government of Sudan and nine 12.7mm AAAs (heavy machine guns) in 1998. The next year the government gave this militia 3,000 AK 47s, along with sixty PKMs (machine guns) and ammunition for them. Thomas Duoth, interview, July 22, 1999.
[260] State Minister of Foreign Affairs Ghazi Salah Eldin Atabani, Human Rights Watch interview, Khartoum, May 4, 1995.
[261] Riek Machar, interview, Nairobi, August 8, 2000.
[262] Distant from the oil explorations in Block 5A, intermittent but deadly civilian fighting over cattle occurred between the Nuer and the Dinka on their Western Upper Nile/Bahr El Ghazal border after 1991. See Jok and Hutchinson, above.
[263] Chevron also discovered oil among other places in Adok, a port on the Nile, south of Bentiu; in areas south of Adok and north of Nyal; in Marol, in the Sudd one hour on foot southeast of Ler; and in Makuir, south of Ler and east of Adok. Gideon Bading Jagei, head chief of an Adok section, Human Rights Watch interview, Nyal, Western Upper Nile, August 20, 1999. Most of these were in Dok Nuer areas. Bang is in Leek Nuer and Nyal in Nyuong Nuer territory.
[264] In Sudan, Lundin Oil AB initially used its wholly owned subsidiary, the International Petroleum Company (IPC), and then used its wholly owned subsidiary IPC Sudan Ltd. Later its successor company used the name Lundin Sudan.
[265] Lundin Oil press release, "Lundin Oil Spuds First Well in Sudan," Business Wire (Vancouver), April 8, 1999.
[266] After the Canadian NGOs began pressing the Canadian government to act on Arakis, IPC (then listed on the Vancouver Stock Exchange (VSE) of Canada) merged with Sands Petroleum AB of Sweden. Sands, the surviving corporation, was not listed on the VSE. Both were controlled by the Lundin family, and the company was renamed Lundin Oil AB in May 1998. With its head office in Geneva, it was listed on the U.S.-based NASDAQ and the Stockholm Stock Exchange until the reshuffle with Talisman in June 2001, below. Adolph Lundin "controls a web of small exploration companies, some of which are run by his Vancouver-based son Ian." Mathew Ingram, "Signs of Life on Planet Arakis," Globe and Mail (Toronto), Calgary, June 23, 1998.
[267] Muriel Allen, "Sudan: Oil A Political Weapon," July 11, 1997.
[268] In June, 2001, Talisman and Lundin agreed to a corporate rearrangement whereby Talisman would buy the outstanding shares of Lundin and Lundin would spin off to a new company its Sudan and Russian assets, to be owned by the Lundin family and others. The Sudan assets included Lundin's interests in Blocks 5A and 5B and its 100 percent interest in the Halaib Block in northeast Sudan bordering (and contested by) Egypt. The new company, called Lundin Petroleum AB, started trading on the New Market at Stockholmsborsen but was not listed on any U.S. stock exchange. At that time proposed legislation on Sudan oil-related capital market sanctions that might apply to Lundin was pending in the U.S. Congress. Lundin Petroleum retained the same board and.management team as Lundin Oil. For simplicity, Lundin Petroleum is also referred to as Lundin. Lundin Petroleum, "Report for the period ended December 31, 2001," http://www.Lundin-petroleum.com/Documents/qr_4_2001_e.pdf (accessed May 28, 2002); Lundin Oil press release, "Lundin Oil Recommends Acceptance of Public Cash Offer from Talisman and Spins Off Key Exploration Assets into a New Swedish Oil Company," Stockholm, June 21, 2001.
[269] Lundin noted that the GNPOC 1,540 kilometer-long pipeline, with capacity to pump 250,000 barrels of oil per day (and an expected maximum capacity of 450,000 barrels per day with the addition of several pump stations), was completed in August 1999. Lundin Oil, "Sudan: Operation Fact Sheet-October 2000," (accessed November 28, 2000).
[270] Lundin Oil press release, "Lundin Oil Spuds First Well in Sudan," .
[271] Lundin Oil AB: Sudan, http://www.Lundinoil.com/eng/operations/sudan/index.html (accessed November 28, 2000).
[272] Talisman CEO Jim Buckee, Human Rights Watch interview, Calgary, Alberta, Canada, February 3, 2000.
[273] When the U.N. Special Rapporteur on human rights in Sudan in 2001 cited oil-related destruction near Rier [Ryer], Lundin responded that "Rier" was not in Block 5A. Human Rights Watch has concluded that Ryer is the same location where the company had its first drilling operation, which the company called "Thar Jath."
Not only do former residents identify the location of the drilling operation-and Lundin admittedly had only one drilling rig in place at the time-but the Nuer forces which attacked the drilling rig in 1999 said that it was in Ryer.
A 1939 map drawn up by the British War Office shows that Ryer is the only village identified in that vicinity. Map, "Sudan," by Geographical Section, General Staff, No. 2692, Published by the War Office, London, 1914, 4th Ed. 1939.
A British district commissioner in the area, Percy Coriat, listed "Tharjath & Ryer" in his handing-over notes to his successor in 1931, where Ryer was listed as a Jagei Nuer area of about 5,195 (male) taxpayers. Document 4.1, reprinted in Percy Coriat, Governing the Nuer: Documents in Nuer history and ethnography, 1922-1931, ed. D. H. Johnson (Oxford: Journal of Anthropology Society of Oxford, 1993), p. 161. The spelling Human Rights Watch uses for the location of the first Lundin exploratory drilling in Block 5A is "Ryer." This is the oldest spelling found.
Ultimately Lundin discovered that its rig was indeed
in a place known as Ryer. Christine Batruch, Lundin, Human Rights Watch
interview, Washington DCWashington, D.C.,
November 21, 2001. Another Rier, a relief delivery location in Bul Nuer
territory near Mayom, was heavily bombed by the government in May 2002. See
below. Rier or ryer means "big shady tree" in Nuer.
[274] Map, "Sudan: Tribal Map, Sheet 3," Sudan Survey Department, Khartoum (1946, corrected 1969) (U.S. Library of Congress collection).
[275] Guk is about two hours east of Koch on foot, about a seven hours' walk (for the Nuer) north of Ler town. Ler chief, Human Rights Watch interview, Khartoum, July 26, 1999.
[276] William Magany, interview, August 18, 1999; Ler chief, interview, July 26, 1999.
[277] According to Paul Wilson, a twenty-five-year British army veteran working for Rappaport as security consultant to Lundin, the oil company did not gain access to Block 5A from the authorities until late December 1997, due to obstruction by lower level government officials. The company's equipment arrived in January-February 1998 from Khartoum by barge. Paul Wilson, Human Rights Watch telephone interview, Nigeria, May 16, 2001.
[278] Lundin Oil, "Sudan: Operation Fact Sheet-October 2000," (accessed November 28, 2000). Increasingly sophisticated seismic techniques-the reflection and refraction of sound waves propagated through the earth-reveal details of the structure and interrelationship of various layers in the subsurface that point to the probable presence of petroleum. Microsoft Encarta Encyclopedia, "Petroleum: Exploration." http://encarta.msn.com/encnet/refpages/RefArticle.aspx?refid=761576221&sec=5#s5 (accessed May 2, 2001).
[279] Paul Wilson, interview, May 16, 2001.
[280] William Magany, interview, August 18, 1999.
[281] Isaac Magok Gaalwak, Ler paramount chief (Dok Nuer), Human Rights Watch interview, Paliang, Tonj County, Bahr El Ghazal, southern Sudan, August 14, 1999.
[282] Michael Wal Yang, RASS coordinator Ler province, Human Rights Watch interview, Nyal, Western Upper Nile, August 18, 1999.
[283] SSDF officer, interview, August 3, 1999.
[284] Riek Machar, interview, August 8, 2000.
[285] Taban Deng, interview, July 26, 1999. Taban Deng and others frequently referred to Lundin by its old name, IPC.
[286] The Sudanese government authorities said that Lundin (IPC) needed the protection of their troops. Lundin's security consultant Paul Wilson who was opposed to the Khartoum approach and argued against it, believed that, in retaliation, the Khartoum government started to block the Lundin (IPC) supplies coming overland through Bentiu, including food for the work crews. Lundin then successfully resorted to helicopters for supplies. Paul Wilson, interview, May 16, 2001.
[287] Ler chief, interview, July 26, 1999.
[288] Relief agency assessment in Nhialdiu, Leek district, Western Upper Nile, May 12-15, 1998, dated May 16, 1998 (anonymity requested).
[289] Ler chief, interview, July 26, 1999.
[290] William Magany, interview, August 18, 1999.
[291] WFP, "Sudan Bulletin No. 83: April 18-24, 1999," Rome, May 11, 1999.
[292] This took place in the first half of 1998. Paul Wilson, interview, May 16, 2001.
[293] William Magany, interview, August 18, 1999.
[294] SPLA Cmdr. William Nyuon Bany, a Nuer, held Ler for twelve hours in 1992 against Riek Machar's government-aligned forces. William Nyuon was then the highest-ranking Nuer in the SPLM/A, before he defected in August 1992 to Riek Machar's forces. He rejoined the SPLM/A in 1995 and died in operations in early 1996, fighting against SSIM Cmdr. Elijah Hon Top. Elijah Hon Top, interview.
[295] MSF, "Violence,
Health and Access to Aid in Unity State/Western Upper Nile, Sudan,"
April 2002, p. 10. MSF-Holland opened a kala azar treatment center in Ler town
in 1989 when it discovered that all 800 kala azar cases it was treating in
Khartoum originated in Western Upper Nile/Unity State, north of Ler. Ibid.
[296] Sharon E. Hutchinson, Human Rights Watch telephone interview, Madison, Wisconsin, March 22, 2000. The officer, whose name cannot be disclosed, told Hutchinson in June 1999 about the incident.
[297] Ibid.; Elijah Hon Top, interview, July 26, 1999.
[298] Paul Wilson, interview, May 16, 2001.
[299] S.E. Hutchinson, interview, March 22, 2000.
[300] Elijah Hon Top, interview, July 26, 1999; S.E. Hutchinson, interview, March 22, 2000.
[301] Elijah Hon Top, interview, July 26, 1999.
[302] S. E. Hutchinson, interview, March 22, 2000.
[303] Ibid.
[304] Ibid.
[305] Elijah Hon Top, interview, July 26, 1999.
[306] Ibid.
[307] "Civilians Displaced by Sudan Fights," AP, Khartoum, July 27, 1998.
[308] Michael Wal, interview, August 18, 1999.
[309] William Magany, interview, August 18, 1999.
[310] Isaac Magok, interview, August 14, 1999.
[311] Michael
Wal, interview, August 18, 1999. Others who were killed in June 1998 in Ler
included local traders and one old woman who was burned inside her house. In
addition, when Maj. Gen.Maj. Gen. Paulino Matiep's
forces suddenly arrived, three boys were killed in cross fire. Martha N., Human
Rights Watch interview, Nyal, Western Upper Nile, southern Sudan, August 18-20,
1999.
[312] Michael Wal, interview, August 18, 1999.
[313] S.E. Hutchinson, interview, March 22, 2000.
[314] Gideon Bading, interview, August 20, 1999.
[315] "Aid Agencies Pull Out of Sudanese Region," AFP, Nairobi, July 7, 1998; MSF press release,"Insecurity Hinders Provision of Humanitarian Assistance in Southern Sudan," Nairobi, July 7, 1998.
[316] U.N. OLS (Southern Sector), "Emergency Update No. 12," Nairobi, July 17, 1998. OLS is the U.N. umbrella agency coordinating the relief effort for Sudan.
[317] Michael Wal, interview, August 18, 1999. Two rotations means two round-trip flights in one day.
[318] Paul Wilson, interview, May 16, 2001.
[319] Michael Wal, interview, August 18, 1999.
[320] Alfred Taban, "Pro-government Factions Clash in Sudan," Reuters, Khartoum, July 7, 1998.
[321] "Inter-faction Fighting Reported in Southern Sudan," AFP, Khartoum, July 7, 1998.
[322] "Pro-government Factional Fighting Still Rages in South Sudan," AFP, Khartoum, July 12, 1998.
[323] "Nearly 50 Die in Sudan Clashes," AFP, Khartoum, July 19, 1998.
[324] "Faction Fighting in Southern Sudan Kills 49," AFP, Khartoum, July 15, 1998.
[325] Ibid.
[326] Isaac Magok, interview, August 14, 1999.
[327] Ler chief, interview, July 26, 1999.
[328] "Aid Workers Hiding in Bush after Sending SOS," AFP, Nairobi, July 16, 1998; WFP, "Sudan Daily Bulletin No. 10, July 18-20, 1998," Rome, July 20, 1998.
[329] "Pro-government Factions Reach Ceasefire in Southern Sudan," AFP, Khartoum, July 21, 1998.
[330] RASS official, Human Rights Watch interview, Nyal, Western Upper Nile/Unity, August 18, 1999.
[331] Elizabeth N., interview, Nyal, August 18-20, 1999. In 1998, the civilians generally did not flee too far from their homes. The women and children ran four hours "very deep in the toic, where we could not be seen," but there was not enough wild food there. They would sneak back to the village to see if it was safe to fetch clothes or food, or to gather wild food.
[332] William Magany, interview, August 18, 1999.
[333] WFP, "Sudan Bulletin No. 74: February 6-13, 1999," Rome, February 25, 1999. One Nuer military man said that the Leek Nuer, who lived in the Nhialdiu area, did not want to leave their area because they were afraid their property-huts, grain, and cattle-would be looted in their absence. Often they switched sides and joined whoever was in control of the area, be it Maj. Gen. Paulino Matiep or SSDF Cmdr. Tito Biel. Thomas Duoth, interview, July 22, 1999. Many Leek Nuer had already been displaced from their land north of Bentiu.
[334] Oxfam, "Briefing Document on the Emergency in the South of Sudan," May 1, 1998.
[335] CARE, "CARE Responds to the Crisis in South Sudan with Emergency Aid," Atlanta, May 5, 1998.
[336] Canadian International Development Agency press release, "Canada Sends Emergency Aid to Sudan," Ottawa, May 13, 1998.
[337] U.N. Office for the Coordination of Humanitarian Affairs (OCHA), Consolidated Inter-Agency Appeal for Sudan, January-December 1999, New York, January 25, 1999.
[338] MSF-Holland press release, "Insecurity Hinders Provision of Humanitarian Assistance in Southern Sudan," Nairobi, July 7, 1998.
[339] WFP, "Sudan Bulletin No. 73: February 1-6, 1999," Rome, February 7, 1999.
[340] WFP press release, "WFP Executive Director Catherine Bertini Calls on International Community to Help End Fighting in Southern Sudan," New York, July 10, 1998. Other WFP press releases included: "WFP Staff Evacuated Safely Out of South Sudan After Out-running Militia Attack," Nairobi, July 18, 1998; "WFP Issues Urgent Appeal for Funds to Expand Emergency Food Aid to Needy Sudanese," Rome, July 27, 1998.
[341] U.N. OLS, "An OLS Position Paper: The Humanitarian Emergency in Sudan," Nairobi, July 31, 1998.
[342] OCHA, Consolidated Appeal, 1999.
[343] WFP, "WFP Delivers First Food in Months to Tens of Thousands of Sudanese Cut Off by War in Southern Sudan," Nairobi, December 8, 1998, quoting David Fletcher, acting WFP Representative and Deputy Coordinator, OLS.
[344] Ibid.
[345] OCHA, Consolidated Appeal, 1998.
[346] WFP, "Emergency Report No. 26 of 1998: Sudan," Rome, June 26, 1998.
[347] OCHA, Consolidated Appeal, 1999.
[348] The Bahr El Ghazal famine had one natural cause – a two-year drought caused by El Niño – and several human ones. Muraheleen and government-backed militias pauperized the northern Bahr El Ghazal Dinka by raiding, burning fields and homes, and looting. The government's years of obstruction of relief efforts along with the SPLA's looting of the few relief goods available and "taxation" of the citizens led to a full-blown disaster. By late 1997 the U.N. projected that approximately 250,000 people in Western Upper Nile/Unity State would be at risk for starvation in 1998. Human Rights Watch, Famine in Sudan, pp. 2-3.
[349] OCHA, Consolidated Appeal, 1999.
[350] The NSCC was created by the Sudan Council of Churches based in Khartoum, to serve as a branch office for the many Sudanese Christian congregations being cut off from their headquarters in Khartoum by the war. The NSCC, headquartered in Nairobi, Kenya, comprises Sudanese Protestant and Catholic churches part or all of whose congregations and activities are located in rebel-held areas of southern Sudan and the Nuba Mountains. The SCC and NSCC consider that they are one council, periodically meet together, and issue joint statements across the political-military divide.
[351] Taban Deng, interview, July 26, 1999.
[352] International observers and journalists were invited as much to deter government bombing or other military action against the conference as to witness the event.
[353] Jok and Hutchinson, p. 10.
[354] Ibid., p. 13.
[355] The organizers planned next to reconcile the East Bank Nuer, split into many different armed factions. Upon achieving peace among the East Bank Nuer, the organizers' aim was to promote reconciliation among all East Bank tribes: the Nuer, Dinka, Shilluk, Murle, Anuak, and others. Several other meetings among and between hostile southerners were planned. Ultimately, the NSCC's plans called for a reconciliation conference between the Dinka and the Baggara. Statements of NSCC organizers at Wunlit conference, February 28, 1999.
[356] S.E. Hutchinson, interview, April 18, 2001; Hutchinson attended the Lokichokkio June 3-11, 1998 meeting and the Wunlit meeting.
[357] The
county names in Western Upper Nile roughly conform to the names of Nuer ethnic
groups, i.e., Jagei countyCounty is
populated mostly by Jagei. With some exceptions, the county names in Bahr El
Ghazal do not correspond to the ethnic groups living there. The Dinka ethnic
groups living in the Dinka West Bank counties represented at Wunlit were the
Atwot, Luaich (or Luak-jang), Agar, Gok, Manangyer, and Twic. (See Map D)
[358] There have been many spellings of the name of this commander, including Bipam and Bipany. We have used the Bapiny spelling because it is more common in Nuer.
[359] S. E. Hutchinson, interview, March 22, 2000.
[360] Rev. Bill Lowrey, peace facilitator consultant to NSCC, Human Rights Watch interview, Nairobi, August 22, 1999.
[361] SSDF officer, interview, August 3, 1999.
[362] Samuel Aru Bol, Union of Sudanese African Parties (USAP), Human Rights Watch interview, Wunlit, Bahr El Ghazal, February 28, 1999 (deceased 2000).
[363] Cmdr. Ajongo Mawut identified himself as the most senior SPLA officer to take an active part in the Trojan horse scheme in Wau, Bahr El Ghazal, in January 1998, whereby he and his forces pretended to defect to the government in order to relocate inside Wau, the second largest town in the south. James Ajongo Mawut, SPLA commander, Human Rights Watch interview, Wunlit, Bahr El Ghazal, February 24, 1999. See Human Rights Watch, Famine in Sudan, pp. 53-54.
[364] Observation by Human Rights Watch, Wunlit, Bahr El Ghazal, February 1999.
[365] Note that one area heavily raided by Nuer in 1996, Makuac, Tonj County, later (after the Wunlit covenant) became a place of refuge among Dinka for Nuer driven from their homes in the oilfields by the government forces. Isaac Magok and Lino Madut, Human Rights Watch interview, Paliang, Tonj County, Bahr El Ghazal, August 1999.
[366] The bridewealth was traditionally paid in cattle by the family of the bridegroom to the family of the bride in installments not completed until after the birth of at least the first child. D. H. Johnson, email, April 30, 2001. By abduction, soldiers married without waiting until they had enough cattle to afford the bridewealth. At times they abducted women they already hoped to marry, but at the cost of enraging the wife's family members, who did not receive any cattle, not to mention violating the woman's rights.
[367] April to June was the time when livestock were typically put on the market for sale, but the two major cattle trading centers for Western Upper Nile/Unity State, at Zeraf Island and Mayom, had been cut off to many Nuer on account of hostilities since May 1999. Nuer displaced by the fighting were also under financial pressure to sell even more cattle (when they still had them) than usual. As a result, the Dinka of Yirol, known as the main cattle traders from Twic County to Bor to Ganyliel, bought the Nuer cattle and resold them into Uganda. William Fielding, WFP consultant, Human Rights Watch interview, Lokichokkio, Kenya, August 16, 1999.
[368] See Human Rights Watch, Civilian Devastation.
[369] The government had tolerated Cmdr. Kerubino Kwanyin Bol's previous unpredictability (holding relief staff hostage) because he conducted a scorched earth campaign against his own Dinka kin from the garrison town of Gogrial, Bahr El Ghazal. He committed so many abuses that relief officials considered him a particularly outstanding cause of hunger and instability in the area. See Human Rights Watch, Famine in Sudan, pp. 46-48; 130-34.
[370] The oilfield in Adarail/AdarYal in Block 3 on the Ethiopian border east of Melut produced some 169,347 barrels. "Sudan Produced Three Mln Barrels of Oil-Paper," Reuters, Khartoum, November 18, 1998. Block 3 is not covered in this report, but is covered in the report by Christian Aid, The scorched earth: Oil and war in Sudan (London: March 2001).
[371] Talisman Energy, "Sudan: Results for 2000," http://www.Talisman-energy.com/operating/sudan.html (accessed May 21, 2001).
[372] BCSC, "In the Matter of the Securities Act (R.S.B.C.) 1996, c. 418, and In the Matter of Arakis Energy Corporation," Agreed Statement of Facts and Undertaking, May 12, 1998.
[373] See "Sudan Deal Signed by Arakis, Government, and Partners," Platt's Oilgram News (New York), March 4, 1997; Matthew Ingram, "Signs of Life on Planet Arakis," The Globe and Mail(Toronto), June 23, 1998. Lundin also had agreed with the government of Ethiopia to acquire the exploration and production rights to the Gambela Block in that country, across the eastern border of Sudan, part of the Melut Basin. "Canada: Gambela Block Onshore Ethiopia," Business Wire (Vancouver), November 14, 1991.
[374] Starr Spencer, "Arakis, Unable to Raise Funds, Forced to Seek Sale," Platt's Oilgram News (New York), July 17, 1998.
[375] Jim Buckee, Talisman Energy press release, "Talisman Agrees to Acquire Arakis," Canada Stockwatch (Vancouver), Calgary, August 17, 1998.
[376] Graham Bowley, "Talisman: Sudan Oil Project Takes Flak," Financial Times (London), Toronto, November 19, 1999.
[377] The targets in Afghanistan were said to be training camps of Al Qaeda, an Islamist armed group.
[378] Letter, Human Rights Watch to U.S. President Bill Clinton, September 15, 1998.
[379] Talisman's CEO stated that the company was "actively seeking more information . . . [and would] let events unfold further before making decisions on future actions concerning the acquisition of Arakis." Jim Buckee, Talisman Energy press release, "Talisman Seeks Further Information on Events in Sudan," Canada Newswire, Calgary, August 21, 1998.
[380] Jim Buckee, Talisman Energy press release, "Talisman Advances Funds to Arakis," Canada Stockwatch (Vancouver), Calgary, August 31, 1998.
[381] David Mann, Talisman Energy press release, "Talisman Advances Additional Funds to Arakis," Canada Stockwatch (Vancouver), Calgary. September 18, 1998.
[382] "Talisman Acquires Arakis Energy," Canadian Corporate News, Calgary, October 8, 1998.
[383] Chris Varcoe, "Talisman Sees Hope in Sudan; Calgary Firm Continues to Face Obstacles," Calgary Herald, Ottawa Citizen, March 19, 1999.
[384] Talisman Energy, "Background Paper," pp. 2-3; Talisman Energy, "Company Highlights," http://www.Talisman-energy.com/high.html (accessed July 17, 1999).
[385] Inter-Church Coalition on Africa press release, "Canadian Corporate Involvement in Sudan: Action against Talisman Energy Inc. Needed Urgently, Canadian Agencies Tell Axworthy," Toronto, November 18, 1998.
[386] U.S. Department of Energy, "Select Crude Oil Spot Prices," WTI at Cushing, (accessed November 27, 2000).
[387] "Iraq's Oil Minister to Visit Sudan Soon," Reuters, Baghdad, June 26, 1999.
[388] "Iraq Oil Min in Sudan to Boost Energy Cooperation-Report," AP, Baghdad, June 30, 1999.
[389] "Sudan to Start 150,000 B/D Oil Exports in June-Newspaper," Dow Jones Newswires, Manama, Bahrain, May 30, 1999, quoting the Arabic language newspaper Al Hayat (London). That target of 270,000 b/d had not been met as of late 2002.
[390] Susan Sevareid, "Sudan Inaugurates Oil Pipeline," AP, Heglig, Sudan, May 31, 1999.
[391] See "China Finishes Sudan Oil Projects," AP, Beijing, July 14, 1999. During an earlier visit to the refinery, National Industry Minister Badr Eddin Suleiman affirmed the importance of the Sudanese private sector entry into various industrial investments. "National Industry Minister Inspects Concorp Oil Refinery," Sudan News Agency (SUNA), Khartoum, June 22, 1999.
[392] "Sudan's First Private Sector Oil Refinery Inaugurated," AFP, Khartoum, June 30, 1999.
[393] "Al-Bashir Inaugurates Concorp Oil Refinery," Omdurman Republic of Sudan Radio Network, Omdurman, in Arabic, June 30, 1999, as translated in Foreign Broadcasting Information Service(FBIS), Washington, D.C., June 30, 1999; "President Al-Bashir Inaugurates Concorp Oil Refinery," SUNA, Khartoum, June 30, 1999.
[394] See "Neglect of the Environment: Warnings about Environmental Impact of Oil Extraction," below.
[395] Letter, James Buckee, Talisman CEO, to Ahmed Al Youm, Akhbar Al Youm editor in chief, June 21, 1999, published by Akhbar Al Youm, Khartoum, June 26, 1999.
[396] J.W. Buckee, "Talisman in Sudan," Globe and Mail (Toronto), Calgary, October 21, 1999; Talisman Energy, "Sudan-The Greater Nile Oil Project, Background Paper," December 1998, p. 6.
[397] IMF, "IMF Lifts Declaration of Noncooperation from Sudan," News Brief No. 99/52, Washington, D.C., August 31, 1999.
[398] Nhial Bol, "Islamic Regime Begins to Export Oil," IPS, Bashar, Sudan, August 30, 1999.
[399]The Shell
Transport and Trading Co. is the U.K. holding company of the Royal Dutch/Shell
Group of companies. "The Royal Dutch/Shell Group of Companies – Structure,"
http://www.shell.com/home/Framework?siteId=royal-en&FC1=&FC2=&FC3=%2Froyal-en%2Fhtml%2Fiwgen%2Fabout_shell%2Fwho_we_are%2FStructure_of_Shell.html&FC4=&FC5=
(accessed September 16, 2003).CK The Shell
Transport and Trading Co. is the U.K. holding company of the Royal Dutch/Shell
Group of companies.
[400] Nhial Bol, "Islamic Regime Begins to Export Oil," August 30, 1999.
[401] "Sudan
Begins Oil Exports," U.N. IRIN Integrated Regional
Information Networks (IRIN) News Briefs (Nairobi), September
1, 1999.
[402] Mohammed Ali Saeed, "Sudan to Request Extradition of Suspects in Pipeline Blast," AFP, Khartoum, September 22, 1999.
[403] "Program Summary: Omdurman Sudan TV," Omdurman Sudan Television Network, Omdurman, in Arabic, September 23, 1999, as translated in FBIS, Washington, D.C., September 27, 1999.
[404] "Sudan: Statement on Pipeline Explosion; Rebels Suspected," Omdurman Sudan Television Network, Omdurman, in Arabic, September 20, 1999, as translated in FBIS, Washington, D.C., September 23, 1999.
[405] Carol Pineau, "Sudan Pipeline Bombers Pledge to Strike Again," AFP, Asmara, Eritrea, October 11, 1999.
[406] Samson L. Kwaje, SPLM, "Flow of Oil Disrupted," Nairobi, September 20 or 21, 1999.
[407] Mohammed Ali Saeed, "Sudanese Government Suing Opposition Over Pipeline Blast," AFP, Khartoum, September 21, 1999.
[408] "Sudan
Puts Arab League Agreement on Terrorism Control to Test," DPA [Deutsche
Presse-Agentur?], Khartoum, September 29, 1999;
"Egypt Deports Two Sudanese Rebel Leaders over Oil Pipeline Blast," AFP,
Cairo, October 9, 1999; "Sudan-Egypt Denounces Oil Pipeline Attack," Omdurman
Republic of Sudan Radio Network, Omdurman, in Arabic, September 24, 1999,
as translated in FBIS,Washington, D.C., September 27, 1999;
"Egypt Deports Two Sudanese Rebel Leaders over Oil Pipeline Blast," AFP,
Cairo, October 9, 1999; "Sudan Opposition Says Bomb Suspects Not Deported," Reuters,
Cairo, October 10, 1999; Carol Pineau, "Sudan Pipeline Bombers Pledge to
Strike Again," October 11, 1999; "File for the Extradition of the Accused from
Eritrea Has Been Prepared," SUNA, Khartoum, October 14, 1999.
[409] Mohamed Ali Saeed, "Blasts in East Sudan, Military Buildup on Border with Eritrea," AFP, Khartoum, October 6, 1999.
[410] "Sabotage on Oil Pipeline in East Sudan," AFP, Khartoum, November 28, 1999. The eight-inch-diameter pipeline had been built in 1974 to carry imported and refined oil products, mostly gasoline, to Khartoum. "Sudan Says Pipeline Attack Launched from Neighbouring State," AFP, Khartoum, November 29, 1999.
[411] Ibid.
[412] "Sudan: Opposition Blamed for Oil Pipeline Explosion," AFP, Khartoum, January 16, 2000, as translated in FBIS, Washington, D.C., January 19, 2000.
[413] "Sudan Oil Pipeline Sabotage," BBC Online News, Khartoum, January 16, 2000; "Sudan: Opposition Abroad Denies Involvement in Oil Attack," AFP, Khartoum, January 17, 2000, as translated in FBIS, Washington, D.C., January 19, 2000; "Sudan: Oil Pipeline Resumes Operation after Blast," AFP, Khartoum, January 19, 2000, as translated in FBIS, Washington, D.C., January 21, 2000.
[414] Claudia
Cattaneo, "Talisman's Sudanese Pipeline Bombed: Third Incident of Sabotage on
Controversial Project," Financial Post (Toronto), Calgary, May 1,
2000; "The
Pipeline that Carries "Sudan Pipeline Blown Up," Oil Daily (New
York), May 2, 2000. Sudan's Crude Oil to Port Bashair….," May 2, 2000. [incomplete cite, nowhere else in report]CK
[415]Ali El Safi, Beja Congress spokesperson, Human Rights Watch interview, Kampala, Uganda, July 17, 2000.
[416] "Camel-back Chase for Rebels Accused of Blowing Up Sudan Pipeline," AFP, Khartoum, May 2, 2000; "Suspect in Sudan Pipeline Attack Arrested After Gun Battle," AFP, Khartoum, May 6, 2000.
[417] A "technical" is the name for a pickup truck with heavy machine guns or light antiaircraft artillery mounted in the bed of the truck, an improvised mobile weapon.
[418]Ali El Safi, interview, July 17, 2000.
[419] See WFP, Sudan Bulletin No. 65, December 6-13, 1998, Nairobi, December 18, 1998.
[420] The WFP learned in December 1998 that a large number of displaced Nuer moved from Unity state to the Twic Dinka in Bahr El Ghazal.WFP, Sudan Bulletin No. 66, Nairobi, December 20, 1998. The Twic County local authorities said 28,000 Nuer in Twic County were displaced from Western Upper Nile/Unity State. Ibid.
[421] Bapiny and Paulino Matiep were both Bul Nuer, from the Gok section. Thomas Duoth, interview, July 22, 1999.
[422] In January 1999, some 600 to 700 of Cmdr. Philip Bapiny's troops backed by 150 SPLA troops attacked Mankien, but were expelled by Maj. Gen. Paulino Matiep's forces. After Cmdr. Peter Gatdet mutinied from Maj. Gen. Paulino Matiep in September 1999, Cmdr. Philip Bapiny returned with his forces from Twic County to join fellow Bul Nuer Peter Gatdet. Thomas Duoth, interview, July 22, 1999.
[423] Ler chief, interview, July 26, 1999.
[424] SSDF officer, interview, August 3, 1999.
[425] The 1999 Constitution lifted the ban on political parties for the first time since it was imposed by the coup government on June 30, 1989.
[426] Cmdr. Lawrence Lual Lual, the Dinka leader of the SPLM/A-Bahr El Ghazal group (after Commander Kerubino defected to the SPLM/A in January 1998), announced in October 1998 that he had left the UDSF because Riek Machar had removed all Lual's nominees from government posts. He claimed he had 1,500 forces, of whom 400 were cooperating with Maj. Gen. Paulino Matiep. Alfred Taban, "Pro-government Ally Splits from Sudan Coalition," Reuters, Khartoum, October 11, 1998.
[427] A regional newsletter commented that Dr. Riek Machar had the backing of President Bashir and his southern opponents had the backing of Dr. Turabi. "Problems for Machar," The Indian Ocean Newsletter (Paris), March 27, 1999.
[428] Elijah Hon Top, interview, July 26, 1999. Garkoth Gatkuoth announced in January 1999 that he formed the SSDF-2 and left Riek Machar because "Machar has no respect for law and justice." He claimed Riek Machar had attempted to assassinate him after he sent a letter saying he would fight independently. Cmdr. Garkoth Gatkuoth alleged that half of the SSDF in Juba had joined his faction; observers estimated that there were some 3,000 SSDF forces in Juba. Alfred Taban, "Sudan Militia Splits from Pro-government Coalition," Reuters, Khartoum, January 21, 1999.
[429] Elijah Hon Top, interview, July 26, 1999.
[430] "Paulino [Matiep] has been there in Unity State since 1987. On September 17, 1997, he defected from Riek [Machar]. Also in 1997 Gabriel Tanginya in Old Fangak defected. Gordon Kong defected in Nasir in 1999. The government of Sudan targets illiterate Nuer commanders. All the above are illiterate." Taban Deng, interview, July 26, 1999.
[431] See Human Rights Watch, Famine in Sudan, Appendix F, "Letter from Dr. Riek Machar to President Omar Hassan Ahmed El Bashir (undated but after July 4, 1998)", pp. 201-05.
[432] See Lundin Oil press release, "IPC Sudan Limited Spuds first Well in Sudan," Stockholm, April 8, 1999.
[433] SSDF officer, interview, August 3, 1999.
[434] Paul Wilson, interview, May 16, 2001.
[435] SSDF officer, interview, August 3, 1999. "You who are in the majority" refers to the SSDF and UDSF south of Bentiu..
[436] Ibid.; Tito Biel, interview, August 19, 1999.
[437] SSDF officer, interview, August 3, 1999.
[438] "Sudan VP Vows to Take All Rebel-Held Areas by June 30," AFP, Khartoum, March 11, 1999.
[439] "Sudan: Youth Conference Decides to Send 'Mujahidin' to Defend Oil Installations," BBC Worldwide Monitoring, Khartoum, April 29, 1999.
[440] "Sudan:
Government Forces Dispatched to Defend Oilfields," BBC Worldwide Monitoring,
Omdurman, May 5, 1999; "Government Dispatches Mujahadeen to Defend Oilfields," U.N. IRINIRIN,
Nairobi, May 6, 1999.
[441] "Beshir Warns of Foreign Plot to Block Sudanese Oil Exportation," AFP, Khartoum, May 5, 1999; "Sudan: Government forces dispatched to defend oilfields," Sudan TV, Omdurman, in Arabic, May 5, 1999, as translated BBC Summary of World Broadcasts, U.K., May 5, 1999; .
[442] "Thousands of Sudanese Volunteers to Guard Oil Pipeline," AP, Khartoum, May 27, 1999.
[443] Based on Talisman Energy, 2001 Annual Report, p. 57.
[444] By April 1999 reserves in Blocks 1 and 2 were estimated at 800 million barrels instead of the 450 million barrels estimated only one year before, according to Assistant Secretary of Energy and Mining Ali Ahmed Othman. The assistant secretary said that oil exploration in Sudan was just beginning. "Sudan Confirm Oil Reserves of 800 Million Barrels," Panafrican News Agency (PANA), Khartoum, April 13, 1999.
[445] "Sudanese Oil Reserves Surpass 1 Billion Barrels," Xinhua (Beijing), Khartoum, May 3, 1999.
[446] Over the roads GNPOC built or improved, Gumriak was perhaps fifty kilometers and Pariang twenty kilometers from El Toor oilfield. (See Map D) The Sudanese army had displaced Dinka civilians from the immediate area of El Toor in mid-1998.
[447] Thomas Duoth, interview, July 22, 1999.
[448] WFP, "Sudan Bulletin No. 76: 21-28 February 1999," Rome, March 8, 1999; WFP, "Sudan Bulletin No. 77: February 29-March 6, 1999," Rome, March 12, 1999. Gumriak remained a no-go area for the rest of the month. WFP, "Sudan Bulletin No. 78: March 7-13, 1999," Rome, March 22, 1999; WFP, "Sudan Bulletin No. 79: March 14-20, 1999," Rome, March 25, 1999; WFP, "Sudan Bulletin No. 80: 21-27 March 1999," Rome, April 7, 1999.
[449] WFP, "Sudan Bulletin No. 83: April 18-24, 1999," Rome, May 11, 1999.
[450] Thomas Duoth, interview, July 22, 1999. Cmdr. Paul Thon was a popular SSDF commander of Jikany Nuer origin. He died shortly thereafter, after being wounded in battle. Simon Kun, interview, July 23, 1999.
[451] Harker report, pp. 48-9; Damien Lewis, "Fight for Sudan's Oil Is Killing Civilians," Globe and Mail (Toronto), Gumriak, Western Upper Nile, October 5, 1999; Confidential communication to Human Rights Watch, July 1, 1999.
[452] SSDF officer, interview, August 3, 1999. In late March 1999, four persons-three government employees, including the deputy commissioner of Pariang, and a Sudanese Red Crescent tracing officer-died in SPLA custody in Ruweng (Panaru) County. The group had fallen into SPLA hands on February 18, 1999, when they strayed into SPLA territory around the village of Kong in the Pariang area. The three government employees were accompanying a team of two Swiss nationals of the ICRC and two Sudanese Red Crescent workers carrying out a humanitarian mission. On April 2, the SPLM/A announced that the four detainees (the two foreigners had been released and one Sudanese escaped) had been killed on March 31 in crossfire during an unsuccessful rescue operation by government of Sudan forces. The ICRC demanded "a full inquiry to shed light on the events and the full cooperation of the SPLM/A in repatriating the four bodies to allow for decent burial." The SPLM/A refused to turn the bodies over to the government, the relatives, the ICRC, or any other entity, to permit or conduct any investigation, or to give any further explanation, leading to the inference that the four had been summarily executed. See WFP, "Sudan Bulletin No. 78: March 7-13, 1999," Rome, March 22, 1999; "ICRC Establishes Contact with Its Workers Kidnapped in Sudan," DPA, Geneva, March 10, 1999; John Nyaga, "Sudanese Rebels Say Hostages Died in Rescue Attempt," AFP, Nairobi, April 2, 1999; ICRC press release, "ICRC Appalled by Death of Four Detained Sudanese," Geneva, April 1, 1999.
[453] See Harker report, p. 50.
[454] Damien Lewis, "Fight for Sudan's Oil Is Killing Civilians," October 5, 1999.
[455]See "The Illegality of Forced Displacement Under International Humanitarian Law," below.
[456] Harker report, p. 11. Biem was sixty-five kilometers from Pariang.
[457] Ibid., p. 48.
[458]Steven Edwards, Claudia Cattaneo, and Sheldon Alberts, "Calgary firm tied to Sudan 'atrocities'," National Post (Toronto), Khartoum and Ottawa, November 17, 1999.
[459] Harker report, p. 49.
[460] Ibid., p. 49. No rebel faction has military aviation.
[461] Field worker in southern Sudan, confidential communication to Human Rights Watch, April 30, 2000.
[462]Al-Anbaa, as quoted in "Sudan Army Destroys Southern Rebel Camps," Reuters, Khartoum, May 23, 1999.
[463] Ibid. Initially Sudanese army spokesman Gen. Mohamed Osman Yassin called the reports of capture or hostage-taking of workers, including Chinese nationals, "false" and "untrue." "Sudan's army denies reported abduction of oil workers," AFP, Khartoum, May 10, 1999. Later in the month, however, the pro-government Alwan newspaper printed an article in which the army in effect admitted the SPLA capture. "Sudan army says destroys southern rebel camps," Reuters, Khartoum, May 23, 1999. No other information was available, as the SPLM/A did not issue any statement on the topic.
[464] On the Talisman map, Munga appears southeast of Umm Sagura.
[465] Harker report, p. 50.
[466] Ibid., "Sudan army says destroys . . . camps," May 23, 1999.
[467] The SPLM/A claimed that "armed Sudanese" took twenty-three Chinese oil workers employed by the CNPC captive in Bentiu during nearly a week of fighting the government there. "Sudan Rebels Claim 23 CNPC Oil Workers Captured," AP, Cairo, May 8, 1999. A Chinese diplomat in Khartoum refused to answer any questions about any allegedly abducted Chinese oil workers. Ibid.; Judith Achieng, "Foreign Oil Companies ordered to Vacate Immediately," IPS, Nairobi, May 11, 1999. The Chinese embassy in Nairobi also refused to answer SPLM/A inquiries about what to do with the Chinese prisoners captured by the SPLA. SPLM official, Human Rights Watch interview, Nairobi, July 20, 1999. President Bashir later implicated Riek Machar in this action, but Machar denied involvement, explaining that men under Tito Biel's command had gotten out of control. "The Southern Oil Mix-Up," Indian Ocean Newsletter (Paris), May 15, 1999.
[468] Simon Kun, interview, July 23, 1999. See below.
[469]According to the WFP:
The WFP Officer for Jonglei and Upper Nile visited Ruweng County in Upper Nile at the end of May. She found the villages around the airstrips of Gumriak, Padit and Tajiel [had] been looted and burnt and the population displaced. Flooding in 1998 and looting this year have seriously depleted local grain stores. Cultivation has not yet begun in the county, due to the lateness of the rains. . . . A recent nutritional survey carried out by MEDAIR in the Gumriak area in April [before the attack] found a global malnutrition rate of 20.3 % and a severe malnutrition rate of 7.1 %.
WFP, "Sudan Bulletin No. 89: 30 May-5 June 1999," Rome, June 6, 1999.
[470] "WFP conducted an emergency distribution in Tagiel and Gumriak in Upper Nile. The team was able to stay only three days in each location since they are considered high security risk areas following an attack on both locations in May 18." WFP, "Sudan Bulletin No. 91, 13-19 June 1999," Rome, June 24, 1999.
[471] Christian Solidarity Worldwide (CSW), "Fact-finding and Aid Mission to Southern Sudan, June 16- 22," draft preliminary report, London, June 22, 1999. Christian Solidarity Worldwide, a British advocacy group that arrived on the scene a few weeks after the offensive, should not be confused with Christian Solidarity International (CSI), of which it was a part until mid-1998. CSW is based in London and headed by Baroness Caroline Cox; its activities in Sudan include but were not limited to slave redemptions, as witness this visit.
[472] Damien Lewis, "Fight for Sudan's Oil is Killing Civilians," October 5, 1999.
[473] Charlie Gillis, "Meeting the Victims of Sudan's Oil Boom," National Post (Toronto), November 27, 1999.
[474] Field worker in southern Sudan, confidential communication to Human Rights Watch, April 30, 2000.
[475] Harker report, p. 49.
[476] The SRRA assessed there were 6,667 needy households in Gumriak. Benjamin Majok, Human Rights Watch interview, Lokichokkio, Kenya, August 22, 1999. Benjamin Majok, an SPLA commander and former head of the relief wing of the SPLM/A, was from Ruweng County.
[477] The SPLM/A subsequently said it reoccupied the Gumriak, Padit, and Tagil areas in early June, after the withdrawal of the government forces. An SPLA commander in the Pariang area also claimed the SPLA prevented the government troops from making forays into the countryside from the Pariang garrison three times later that year. Benjamin Majok, interview, August 22, 1999.
[478] Harker report, p. 48.
[479] Taban Deng, interview, July 26, 1999.
[480] The population of Gumriak, for instance, declined from 9,474 to 5,274. Harker report, p. 49.
[481] Government officials in late May advised the U.N. OLS to defer delivery and distribution of food to approximately 4,000 beneficiaries in the government garrison town Pariang, due to continuous fighting. U.N. OLS (Northern Sector), "Weekly Report: May 26, 1999," Khartoum, May 26, 1999.
[482] U.N. OLS (Southern Sector), "Weekly Report: June 6, 1999," Nairobi, June 7, 1999.
[483] WFP, "Sudan Bulletin No. 89: 30 May-5 June 1999," Rome, June 6, 1999.
[484] U.N. OLS (Northern Sector), "Weekly Report: June 16, 1999," Khartoum, June 16, 1999.
[485] WFP,
"Sudan Bulletin No. 91: June 13-19, 1999," Rome, June 24, 1999. Note that the
42,000 population "in need" estimate is higher than the 25,000-30,000 Ruweng countyCounty
total population estimate made by an assessment team in Padit in January 1998
(above, Part I, The Arakis Period). The difference may be in part exaggeration,
in part continual population movement, and in part the notorious difficulty of
arriving at accurate numbers in emergency operations in southern Sudan.
Displacement in and out of the area, however, had definitely stepped up between
January 1998 and July 1999. A population shift of 15,000-20,000 within a year
and a half due to fighting is entirely possible.
[486] U.N. OLS (Northern Sector), "Weekly Report: June 30, 1999," Khartoum, June 30, 1999.
[487] WFP, "Sudan Bulletin No. 94: July 4-10, 1999," Rome, July 26, 1999.
[488] Benjamin Majok, interview, August 22, 1999.
[489] Although there had been fighting in the Block 5A areas in 1998, the government troops and mujahedeen had not overtly taken part but were content to have the fighting perceived as "Nuer on Nuer."
[490]AJackpot for Lundin Oil in Sudan,@Finanstidningen, May 21, 1999; ALundin, OMV Claim Substantial Find in Sudan,@Platt=s Oilgram News (New York,), May 21, 1999.
[491] The study was done by Resource Investment Strategy Consultants of Perth, Australia, for Lundin. Lundin Petroleum, Report for the period ended December 31, 2001, http://www.Lundin-petroleum.com/Documents/qr_4_2001_e.pdf (accessed May 28, 2002).
[492] Taban Deng, interview, July 26, 1999; employee of security consultant to oil company, Human Rights Watch telephone interview, September 8, 1999 (anonymity requested).
[493] Ibid.
[494] Michael Wal, interview, August 18, 1999.
[495] U.N. OLS (Southern Sector), "Weekly Report: March 15-21, 1999," Nairobi, March 21, 1999.
[496] Tito Biel, interview, August 19, 1999.
[497] Elijah Hon Top, interview, July 26, 1999.
[498] Letter, Paulino Matiep to Taban Deng Gai, Bentiu, Unity State, April 29, 1999. Maj. Gen. Paulino Matiep cited several military actions directed by Gov. Taban Deng indicating to him that the UDSF supported the SPLM/A.
[499] Ibid.
[500] Taban Deng, interview, July 26, 1999.
[501] Ibid. Those arrested during this April 1999 wave of arrests allegedly included Bol Riel Gatluak, an ex-Minister of Parliament from Unity State and commissioner for Payinjar (Nyal and Ganyliel), who was feared dead in custody; Chol Met, also an ex-minister of parliament from Unity State; and former Deputy Cmdr. Riek Lor Jiok, an executive officer of the state. Others included ex-Alt. Cmdr. Dok Wangang, an executive officer (believed to have been lashed to death); ex-Alt. Cmdr. Jol Banak; and James Pui Yeek, a former adjutant to Maj. Gen. Paulino Matiep who reportedly had worked with the ICRC in Lokichokkio, Kenya. SSDF officer, interview, August 3, 1999. Those who were still held in Maj. Gen. Paulino Matiep's base at Mankien when Cmdr. Peter Gatdet captured it in September 1999 were freed.
[502] Makuac Youk also accused major Maj. Gen. Paulino Matiep of removing furniture from government offices in Bentiu and taking it to Mankien in a government helicopter. Alfred Taban, "Rival Militias Feud in Sudan's Unity Oil State," Reuters, Khartoum, May 31, 1999.
[503] "President of the Republic Cancels Decisions Issued by Wohda [Unity] State's Wali [Governor]," SUNA, Khartoum, May 8, 1999.
[504] Cmdr. Peter Gatdet, then serving under Maj. Gen. Paulino Matiep, was given this assignment. John Noble, WFP security official, Human Rights Watch interview, Lokichokkio, Kenya, July 31, 2000 . The government wanted to send forces to two adjoining Lundin sites in Block 5A, Guk and Ryer/Thar Jath, with an escort of Maj. Gen. Paulino Matiep's militia. According to additional sources, Maj. Gen. Paulino Matiep wanted to prevent the resumption of fighting between his troops and the SSDF. Paulino Matiep reportedly convinced the Sudanese government that it should send in the forces by helicopter, without his escort, instead of overland. He then appealed to rival and SSDF Cmdr. Tito Biel, through intermediaries, telling him of the government's plans and asking him not to attack the government troops. He warned that if Cmdr. Tito Biel did resist, then the government would insist that Maj. Gen. Paulino Matiep's forces escort the army, and this would ignite further Nuer-Nuer fighting. Cmdr. Tito Biel was said to have replied that he would oppose any government attempt to increase its military presence in his territory (south of Bentiu) by air or any other way. Indeed, his understanding from meetings with Riek Machar was that he must not allow the government to build up its forces in Block 5A south of Bentiu. Anonymous relief worker, Human Rights Watch interview, August 22, 1999; Anonymous relief worker, February 2000. In any event, Paulino Matiep's forces ultimately accompanied the Bentiu army convoy.
[505] The SSDF believed that the government had artillery and fifteen trucks that carried three companies at some 126 soldiers per company, or an estimated 378 army soldiers. Paulino Matiep's forces on foot made up three "task forces" of some 400 each. Thomas Duoth, interview, July 22, 1999.
[506] SSDF officer, interview, August 3, 1999.
[507] The third died of his injuries while being evacuated to Bentiu by plane that same day. Employee of security consultant to oil company, interview, September 8, 1999.
[508] Ibid., and others.
[509] Thomas Duoth, interview, July 22, 1999. He claimed that there were two "Arab" plainclothes security men who were captured by Nuer chiefs and cattle guards from Duar. The chiefs and guards allegedly executed the captives in retaliation for their alleged killing of two civilians. He said that Cmdr. Tito Biel was advised of the capture but washed his hands of it. Many UDSF and SSDF officials denied the killings or claimed no knowledge of them. Based on the testimony of the oil company securityconsultant, the Harker Report, below, and others, it appears that the SSDF was responsible for the summary execution, not Nuer civilians.
[510] Tito Biel, interview, August 19, 1999. Neither Lundin nor the government made any mention of the triple murder at the time, but a Sudanese army spokesman later said that Cmdr. Tito Biel's forces killed three oil guardsand carried out other "hostile acts" at petroleum sites in Unity State beginning on April 29, 1999. The Canadian human rights team concluded that three government soldiers guarding this Lundin rig had been abducted from the camp near the rig and killed. Talisman also said it was aware of three killed in a May 1999 attack on Lundin's operations. "Sudanese army confirms defection of ally, says he hijacked boat," AFP, Khartoum, May 28, 1999; Harker report, p. 50; Human Rights Watch interview, Talisman officials, February 3, 2000 (two northern guards shot dead by warlords).
[511] Maj. Gen. Paulino Matiep's spokesman said that Cmdr. Tito Biel's forces seized four Chinese and several Sudanese workers in Koch at the start of the fighting on May 2 and took ten oil company vehicles. The vehicles, used to transport rebels to the front lines, were returned a day later to the oil companies and the abductees were released the day after their capture, he admitted. Alfred Taban, "Calm reported restored in oil-rich Sudan state," Reuters, Khartoum, May 9, 1999.
[512] Employee of security consultant to oil company, interview, September 8, 1999.
[513] Ibid.
[514] After estimating that the oil find might be up to 300 million barrels, Lundin stated, "The rain period is just starting so Lundin Oil cannot investigate the current finding in detail until the autumn of 1999." "Jackpot for Lundin Oil in Sudan," Finanstidningen, May 21, 1999, abstracted from Finanstidningen in Swedish, World Reporter.
[515] There were two airstrips serving Ler, one to the west near the government garrison (Payak or Gil) and one airstrip near the Ler hospital, called Pomzor. Isaak Magok, interview, August 14, 1999; Elijah Hon Top, interview, July 26, 1999.
[516] Eyewitnesses told the Canadian human rights delegation in December 1999 that SSDF soldiers outside the army garrison had noticed, on May 2, 1999, a white helicopter arriving in Ler full of troops but leaving half empty. The SSDF shot at that helicopter. Harker Report, p. 56. The Harker Commission further noted that on the same day, relief and other officials, before their evacuation from Ler, had also seen a white helicopter bring troops to Ler-and added that it was flown by "Caucasians." The origin or ownership of this helicopter has not been established. Ibid. These events occurred when the governmennt had a working military helicopter fleet of six, before the purchases of sixteen more such helicopters in 2001-2002.
[517] SSDF officer, interview, August 3, 1999.
[518] Thomas Duoth, interview, July 22, 1999.
[519] SSDF officer, interview, August 3, 1999.
[520] Tito Biel, interview, August 19, 1999.
[521] SSDF officer, interview, August 3, 1999.
[522] Isaac Magok, interview, August 14, 1999.
[523] Most of the mujahedeen, after the capture of Ler, returned to Bentiu.
[524] The pro-government militias of Nuer commanders Gabriel Tanginya, Gordon Kong Chuol, and Simon Mabor Gatwich Dual reportedly helped push SSDF forces out of Ler before returning to their home positions in other parts of Upper Nile. Elijah Hon Top, interview, July 26, 1999.
[525] "Sudan army says destroys . . . camps,"May 23, 1999.
[526] SPLM/A press release, Nairobi, June 16, 1999.
[527] Alfred Taban, "Pro-government militias clash over oil with Sudan army," Reuters, Khartoum, May 6, 1999.
[528] Tito Biel, interview, August 19, 1999.
[529] "First Vice-President Affirms Government Keenness for National Dialogue," SUNA, Khartoum, May 12, 1999.
[530] "Sudan: Government forces dispatched to defend oilfields," Sudan TV, Omdurman, in Arabic, May 5, 1999, as translated in BBC Summary of World Broadcasts.
[531] "Armed
Forces Spokesman Issues Statement," SUNA, Khartoum, May 5, 1999; "Rebels
reportedly targeting oil facilities in the south and east," U.N. IRIN,
Nairobi, May 6, 1999; "Sudan army says rebels attack oil installations," Reuters,
Khartoum, May 5, 1999.
[532] Alfred Taban, "Calm reported restored in oil-rich Sudan state," Reuters, Khartoum, May 9, 1999.
[533] Ibid.
[534] "Pro-government Sudanese militia commander defects to SPLA," AFP, Khartoum, May 17, 1999. Alfred Taban, "Sudan group reports more clashes in oil-rich state," Reuters, Khartoum, May 11, 1999; Alfred Taban, "Pro-government militias clash over oil with Sudan army," Reuters, Khartoum, May 6, 1999.
[535] Part of Ruweng County in Block 5A, north of the Bahr El Ghazal (Nam) River, apparently was not of commercial interest to Lundin, which later permitted it to be released back to the government pursuant to the contract. That northern tip of Block 5A was closer to the GNPOC oilfields in Block 1 than to the areas of Lundin's interest south of the river in Block 5A. This report covers the northern tip of Block 5A in the context of the adjacent GNPOC concession.
[536] Dr. Samson L. Kwaje, SPLM/A Secretary for Information and Official Spokesman, SPLM/A press release, Nairobi, May 4, 1999.
[537] SPLA News Agency (SPLANA), "Message to the Sudanese People on the Occasion of the SPLM/SPLA 16th Anniversary," by Dr. John Garang de Mabior, Nairobi, May 18, 1999 (text of radio message).
[538] Isaac Magok, interview, August 14, 1999.
[539]
"Khartoum plays down alleged strain on peace pact," U.N. IRIN
(Nairobi), Khartoum, May 12, 1999.
[540] Mohamed Ali Saeed, "Sudanese faction demands revision of peace pact with regime," AFP, Khartoum, May 10, 1999.
[541] "First Vice-President Affirms Government Keenness,"May 12, 1999; Alfred Taban, "Khartoum seeks to heal rift with rebel allies," Reuters, Khartoum, May 20, 1999.
[542] "Khartoum accused of violating peace accord," AFP, Khartoum, May 21, 1999.
[543] His list of grievances included: assimilating five SSDF officers into the government army without consultating with him; trying to create southern militias affiliated with the government to divide the SSDF; dismissing the governor of Unity State (Taban Deng Gai); sending armed forces into Ler without prior agreement; and "deploying armed forces aggressively on May 2, 1999, without being justified on grounds of security, an action that threatened oil exploration south of Bentiu, Unity State, and led to confrontation and fighting against the SSDF." Letter, Dr. Riek Machar, Assistant Vice President and Chairman of the Coordinating Council, to President Omar El Bashir, Khartoum, May 25, 1999.
[544] "Split in ranks behind Khartoum's chief for south Sudan, Machar," AFP, Khartoum, June 2, 1999; Alfred Taban, "Southern Sudan leader faces ouster attempt," Reuters, Khartoum, June 4, 1999. On June 3, Weles Wal Bang, a Nuer convert to Islam, and others broke from the UDSF and set up the UDSF Collective Leadership, calling for Riek Machar's dismissal from the UDSF and the SSDF.
[545] Michael Wal, interview, August 18, 1999.
[546] Elizabeth N, interview, August 18-20, 1999.
[547] Elizabeth N.and Martha N. interviews, August 18-20, 1999.
[548] Isaac Majok, interview, August 14, 1999.
[549] Ibid.
[550]
Nyakier, displaced woman from Mayandit, Human Rights Watch interview, Paliang,
Tonj countyCounty,
Bahr El Ghazal, August 15, 1999.
[551] Ibid.
[552] Ibid.
[553] Elizabeth N. and Martha N.., interviews, August 18-20, 1999.
[554] Adok chief, interview, August 20, 1999.
[555] Elizabeth N. and Martha N., interviews, August 18-20, 1999.
[556] Nyakier, interview, August 15, 1999.
[557] Ibid.
[558] Isaac Magok, interview, August 14, 1999.
[558] Ibid.
[559] Ibid.
[560] Ibid.
[561] "Relapsing fever is an acute febrile illness caused by spirochetes of the genus Borrelia. The high fevers of presenting patients spontaneously abate and then recur." This pattern of recurrence gives the disease its name. There is a 30-70 percent morbidity rate in untreated patients. It is transmitted by ticks and human body lice. Jonathan A Edlow, MD, "Tick-Borne Diseases, Relapsing Fever," eMedicine Journal, January 26, 2001, Volume 2, Number 1, http://www.emedicine.com/emerg/topic590.htm (accessed June 27, 2001).
[562] Isaac Magok, interview, August 14, 1999.
[563] Woman
displaced from Mayandit, Human Rights Watch interview, Paliang, Tonj countyCounty,
Bahr El Ghazal, August 15, 1999.
[564] Chief
Chany Both Nyang of Mayandit, Human Rights Watch interview, Paliang, Tonj countyCounty,
Bahr El Ghazal, August 15, 1999.
[565] Isaac Magok, interview, August 14, 1999.
[566] Ibid.
[567] Ibid.
[568] Victor
Bol Duop, assistant commissioner of Makuac, Human Rights Watch interview,
Paliang, Tonj countyCounty, Bahr El
Ghazal, August 14, 1999.
[569] Chany Both Nyang, interview, August 15, 1999.
[570] Lino
Madut, paramount Luak-jang Dinka chief of Makuac, Human Rights Watch interview,
Paliang, Tonj countyCounty, Bahr El
Ghazal, August 14, 1999.
[571] Isaac Majok, interview, August 14, 1999.
[572] Lino Madut, interview, August 14, 1999.
[573] Isaac Magok, interview, August 14, 1999.
[574] Ibid.
[575] U.N. OLS (Southern Sector), Weekly Report: May 31–June 6, 1999.
[576] Ibid.
[577] Ibid.
[578] Michael Wal, interview, August 18, 1999.
[579] WFP, "Sudan Bulletin No. 92: 20 – 26 Jun, 1999," June 26, 1999; Christopher M. Kiilu, WFP, "Nuer Displaced in Twic County" (handwritten report), Maper, Bahr El Ghazal, June 30, 1999.
[580] Isaac Magok, interview, August 14, 1999.
[581] Elizabeth N. and Martha N., interview, August 18-20, 1999.
[582] Ibid.
[583] There is no exact word in Nuer for rape. Most Nuer talk about rape as "taking her as a wife."
[584] Boy soldier, Human Rights Watch interview, Nyal, Western Upper Nile, August 19,1999.
[585] Ibid.
[586] Ibid.
[587] Nyanchar R, displaced from Ler province, Human Rights Watch interview, Nyal, Western Upper Nile, August 19, 1999.
[588] Ibid.
[589] Nyacuot D., interview, August 15, 1999.
[590] The
disastrous state of maternal health in the vast unserved areas of rural
southern Sudan cannot be overemphasized. On a single afternoon, a relief
vehicle passed two different groups of people (along a thirty-kilometer muddy
road) attempting to evacuate women who were in desperate need of medical care.
One woman was in a coma from post-partum anemia and one was in labor for days
before a local practitioner cut the dead fetus out of her womb. Human Rights
Watch observation, Tonj countyCounty, Bahr El
Ghazal, August 16, 1999. See Dr. Michaleen Richer, "Overview of the Health
Situation in Southern Sudan 2002," UNICEF-OLS, Nairobi, September 2003.
[591] Elizabeth N.and Martha N., interview, August 18-20, 1999.
[592] In 1998, the Sudanese government signed the Convention to Ban Antipersonnel Landmines. It has not yet ratified the convention, but under international law it is bound by the intention indicated by its signature to abide by the spirit of the treaty.
[593] Former Nuer combatant from Ler, Human Rights Watch interview, Kenya, August 21, 1999.
[594] Anonymous medical relief worker, Human Rights Watch interview, Kenya, August 1999.
[595] Chief of Adok area, Human Rights Watch interview, Nyal, Western Upper Nile, August 20, 1999.
[596] Ibid.
[597] SSDF soldier, Human Rights Watch interview, Nyal, Western Upper Nile, August 19, 1999.
[598] Senior SSDF officer, Human Rights Watch interview, Nyal, Western Upper Nile, August 19, 1999; Christian Aid, The Scorched Earth: Oil and War in Sudan, London, March 2001, pp.13-14.
[599] Former aide to Cmdr. Tito Biel, Human Rights Watch interview, Kenya, August 21, 1999 (stating policy; this man denied seeing any such executions).
[600] Former aide to Cmdr. Tito Biel, interview, August 21, 1999.
[601] Elijah Hon Top, interview, July 26, 1999.
[602] Geneva Convention III of 1949, art. 444.
[603] Michael Wal, interview, August 18, 1999. It was not the custom to recruit or conscript girls because traditionally young women enriched their families at marriage, when bridewealth was paid in cattle to be distributed mostly among the bride's male family members over time. This also cemented the relations between the two families. If a girl were to be killed or maimed in battle, it would be a considerable economic loss to her family. Therefore neither families nor chiefs would usually consent to female conscription.
[604] Adok chief, interview, August 20, 1999.
[605] Simon,
age seventeen, from Mayandit, Western Upper Nile, Human Rights Watch interview,
Paliang, Tonj countyCounty, Bahr El
Ghazal, August 15, 1999.
[606] Michael Wal, interview, August 18, 1999 (based on his debriefing of a displaced boy inPabuong).
[607] Ibid.; boy soldier, interview, August 19, 1999.
[608] Leek Nuer former combatant, Human Rights Watch interview, Lokichokkio, Kenya, August 4, 2000.
[609] Jagei Nuer former combatant, Human Rights Watch interview, Lokichokkio, Kenya, July 29, 2000.
[610] Social worker, Human Rights Watch interview, Nairobi, August 23, 1999. Interviews, assessment, and registration of the first group of child soldiers for the Thonyor camp began in October 1998. In April 1999, a team conducted psychological social work with the boys identified, all between ages ten and eighteen. Simon Kun, interview, July 23, 1999.
[611] Ibid.; social worker, interview, August 23, 2000. RASS negotiated with the SSDF to secure the re-release of the boys. No humanitarian agencies had access to Maj. Gen. Paulino Matiep's forces at the time. When his second in command, Cmdr. Peter Gatdet, defected at Mankien in September 1999, most of his forces went with Cmdr. Peter Gatdet, including the formerly demobilized child soldiers. Child welfare worker, Human Rights Watch interview, August 10, 2000, Nairobi.
[612] By August 2000, however, he complained to U.N. officials that no supplies had arrived. John Noble, briefing, August 5, 2000.
[613] SPLA News Agency (SPLANA), "Message to the Sudanese People on the Occasion of the SPLM/SPLA 16th Anniversary," by Dr. John Garang de Mabior, Nairobi, May 18, 1999 (text of radio message).
[614] Cmdr. Peter Paar Jiek attended Wunlit as part of the Khartoum delegation sent by Riek Machar. Most of the SSDF officers already knew the SPLA officers, since most of them had been in the SPLM/A from 1983 until 1991, and had trained and/or fought together with them.
[615] Tito Biel, interview, August 19, 1999. Cmdr. Salva Kiir, chief of staff of SPLA, approved the request in the period of June-August 1999. SPLA Chief of Staff Cmdr. Salva Kiir Mayardit, Human Rights Watch interview, Nairobi, August 11, 2000. There were two shipments. Thomas Duoth, Human Rights Watch interview, Nairobi, August 23, 1999; Riek Machar, interview, August 8, 2000.
[616] Tito Biel, interview, August 19, 1999.
[617] Although in August 1999 Tito Biel said that Riek Machar had not been fully informed that the SSDF had accepted ammunition from its erstwhile enemy, the SPLA, a year later Riek Machar contradicted his commander Tito Biel and claimed that he had authorized it and controlled it all along. Riek Machar, interview, August 8, 2000. It is clear that Tito Biel understood his blanket orders from Riek Machar to be: do not let the Khartoum government take control of the Block 5A oilfields; we (the SSDF) are to protect all territory south of Bentiu. Tito Biel, interview, August 19, 1999.
[618] Elijah Hon Top, interview, July 26, 1999.
[619] "Fighting resumes near southern Sudan oilfields," AFP, Khartoum, July 6, 1999.
[620] SSDF officer, interview, August 3, 1999. U.N. OLS (Southern Sector) received reports of fighting on July 5 in the Duar, Koch, and Ler areas. U.N. OLS (Southern Sector), "Weekly Report: July 5-11, 1999," Nairobi, July 11, 1999.
[621] Makuac Youk, spokesman in Khartoum for the SSDF, said that the SSDF had killed two hundred and captured 109 of Paulino Matiep's forces. SSDF Chief of Staff Elijah Hon Top announced that his troops had recaptured all the positions lost in May in Ler and Rubkona. Joseph Manytuil, an aide to Maj. Gen. Paulino Matiep, confirmed only heavy fighting in Western Upper Nile/Unity State, and accused the SPLA of supporting the SSDF with troops. (There was no evidence that SPLA troops participated in this fighting. The SPLA soldiers are predominantly Dinka and, despite Wunlit, would risk attack by hastily combined Nuer forces if they ventured into Nuer home territory. At that time, there were no units of West Bank Nuer in the SPLM/A aside from those of Cmdr. Philip Bapiny who defected in late 1998. There was no indication that Philip Bapiny's forces were involved in the mid-1999 fighting.) "Fighting Resumes Near Southern Sudan Oilfields," AFP, Khartoum, July 6, 1999; Alfred Taban, "Pro-government groups fight in south Sudan," Reuters, Khartoum, July 6, 1999; "Fighting resumes near southern Sudan oilfields," AFP, Khartoum, July 6, 1999.
[622] U.N. OLS (Northern Sector), "Weekly Report: July 14, 1999," Khartoum, July 14, 1999.
[623] WFP News Release, "150,000 Trapped by Renewed Fighting in Sudan's Western Upper Nile Region," Nairobi, July 10, 1999.
[624] U.N. OLS (Southern Sector), "Weekly Report: 5 July – 11 July, 1999."
[625] "Conflict prevents vaccination of 50,000 Sudanese children," AFP, Nairobi, July 20, 1999.
[626] The tributaries are the Bahr al Arab River, coming from the northwest, and the Bahr El Ghazal River from the south. They become one Bahr el Ghazal (Nam) River at Wangkei.
[627] Tito Biel, interview, August 19, 1999. Cmdr. Tito Biel said the Antonovs came out of El Obeid, twice a day for seven days, and the two helicopter gunships came out of Bentiu. One of them reportedly bombed Nhialdiu when an ICRC plane was on the ground. According to an SSDF officer, in mid-July 1999 the SSDF shot down a helicopter en route from Mankien to Rubkona, but the government claimed mechanical failure. Tito Biel and his commanders did not know the name of the helicopters but described the gunships as having two propellers, one on the body and one on the tail, the larger propeller having five blades. The wheels withdrew when the helicopters took off, and they were painted camouflage. Each carried twelve gunners and two pilots. Tito Biel, interview, August 19, 1999; SSDF officer, interview, August 3, 1999. This helicopter gunship is probably the Mi-24 Hind gunship, a Soviet product. According to Military Balance 1999-2000 (Oxford, U.K.: International Institute for Strategic Studies, 1999), p. 276, Sudan then had four Mi-24Bs and five Mi-35s (export version), nine in all, of which only six were believed to be in working order. The "ordinary" helicopters, seen as they transported ammunition and arms to Maj. Gen. Paulino Matiep, were white and large. Tito Biel, interview, August 19, 1999.
[628] Human Rights Watch asked Sudan's minister of justice in late July 1999 if the reported killings of the two state ministers and others in Bentiu had been or were going to be investigated, and if those against whom there was evidence would be tried. The minister of justice replied that it was not possible to investigate such allegations because it was "too dangerous" for his staff to go to Bentiu, which he called a war zone. The undersecretary of foreign affairs told Human Rights Watch, in response to the same question, "This is a political problem. Steps are being taken." Human Rights Watch received no response to requests to meet the military officials who might have knowledge of these events. If there was an investigation, its results were never publicized. Elijah Hon Top, interview, July 26, 1999; Ali Yassin, minister of justice, Human Rights Watch interview, Khartoum, August 3, 1999; Hassan Abdin, undersecretary of foreign affairs, Human Rights Watch interview, Khartoum, August 3, 1999. See also, U.N. OLS (Northern Sector), "Weekly Report: July 14, 1999;" Alfred Taban, "Two Regional Officials Killed in South Sudan Feud," Reuters, Khartoum, July 13, 1999.
[629] (Simon) Magwek Gai Majak, UDSF/SSDF governor of Western Upper Nile, Human Rights Watch interview, Ganyliel, Western Upper Nile, April 6, 2001. He said Maj. Gen. Paulino Matiep captured him and forty-six Riek Machar supporters in Bentiu in July 1999. They were taken to the jail in Mankien, where Simon was approached by Ibrahim Shamsa El Din who urged him to "abandon the cause of the south," and speak out for unity. Ibid. Gen. Shamsa El Din, one of the chief architects of the war in the south, died in 2001 in a military air accident.
[630] The UDSF was still a registered political party and its officials held government posts, so apparently the local press was not reluctant to quote them. At the time, there was an opening in free speech in Khartoum. SSDF officer, interview, August 3, 1999.
[631] WFP
press release, "150,000 Trapped by Renewed Fighting . . . ," July 10, 1999; "Flight ban
. . . . Sudan flight ban sparks fear of humanitarian crisis,"
AFP, Nairobi, July 27, 1999.
[632] U.N. OLS (Southern Sector), "Weekly Report: 5 July – 11 July, 1999;" "Conflict prevents vaccination of 50,000 Sudanese children," AFP, Nairobi, July 20, 1999.
[633] U.N. OLS (Northern Sector), "Weekly Report: July 14, 1999."
[634] "Dialogue Breaks Down between Khartoum, Pro-government Party," AFP, Khartoum, August 17, 1999
[635] Nhial Bol, "Former Rebels Threaten to Quit Sudan's Islamic Regime," IPS, Khartoum, August 16, 1999. This article gives the rate of 1,700 Sudanese pounds per U.S. $ 1, making the incentive worth U.S. $ 29. The small amount of money at stake illustrates the poverty of the country and the low value assigned to former rebels. On July 31, 1999, one month prior to commencement of oil export, Sudan officially changed its currency from the Sudanese pound to the Sudanese dinar, which was worth ten times the pound. "Sudan Switches from Pound to Dinar," AFP, Khartoum, July 31, 1999.
[636] A top National Congress official, Ali Tamin Fartak (of the African Fertit people, former NIF/NC governor of Western Bahr El Ghazal), urged Riek Machar to abandon the UDSF and join the government party, the National Congress, if he wanted the 1997 accord to be implemented. Nhial Bol, "Former Rebels Threaten to Quit Sudan's Islamic Regime," IPS, Khartoum, August 16, 1999. Many NIF/NC members were still resentful that Riek Machar had withdrawn from the National Congress in early 1999 to form another political party, the UDSF––although he immediately registered the party with the government, which many opposition parties refused to do.
[637] "War-torn Sudan Takes Step toward National Dialogue," Reuters, Khartoum, August 21, 1999.
[638] Peter Gatdet, a Bul Nuer, was a soldier in the Sudanese army who was sent for a one-year term of service with the Iraqi army during the 1980-88 war with Iran, on account of which he was nicknamed "the Iraqi." He earned a reputation for artillery prowess later. Cmdr. Peter Gatdet was serving in the east during 1998 and was only transferred back to Western Upper Nile/Unity State, his place of origin, in 1999. Relief official, Human Rights Watch interview, Ganyliel, Western Upper Nile, April 5, 2001.
[639] (Simon) Magwek Gai Majak, interview, April 6, 2001. Cmdr. Kerubino Kwanyin Bol, a veteran of Anyanya, then officer in the Sudanese army, then a founder of the SPLM/A who defected to the government-and a gross abuser of human rights-died in the course of Cmdr. Peter Gatdet's mutiny in Mankien. Kerubino had burned his bridges to both the government and the SPLM/A by then. He went to his relative by marriage, Paulino Matiep, for refuge. Kerubino was in Mankien when Peter Gatdet captured the base. Kerubino reportedly was delayed leaving Mankien because Paulino Matiep was trying to negotiate for Kerubino's safety at the army garrison at Mayom; the army had taken a dislike to Kerubino after his defection from their ranks at Wau in January 1998, which cost the government many casualties. Human Rights Watch, Famine in Sudan, pp. 46-48. 130-34. Gatdet's forces put Kerubino to death by firing squad, according to one of the freed prisoners aligned with Riek Machar. (Simon) Magwek Gai, interview, April 6, 2000; see "Sudanese Rebel Leader Bol Said Killed in Ambush 10 Sep," Al-Sharq al-Awsat (London), Khartoum, September 13, 1999, as translated in World News Connection, September 13, 1999; "Leading Sudanese Rebel Leader Bol Reported Killed," DPA, Khartoum, September 13, 1999; "Sudan Militia Leader Said Still Alive But Tortured," Reuters, Khartoum, September 13, 1999; "Sudanese MP Says Militia Leader Behind Ex-rebel's Assassination," AFP, Khartoum, September 14, 1999; Rosalind Russell, "Sudanese Warlord Dies in Mutiny," Reuters, Nairobi, September 15, 1999; "Slain Sudanese Warlord Mourned by His 10 Wives," EastAfrican (Kampala), Khartoum, September 28, 1999; Salva Kiir, interview, August 11, 2000 (Peter Gatdet executed Kerubino).
[640] The militias of commanders Simon Gatwich of Akobo and Gordon Kong of Nasir remained loyal to the government, but well to the east of Block 5A and Western Upper Nile/Unity State. Old Fangak is in the Zeraf Island formed by the White Nile (Bahr El Jebel) on the west and the Bahr El Zeraf on the east. Most of Zeraf Island is within Block 5A although it was not under exploration by Lundin. The militia of Gabriel Tanginya of Old Fangak was separated from the Lundin-identified oilfields by vast stretches of Nile and sudd. When Old Fangak changed hands to the SPLA, Cmdr. Gabriel Tanginya's forces relocated to Poum to the east, sometimes referred to as "New Fangak."
[641] Alfred Taban, "Sudan Town Shelled by Renegade Militia," Reuters, Khartoum, October 21, 1999.
[642] Mark Turner, "Oil Fuels the Conflict in Southern Sudan," Financial Times (London), Wicok, Western Upper Nile , October 15, 1999.
[643] OLS Security closed the Bentiu area on September 21, on the grounds of safety. WFP, "Sudan Bulletin No. 105: September 19-25, 1999," Nairobi, September 25, 1999.
[644] U.N. OLS (Northern and Southern Sectors), "Joint Weekly Report: September 22, 1999," Nairobi, September 22, 1999; WFP, "Sudan Bulletin No. 104: September 12-18, 1999," Nairobi, September 18, 1999.
[645] WFP, "Sudan Bulletin No. 105: September 19-25, 1999," Nairobi, September 25, 1999.
[646] Alfred Taban, "Sudan Town Shelled by Renegade Militia," October 21, 1999.
[647] WFP, "The Security Situation in Unity State and Impact on WFP Activities: October '99."
[648] U.N. OLS (Northern and Southern Sectors), "Joint Weekly Report: 13 October 1999," Nairobi, October 13, 1999; WFP, "Sudan Bulletin No. 106: September 26-October 2, 1999," Nairobi, October 2, 1999; Alfred Taban, "Sudan Town Shelled by Renegade Militia,"October 21, 1999.
[649] U.N. OLS (Northern and Southern Sectors), "Joint Weekly Report: October 13, 1999," Nairobi, October 13, 1999; WFP, "Sudan Bulletin No. 112: November 7-13, 1999," Rome, November 13, 1999.
[650] On
September 28, 1999, relief personnel and local authorities visited Koch, Boaw,
and Pabuong, locations inside Block 5A and SSDF territory to which civilians
displaced by government forces had fled over the previous months. The relief
team discovered that life had been severely disrupted by the fighting and had
not returned to normal. The displaced Koch population was beginning to return,
but many crops had been stolen by militias or damaged by floods. The Boaw
population was hosting a "large number" of displaced persons from elsewhere in
the state, straining local resources. To the south, Pabuong had become a
transit point for displaced fleeing Koch and Ler to safer areas in Nyal and
Ganyliel (Western Upper Nile/Unity State, Block 5B) and Makuac (Tonj countyCounty,
Bahr El Ghazal, Block 5A). WFP, "Sudan Bulletin No. 106: September 26-October
2, 1999," Nairobi, October 2, 1999.
[651] In the U.N.
Consolidated Inter-Agency Appeal for Sudan, 2000, the
U.N. estimated that around 210,000 persons (after the harvest) and 547,000
persons (during the hunger gap period) would qualify for food assistance, and
food insecurity was expected to be worst, in Leech State and Ruweng countyCounty
(Western Upper Nile/Unity State). "These areas will be of particular concern to
WFP in 2000 since food deficits are more severe and access to beneficiaries are
more problematic than elsewhere in southern Sudan." Ibid., p. 16. To circumvent
insecurity and government flight bans, relief agencies planned to stockpile
basics-needed for survival in this swampy area-which could not be airdropped,
including mosquito nets, shelter material (plastic for tents), and fishing
equipment. They decided against stockpiling, however, as fighting continued.
By the hunger gap period in 2000, the situation was worse than predicted. Scorched earth attacks caused more mass movements of tens of thousands of fightened civilians. See below.
[652] Kuong Danhier Gatluak, SSDF press release, "Government of Sudan Uses Chemical Agents in Aerial Bombardment in Western Upper Nile," Nairobi, October 22, 1999. The names of the captive non-commissioned officerss were given as Cpl. Ahmed Mohammed Makin, from the Kadugli (Nuba Mountains, Southern Kordofan) auxiliary police force, and Cpl. Ibrahim Abdalla Ahmed, Damazin command (El Kurmuk, Southern Blue Nile). (The use of chemical agents was not established.)
[653] NSCC press release, "Peace Council Refuses to Be Intimidated and Documents Remarkable Progress in People-to-People Peace Process," Nairobi, October 4, 1999.
[654] U.N. OLS (Southern Sector), "Weekly Report: October 11-17, 1999," Nairobi, October 17, 1999.
[655] Kuong Danhier Gatluak, SSDF security officer, Human Rights Watch telephone interview , Nairobi, October 28, 1999. Cmdr. Peter Gatdet's forces may have obtained the landmine when they captured Mankien.
[656] Talisman officials, interview, February 3, 2000. But see "Buckee speaks on Sudan controversy," Globe and Mail (Toronto), Calgary, May 8, 2000. Talisman's British Army-trained security chief in Sudan tried to make it appear that these were two unrelated incidents: he told a journalist some shots were fired at a drilling rig location south of the Heglig oilfield, injuring two Sudanese rig hands. Within a twenty-four hour period, he said, a mine exploded in the vicinity, killing military personnel guarding the area. "Making it sound like organized combat is inaccurate," he explained. He added: "We are not trying to say there are no difficulties in the south, a region with a history of inter-factional conflict." "Seeking Riches in Sudan," Calgary Herald, November 20, 1999.
[657] U.N. OLS (Southern Sector), "Weekly Report: 11-17 October 1999," Nairobi, October 17, 1999.
[658] SSDF press release, "Government of Sudan Uses Chemical Agents . . . ," October 22, 1999.
[659] WFP, "Sudan Bulletin No. 108: 10-16 October 1999," Rome, October 16, 1999.
[660] "Talisman Says Sudan Fighting Not Affecting Oil Flow," Reuters, October 21, 1999; Alfred Taban, "Sudan Town Shelled by Renegade Militia," October 21, 1999.
[661] "Talisman Says Sudan Fighting Not Affecting Oil Flow," October 21, 1999.
[662] See International Institute for Strategic Studies, The Military Balance 1999-2000 (London: Oxford University Press, 1999), pp. 275-76.
[663] Harker report, p. 49. Biem, which the Canadian delegation visited, was some distance east of Pariang village, in an area nominally under SPLA control. Ibid., p. 46.
[664] Charlie Gillis, "Meeting the Victims of Sudan's Oil Boom," National Post (Toronto), Biem, Western Upper Nile, November 27, 1999.
[665] According to Riek Machar, the prior time was in October 1998, after the army refused him permission to expand an agricultural scheme. See above, "Contested Elections and Displacement by the Nuer Militias, 1996-98."
[666] The series of satellite photos show that the small habitation developed into a strip village, and sprouted a second small group of huts in the area also. This was all gone by the 2000 satellite photo. "Kalagate Imagery Report, Sudan Oilfield Exploration Concession," April 2001, published by Talisman Energy, Calgary. Inside the cover is the report of Geoffrey John Oxlee, Kalagate Imagery Bureau, "Report KIB/035-1/2001, Subject: Sudan Oilfield Exploration Concession," April 2, 2001, p. 7 and Figure 4: El Toor-1 & 4. These photos and analysis were presented at the Talisman annual meeting in May 2001 and selectively to the press.
[667] In prior years, effective recruitment devices had included threats that the students would not graduate, would not get a job, and would not be able to travel abroad unless they "volunteered" for the Popular Defence Force for four months and went to the front. Student PDF members in an SPLA prisoner of war camp, Human Rights Watch interview, Yei, southern Sudan, October 22, 1997.
[668]Jihad is the Arabic word for the Muslim concept of holy war or struggle.
[669] It appears that the Protectors of the Oil brigade may have been composed partly or entirely of PDF militia members. At times, the Islamist-oriented and –recruited PDF formations are referred to as mujahedeen, holy warriors.
[670] PDF commander Staff Brigadier Umar al Amin Karti said the PDF would continue to send convoys to support the armed forces at the front lines, and praised the people's support for jihad. "Sudan: President Pledges to Continue 'Jihad', Warns Against Anarchy," Republic of Sudan Radio, Omdurman, in Arabic, October 18, 1999, as translated in BBC Worldwide Monitoring, U.K., October 18, 1999.
[671] Mohamed Osman, "Sudan Leader Warns of New Aggression by the United States," AP, Khartoum, October 31, 1999.
[672] Mark Turner, "Oil Fuels the Conflict in Southern Sudan," October 15, 1999; Kuong Danhier Gatluak, SSDF press release, October 22, 1999. The government of Sudan and the SPLM announced a three-month extension of their ceasefire, starting on October 15, which the government said covered all its areas of operations in the south. WFP, "Sudan Bulletin No. 108: 10-16 October 1999," Rome, October 16, 1999; U.N. OLS (Southern Sector), "Weekly Report: October 11-17, 1999," Nairobi, October 17, 1999.
[673] SSDF unit commander Angelo Raui, twenty other officers, and four noncommissioned officers met for peace talks with Maj. Gen. Paulino Matiep, according to the UDSF. A regional government army officer invited them to his office inside a Bentiu army garrison. Allegedly the commanding army officer told Cmdr. Angelo Raui that Maj. Gen. Paulino Matiep had issued a warrant for his arrest. When Angelo Raui protested he was shot dead by gunmen in the office. His twenty-four companions were reportedly shot dead shortly afterwards outside that office. "Sudanese Faction Claims 25 Officers Killed by Rivals," AFP, Khartoum, November 3, 1999; "Southern Sudan Leader Says 25 Fighters Killed by Rival," AP, Khartoum, November 3, 1999; Mohamed Osman, "Report: 40 Killed In Fighting between Rival Southern Militias," AP, Khartoum, November 5, 1999.
[674] The Lou area includes Waat, Akobo, Yuai, and Langkein.
[675] Gabriel Yoal Dok, the UDSF party secretary in Khartoum who attended the Wunlit conference and then left the government and moved to Nairobi, was elected chairman and John Luk Jok, an SPLM/A lawyer and former commander, was elected secretary of the peace council. "Lou Nuer Peace and Governance Council Membership Elected at Waat Lou Nuer Peace and Governance Conference," November 6, 1999 (Waat), http://members.tripod.com/~SudanInfonet/Waat/ (accessed February 29, 2000). NSCC press release, "People-to-People Peace Process Makes Another Breakthrough in Uniting Lou Nuer of Upper Nile," November 12, 1999, and attached covenant of November 6, 1999.
[676] This military meeting was not sponsored by the NSCC, although some Lou Nuer military had been invited to the Lou Nuer reconciliation conference; the Lou Nuer had been split, militarily, at least three ways.
[677] Cmdr. Peter Bol Kong, chairman of UMCC (Lou); Cmdr. James Yiech Biet, deputy chairman (Eastern Jikany); Cmdr. Kuong Danhier Gatluak, secretary (Dok); Cmdr. Tito Biel Chuol (Dok),;Cmdr. David Gatluak Damai (Jagei); Cmdr. Nyuang Chuol Dhuor (Lou); and others.
[678] Cmdr. David Reath Malual (Lou).
[679] Documents concerning the formation of the South Sudan Liberation Movement and the Upper Nile Provisional Military Command Council Declaration, November 4, 1999, http://members.tripod.com/SudanInfonet/UMCC.htm, posted in January 2000 archive (accessed February 29, 2000).
[680] SSLM was the last name adopted for the Anyanya forces (in 1970 or 1971).
[681] Michael Wal Duany, SSLM press release, "South Sudan Liberation Movement: Press Announcement," Waat, Upper Nile, January 31, 2000, http://members.tripod.com/SudanInfonet (accessed February 2, 2000). Michael Wal Duany was formerly with the Workshop on Political Theory and Policy Analysis at Indiana University in Bloomington, Indiana, U.S. He served as part of the leadership team at the Wunlit conference in his capacity as a Nuer intellectual from the diaspora.
[682] Ibid.
[683] "At Least 300 Killed in Sudan Fighting-Source," Reuters, Khartoum, November 25, 1999.
[684] U.N. OLS, "Operation Lifeline Sudan Weekly Report: November 17, 1999," Nairobi, November 17, 1999.
[685] The first barge was equipped to clear the sudd from the river to permit the other two to pass.
[686] U.N. security official, confidential email, January 22, 2000; Gatluak Damai soldier, Human Rights Watch interview, Kenya, July 29, 2000.
[687] Ibid.
[688] Anonymous relief worker, Human Rights Watch interview, Nairobi, July 24, 2000.
[689] Harker report, p. 84.
[690] Ibid., p. 85.
[691] Ibid., p. 86.
[692] Riek Machar left Khartoum just before President Bashir's December 13, 1999 declaration of a state of emergency and the dissolution of the assembly. He visited European and East African capitals, where he discussed his political and military options with diplomats and others, before going to "the bush" in Koch, Western Upper Nile.
[693] The SPDF founding conference in Koch, Western Upper Nile, was facilitated by using U.N. planes under false pretenses to ferry commanders to the meeting. Southern political and military movements do not have the resources necessary to move commanders expeditiously around Upper Nile's swamps and rivers and factions-chartering planes is an expensive proposition. The commanders apparently flew to Koch in U.N. planes under the names of RASS personnel or as authorized by RASS. John Noble, interview, July 31, 2000; see Nhial Bol, "Politics-Sudan: Talks on the UN Plane Hostage hit a snag," IPS, Khartoum, February 8, 2000; Carola Hoyos and Mark Turner, "UN neutrality 'unwittingly compromised in Sudan'," FinancialTimes (London), Nairobi, March 9, 2000.
[694] John Luk Jok, "The Political and Military Dynamics in western Upper Nile," South Sudan Post (Nairobi), May 2000, pp. 11-14.
[695] Ibid. Reportedly Riek Machar's representatives made an attempt to meet with Cmdr. Galwalk Gai, Peter Gatdet's ally, at Galwalk Gai's home base in Boaw, but the commander declined because he disliked Riek Machar, and no meeting took place. Former Dok Nuer combatant, Human Rights Watch interview, Kenya, July 31, 2000; former Nuer combatant in Nimne, Human Rights Watch interview, Kenya, July 31, 2000; John Noble, interview, July 27, 2000.
[696] The constitution of the SPDF, dated January 2000, can be found on the group's website, http://www.usinternet.com/users/helpssudan/WebSPDFconst.html (accessed November 28, 2000).
According to Riek Machar, the Nuer reconciliation conference came first, from January 25, followed by the conference with military leaders, after which he decided to resign from the government and then to form the SPDF. Riek Machar, interview, August 8, 2000. Others believe that the SSLM press release of January 31, 2000 announcing the formation of a (rival) Nuer political party was the triggering event that led to Riek Machar's unusual manner of resignation by radio message at night from the field, without consultation or warning to his exposed cadres in Khartoum.
[697] Among the sixteen UMCC commanders who rallied to Riek Machar were the top three of the UMCC, Cmdr. Peter Bol Kong, Cmdr. James Yiech Biet, and Cmdr. Kuong Danhier Gatluak.
[698]This working relationship was limited to Western Upper Nile/Unity State, as the various factions had different relations in other parts of Upper Nile. In Eastern Upper Nile, for instance, the Riek Machar SPDF forces were hammered by the government militia of Cmdr. Gordon Kong.
[699] Because the resignation took place unconventionally, over high frequency radio, the Khartoum government was slow to accept it. Government officials radioed back to Riek Machar in Koch, and he agreed to meet a Khartoum delegation in Nairobi for further discussions about his resignation. John Luk Jok, "The Political and Military Dynamics in Western Upper Nile," South Sudan Post (Nairobi), May 2000, p. 12.
[700] Brig. Gen. Gatluak Deng was removed from his positions in late 2002 by President El Bashir, and former state governor Riek Gai was appointed head of the SSCC while Maj. Gen. Paulino Matiep was named commander-in-chief of the SSDF.
[701] The SPDF was off to a poor financial start. It was difficult to raise the money for a chartered plane (often U.S. $ 6,000) to pick up this group. See Riek Machar, interview, August 8, 2000.
[702] Lundin Oil press release, "Testing of Thar Jath Well Onshore Sudan Delayed," Geneva/Stockholm, February 22, 2000.
[703] Paul Wilson, interview, May 16, 2001.
[704] Thomas Duoth, interview, July 22, 1999.
[705] Lundin Oil press release, "Further delay in Sudan, January Production Update," Geneva/Stockholm, dated March 21, 2000.
[706] According to rebel combatants, the road crews they saw were Chinese. Leek Nuer combatants, interviews, August 1, 3-4, 2000.
[707] Different rebels gave different reasons for why they never attacked the new Bentiu bridge: one said that they did not know about it; another said they lacked ammunition. Cmdr. Peter Gatdet reportedly faulted Cmdr. Peter Paar for allowing the Bentiu bridge to be built in Peter Paar's sector.
[708] The
interviews took place in Nimne during in January 2001. Diane deGuzman, former
OLS Humanitarian Laws Principles officer, briefing, Washington DCWashington,
D.C., May 8, 2001.. She was told by a RASS relief worker from Kuey
that other Kuey residents had fled three days' walk into the swamp east of
Kuey, in the direction of the Nile.
[709] "Drilling Takes Off In New Oilfield," PANA, Khartoum, January 26, 2000.
[710] Ibid.
[711] Ibid.
[712] Confidential communication from relief source, May 1, 2000.
[713] John Luk Jok, "The Political and Military Dynamics in Western Upper Nile," South Sudan Post (Nairobi), May 2000, p. 13.
[714] SPLA Cmdr. Peter Gatdet provided ammunition (which he obtained from the SPLA) to Cmdr. Peter Paar of the SPDF (Riek Machar's forces) during April 2000, according to Michael Wal Duany, head of a rival group. Michael Wal Duany, Human Rights Watch interview, Nairobi, August 7, 2000.
[715] Leek Nuer former combatant, Human Rights Watch interview, Kenya, August 3, 2000.
[716] Ibid.
[717] Dok Nuer former combatant, interview, July 31, 2000.
[718] Ibid.
[719] "Riik is two days north from Nhialdiu, and between Bentiu and Pariang. People living there before were Leek but their place was destroyed and the Arabs live there now. The Leek left long ago, maybe before I was born. Some Pariang Dinka live there now. My parents now live in Nhialdiu. They and my big brother were born in Riik." Leek Nuer former combatant, Human Rights Watch interview, Kenya, August 1, 2000.
[720] Ibid.
[721] Ibid.
[722] Julie Flint, "Britain Backs Ugly War for Oil," Observer (London), April 16, 2000. The journalist, who has covered Sudan for years, told Human Rights Watch that she found these witnesses credible. Julie Flint, Human Rights Watch interview, Kampala, Uganda, July 12, 2000.
[723] "Britain Backs Ugly War for Oil," April 16, 2000.
[724] Ibid.
[725] Cmdrs. Peter Gatdet and Peter Paar appparently agreed to a division of terrritory in Western Upper Nile/Unity State: Cmdr. Peter Gatdet (SPLA) was assigned Wangkei and Mayom (Bul Nuer territory, Block 4), and Cmdr. Peter Paar (SPDF/SSDF) had Bentiu, Ryer/Thar Jath, Ler, and Adok (territory of the Leek, Jikany, Jagei, and Dok Nuer, all in Block 5A). Gathon Jual, interview, July 31, 2000. This roughly corresponded with the allegiances of the local population. Each commander claimed the loyalty of his own ethnic group (Gatdet: Bul; Paar: Dok). The Leek were mostly aligned with the Bul Nuer commander, Peter Gatdet, the Nyuong with their Dok neighbors. The Jikany and Jagei were divided between Peter Gatdet and Peter Paar, with commanders from both groups on each side.
[726] Leek Nuer former Gatdet combatant, Human Rights Watch interview, Kenya, August 4, 2000.
[727] Ibid.
[728] Ibid.
[729] Former Block 1 Leek Nuer combatant in Peter Gatdet's forces, Human Rights Watch interview, Kenya, August 1, 2000.
[730] Ibid.
[731] In February-March 2000, the ICRC reportedly held a program on the rules of war for fifty-five then seventy-five Peter Gatdet officers that lasted one week. John Noble, interview, July 31, 2000.
[732] Christian Aid, The scorched earth: Oil and war in Sudan, London, March 2001.
[733] Julie Flint, "Desperation in Sudan," Dagens Nyheter (Stockholm), March 15-16, 2001. One of the persons interviewed originally lived in Wicbar, south across the river from Rubkona. Helicopter gunships attacked Wicbar in February 2000, and government army soldiers burned and looted, destroyed all the grain, and killed two fifteen-year old boys who were guarding the animals. The man fled to Nhialdiu from where he was displaced by a government attack in July. He then fled to Bahr El Ghazal. The journalist interviewed this same man in Nhialdiu in May 2000 and for the second time in Bahr El Ghazal in April 2001. Ibid.
[734] (Simon) Magwek Gai Majak, interview, April 6, 2001.
[735] Nimne was a secure location, protected by the Dudur River from the garrison town of Bentiu, which was some hours away on foot to the southwest. (Map C) The Dudur River was deep even in the dry season and surrounded on both banks by toic or swamp. Although no roads were open to Nimne, many civilians took refuge there from their own burned-out homes because the area had a suitable all-weather air strip for food drops.
[736] "Gatdet knows how to cross the river. He did not do anything to civilians," one source who witnessed the attack said. Former Nuer combatant in Nimne, interview, July 31, 2000. The reason for the difference in dates between June 26 and July 7 is not clear, but it appears that during that period both forces were deployed in a way that each thought defensive and that the other side took as aggressive. Inevitably small clashes pushed the situation over the edge to war.
[737] RASS administrator, interview, August 10, 2000. David Gatluak Damai (Jagei) (SPDF) allegedly met the Paulino Matiep militia outside Bentiu, where Maj. Gen. Paulino Matiep's deputy commander Pachuar Chuangi supplied the SPDF with ammunition. SPDF commander James Lial Dieu is alleged to have received ammunition from Paulino Matiep's militia inside Bentiu also. Ibid.
[738] Riek Machar denied that any of his commanders were taking arms from the government, and said that they had ammunition "stockpiled." He offered no other explanation for the sudden supply of ammunition. Riek Machar, interview, August 8, 2000. Riek Machar separately told one expatriate that the Khartoum-appointed governor of Western Upper Nile/Unity State had offered peace talks to the SPDF through SPDF governor (Simon) Magwek Gai Majak. In the course of these talks, the Khartoum governor sent weapons and bullets to Governor Simon in Koch on June 20, as a "token of peace." Expatriate resident in the area, Human Rights Watch interview, Lokichokkio, Kenya, August 2, 2000. But Governor Simon had yet another story. "Peter Paar can run short of ammunition and buy more from the muraheleen [Baggara]. . . . For one cow you can get two boxes of ammunition. Now they come to the north of Nimne [to sell ammunition]." (Simon) Magwek Gai, interview, April 6, 2001. Taban Deng acknowledged to Human Rights Watch that the SPDF had received one shipment of ammunition from the government in 2000, but not until October/November 2000, in order to "survive." Taban Deng, interview, April 9, 2001.
[739] Nyuong Nuer community leader, Human Rights Watch interview, Ganyliel, Western Upper Nile, April 5, 2001.
[740] But Riek Machar did not know the names of any of the commanders (alternate commanders and captains) or other officers who defected to him, which detracts from the credibility of this version of events. Riek Machar claimed that two hundred men also defected to him (then SPDF) from government militia leader Cmdr. Gabriel Tanginya in Old Fangak. This might have made it look to outsiders that government militia was fighting with the SPDF, but actually they had just abandoned the government, he claimed. Riek Machar, interview, August 8, 2000.
[741] Salva Kiir, interview, August 11, 2000.
[742] Lundin Oil press release, "Record for the Nine Months Ended 30 September 2000: Record Profit," Geneva, November 14, 2000.
[743] Christian Aid, The Scorched Earth: Oil and war in Sudan, London, March 2001.
[744] Koblanck, "Lundin Oil's road/DN in Sudan," April 28, 2001.
[745] Ibid.
[746] Ibid.
[747] Ibid.
[748] Richard Ramsey, Lundin security officer, as quoted in ibid.
[749] Ibid.
[750] The major cause of this high rate found among children was "inadequate dietary intake" because "[r]elief food has been erratic over the past 5 months due to insecurity." Relief food made up 76 percent of the intake of the displaced people. WFP, "WFP Sudan Monthly Overview-January 2000," Rome, January 31, 2000, p. 10.
[751] CARE found that eighty percent of the displaced's households were headed by females, of whom 30 percent were pregnant or nursing; about 20 percent of the displaced were elderly. WFP, "Sudan Bulletin No. 120: 1-15 February 2000," Rome, February 15, 2000.
[752] WFP, "Sudan Bulletin No. 120: 1-15 February 2000," Rome, February 15, 2000. Rapid interventions by relief officials are limited to only a few hours on the ground for food delivery. Insecurity restricted the presence of WFP staff inside Bentiu "to six hours a day when possible" in February 2000. The price of grains in the market trebled during that month, making food too expensive for most internally displaced persons. WFP, "Sudan Monthly Overview-February 2000," Rome, February 29, 2000.
[753] "Sudan: Huge number of war-wounded," ICRC News no. 17, Geneva, May 11, 2000.
[754] John Noble, interview, July 31, 2000.
[755] MSF, Violence, Health, and Access to Aid, p. 29. The attack on Koch, which occurred the day after the September 27, 2000, delivery by air of medical and other non-food relief items, was conducted by Peter Gatdet/SPLA commander James Gatluak Gai. Apparently, these rebels were after the delivered items. Koch is where the Peter Paar forces killed Peter Gatdet troops in December 1999 in a tense standoff (see above). Email, Julie Flint to Human Rights Watch, February 21, 2001, based on field interviews.
[756] ORCD, "Humanitarian Assessment Mission to Western Upper Nile Region: Bul, Leek, Jagei and Jikany Counties, November 5-20, 2000," by Koang Tut Doh Nairobi, December 12, 2000. ORCD stands for Organization for Relief and Community Development.
[757] The
estimates were: Bul countyCounty:
250,000-300,000; Leek countyCounty:
180,000-200,000; Jagei countyCounty:
100,000-120,000; and Jikany countyCounty:
40,000-60,000, total 570,000- 680,000. Ibid.
[758] ORCD, "Humanitarian Assessment Mission to Western Upper Nile Region," p. 11.
[759] Ibid.
[760] MSF press release, "Doctors Without Borders/MSF Survey: Alarming malnutrition rates in Western Upper Nile, Southern Sudan," Nairobi/New York, July 6, 2000.
[761] Ibid.
[762] OCHA, U.N. OCHA Consolidated
Inter-Agency Appeal for Sudann, 2001, p.
2, see http://www.reliefweb.int/.
[763] WFP, "Sudan Bulletin No. 120: 1-15 February 2000," Rome, February 15, 2000.
[764]Consolidated Appeal, 2001, p. 11.
[765] "Over
100 pro-government militia commanders meeting in Juba," Khartoum Monitor,
April 25, 2001; "Pro-government militias to be unified under army supervision,
says official," Republic of Sudan Radio, Omdurman, in Arabic, March 4,
2001, as
translated inBBC
Monitoring Service, U.K., March 4,
2001.
[766] The provisional military council of the SSDF announced on April 27, 2001, was as follows: Cmdr., Maj. Gen. Paulino Matiep (Bul Nuer); Deputy Commander (D/C) and Cmdr. For Operations Gordon Kong Chol (Eastern Jikany Nuer); D/C for administration Cmdr. Emmanuel A. Ocholimoi (Latuka); D/C for logistics and supplies Maj. Gen. Ismail Konyi (Murle); D/C for security and intelligence Cmdr. Elio Benson Otome (Acholi); D/C for training Cmdr. Ater Benjamin Bil (Dinka Agar); D/C for political mobilization Cmdr. John Macham (Dinka Bor/Twic); D/C for mobile force Cmdr. Simon Gatwich Dual (Lou Nuer, Waat); Cmdr. Equatoria military area Martin Terensio Kenyi (Bari); Cmdr. Upper Nile military area Brig. Gabriel Tanginya (Lak Nuer); Cmdr. Bahr El Ghazal military area Maj. Gen. Tom El Nur (Kreish, the largest of the Fertit groups in western Bahr El Ghazal). The Didinga, Mandari, and Toposa militias did not appear to be represented in the leadership.
[767] "Conference ends with unification of southern factions," Khartoum Monitor, April 28, 2001.
[768] See Human Rights Watch, Civilian Devastation.
[769] Prior Gatdet/Paar fighting in 2000 in Block 5A was not considered a violation of Wunlit, because there was no perceptible Nuer-Dinka faceoff; it was intra-Nuer fighting.
[770] U.S.
Department of State Press Statement, "Report of Attack on UN Relief Base in
Southern Sudan," Washington DCWashington, D.C.,
March 1, 2001.
[771] West Bank Peace Council meeting, Ganyliel, Western Upper Nile, April 5-7, 2001, resolutions.
[772] In Eastern Upper Nile, the SPDF had continued to cooperate with the SPLA forces against the government and the progovernment forces of Nuer militia leader Cmdr. Gordon Kong Chuol. Biel Torkech Rambang, Human Rights Watch interview, Washington, D.C., March 14, 2001.
[773] Local Nuer leader, Human Rights Watch interview, Eastern Upper Nile village, July 29, 2002.
[774] Residents of Eastern Upper Nile village where Riek Machar spoke in March 2001 which was then "captured" by SPLA from SPDF in May 2001, Human Rights Watch interviews, Eastern Upper Nile, July-August 2003.
[775] SPLA radio operator, Human Rights Watch interview, Eastern Upper Nile village, July 31, 2002.
[776] SPLA alternate commander, Human Rights Watch interview, Eastern Upper Nile village, July 31, 2002.
[777] "Declaration on Unity Between the SPDF and SPLM/SPLA," Nairobi, May 28, 2001, signed by Dr. Justin Yaac Arop and Prof. George Bureng Nyombe for the SPLM/A, and by Cmdr. Taban Deng Gai and Cmdr. James Kok for the SPDF. Both sides stated in the declaration that they had been "fully mandated by the leaders of the two movements."
[778] "The SPLA-SPDF Declaration: Unity or Defections?" South Sudan Post (Nairobi), p. 21.
[779] SPDF press release, "SPDF Peace Committee Clarifies the Declaration of Unity Between the SPLA and the SPDF," Nairobi, dated May 28, 2001. http://www.usinternet.com/users/helpssudan/SPDFpress33.jpg (accessed May 30, 2001). The signatories were Dr. Costello Garang Riny, Simon Kun Pouc (of RASS), Cmdr. Kuong Dahnier Gatluak (security/military intelligence), Cmdr. Nyang Chuol Dhora, and Professor Gabriel Geit Jal.
[780] "Sudan:
Rebel official comments on merger between two southern groups," Al Rai al
A'am web site, in Arabic, Khartoum, May 30, 2001, as translated in BBC
Monitoring Serviivce, U.K.,May 30, 2001.
[781] "Western Upper Nile Koch Peace Covenant," Upper Nile People to People Peace and Reconciliation Conference, Koch, Western Upper Nile/Unity State, January 26-February 1, 2002.
[782] Nairobi Declaration of Unity, as reproduced in "The SPLM/A and SPDF Have Merged into one Movement," South Sudan Post (Nairobi), January 2002, p. 6.
[783] "Consolidating Unity of the Movement," South Sudan Post (Nairobi), February 2002, pp.4-5.
[784] Ibid.
[785] Ten
months later, however, the integration of the two forces was still lagging
behind as SPLM/A peace talks with the government proceeded apace. After Riek
Machar met in 2002 with Sudanese President Omar El Bashir, suddenly the SPLM/A
moved to consolidate the integration of the SPDF into the SPLM/A. "Sudan:
President discusses peace with southern rebel leaders in Kenya," Republic of
Sudan Radio, Omdurman, in Arabic, October 16, 2002, as translated in BBC
Monitoring Service, U.K., October 16,
2002; "Approval of Special Joint Committee Recommendations," signed by Dr.
John Garang de Mabior and Dr. Riek Machar Teny-Dhurgon, Nairobi, October 23,
2002.
[786] John Garang, as quoted in "Making Politics and War Together, " Africa Confidential (London), March 8, 2002, p. 5.
[787] Sudan Alliance Forces (SAF) Political Department press release, "The Historic Unification of the Sudan People's Liberation Movement (SPLM) and the Sudan Alliance Force (SAF)," Asmara, Eritrea, March 15, 2002.
[788] Summary of Tito Biel's press briefing aired on Sudan TV on February 2, 2002. Email from viewer, February 5, 2002. This confirmed a report by Nuer activists who saw Cmdr. Tito Biel Chuor and Capt. Mark Liah, also of Riek Machar's forces, being smuggled out of the Jomo Kenyatta International Airport in Nairobi on a Sudan Airways plane. Western Upper Nile Information Desk – South Sudan, topic no. 002/Jan/001/2002, "Senior SPDF Commander Tito Biel Chuor and Captain Marko Liah defected to Khartoum," Nairobi, January 30, 2002.
[789] See "The United States: Diplomacy Revived."; Human Rights Watch backgrounder on the Danforth report, at http://hrw.org/backgrounder/africa/danforth-bck0515.htm (accessed November 3, 2002).
[790] Cmdr. Peter Gatdet, interviewed on April 24, 2001, by John Ryle and Georgette Gagnon, "Report of An Investigation into Oil Development, Conflict and Displacement in Western Upper Nile, Sudan," London and Toronto, October 15, 2001, p. 27. A report by a Khartoum-based Canadian consular officer, Nicholas Coghlan, confirmed that the location had been attacked by Cmdr. Peter Gatdet. Ibid.
[791] Quoted in "Report of an Investigation into Oil Development," p. 29.
[792] People in Nimne reported that they heard bombing from that location in late January. Email, OLS worker to Human Rights Watch, February 9, 2001 (anonymity requested).
[793] Ibid.
[794] "Sudanese rebels claim attack on oil regions of Sudan, killing dozens," AFP, Cairo, January 27, 2001.
[795] Yusuf Khazin, "Southern Sudan rebel commander comments on oilfield attacks, uranium extraction," location "at a forward position on the front line close to the oilfields in the Bentiu area," Al-Hayat (London), July 31, 2001.
[796] SPLM/A press release, "SPLA Forces Destroy a Big Enemy Convoy in Oilfields," Nairobi, June 12, 2001.
[797] Peter Strandberg, "Bloody War Over Sudan's Oilfields," Goteborgs-Posten (Goteborg, Sweden), Chot Jok, Western Upper Nile/Unity State, June 26, 2001.
[798] SPLM/A press release, "SPLA Destroys Another Huge Enemy Convoy in Western Upper Nile (WUN)," Nairobi, July 6, 2001. The press release said that the ambush occurred on July 1 and the convoy was destroyed after three days of fighting on July 4. Yusuf Khazin, "Southern Sudan rebel commander comments on oilfield attacks,," July 31, 2001.
[799] "Beshir vows to hold onto oilfields amid mobilization against rebels," AFP, Khartoum, June 7, 2001.
[800]SPLM/A press release, "SPLA Destroys Heglig Oil Rig and Helicopter," Nairobi, August 9, 2001.
[801] "Report of an Investigation into Oil Development," p. 31.
[802] Ibid., p. 28, quoting a well-placed nongovernmental source.
[803] "SPLA says it killed 429 Sudanese soldiers in attacks on oilfields," AFP, Cairo, October 21, 2001.
[804] "Depopulating Sudan's Oil Regions, January to March 2002," by Diane deGuzman, edited by Egbert G.Ch. Wesselink, for the European Coalition on Oil in Sudan (ECOS), Amsterdam, May 14, 2002, pp. 3, 6-8.
[805] Ibid., pp. 3, 6-8, 12.
[806] Georgette Gagnon and John Ryle, "Report of an Investigation into Oil Development, Conflict, and Displacement," Toronto and London, May 15, 2001 (Preliminary Report, May 15, 2001). This was a summary of the investigation. The full report was issued on October 15, 2001. Georgette Gagnon is an international lawyer who was a member of the Harker team and later a U.N. supervising attorney for 140 U.N. human rights officers in Bosnia. John Ryle is Anthropology and Africa Editor of the Times Literary Supplement (London) and Chair of the Kenya and U.K.-based Rift Valley Institute. He was a U.K. government nominee to the U.S. State Department-sponsored International Eminent Persons Group reporting on Slavery and Abduction in Sudan in 2002.
[807] See, e.g., Andrew Harding, "Sudan rebels threaten oil workers," BBC News Online, April 8, 2001 (quoting John Wijial, who "walked for five days through the bush after his home was attacked by a helicopter gunship. He said two of his children had been killed.").
[808] Nicholas Coughlan, Canadian consular officer with the Department of Foreign Affairs and International Trade, Khartoum, email dated March 1, 2001, quoted in "Report of an Investigation into Oil Development," p. 31.
[809] Ibid.
[810]Jane's All the World's Aircraft, 1993-94 edition (Surrey, U.K.: Jane's Information Group, 1993), pp. 294-95.
[811] Charlie Gills, "Talisman airstrip used by military, CEO discloses," National Post (Toronto), January 14, 2000; Talisman Energy, Corporate Social Responsibility Report 2000, Sudan Operations," April 2001, p. 14.
[812]
"Statement by John Dor, Governor of Unity State, Sudan," May 2001, email
attachment, from Reg Manhas, Senior Advisor, Corporate
Responsibility, Talisman Energy,Talisman, email
attachment to Human Rights Watch, May 23, 2001. John Dor Majok was
appointed governor of Wihda (Western Upper Nile/Unity) State by order of
President Omar el Bashir in February 2001. "Sudan: President Bashir appoints
state governors," Sudan TV, Omdurman, in Arabic, February 23, 2001, as
translated inBBC
Monitoring Middle East,February
28, 2001 World Reporter. Neither source addresses arms and ammunition.
[813] It is estimated that the majority of the government troops are poverty-stricken and/or conscripted southerners and westerners.
[814] Email, OLS worker to Human Rights Watch, February 9, 2001 (anonymity requested).
[815] Statement by John Dor, May 2001.
[816] Email, OLS worker to Human Rights Watch,, February 9, 2001. The chief was interviewed in February 2001 in Nimne, to which he and his followers had fled.
[817] Reverend Gary Kusunoki came from the California organization Safe Harbor International Relief, the missionary arm of Calvary Chapel-described by the Newsweek reporter accompanying him as a fundamentalist church from Orange County, California. The reverand oversaw the delivery of twenty tons of goods to the Nhialdiu area over three days by plane from Lokichokkio, 500 miles to the south. The goods included supplies of medicine, corn, soap, Bibles in Nuer, and 440 pounds of salt, a valuable commodity. Tom Masland, "Soldiers of Christ," Newsweek (New York), April 9, 2001.
[818]
Testimony of Gary Kusunoki before the House Committee on International Affairs,
Washington
DCWashington, D.C., March 28, 2001.
[819] Masland, "Soldiers of Christ." p. 18.
[820] Ibid.
[821] Testimony of Gary Kusunoki, March 28, 2001.
[822]
Masland, "Soldiers of Christ,." p. 19.
[823] "Rebels Claim 254 Government, Allied Troops Killed in Southern Sudan," AFP, Nairobi, December 19, 2001. The SPLM/A claimed victory, reportedly killing 130 soldiers and capturing a number of rifles.
[824] U.N. Security Situation Report, week 50/51/52, Khartoum, December 10-30, 2001. Tanginya was wounded in the incident, his body guard and one of his wives killed. Nine soldiers were killed and nineteen wounded badly enough to warrant evacuation to Khartoum. Ibid.
[825] It was in SPLA hands at the time of a Human Rights Watch visit in June 2003, despite several attacks on it that year.
[826] "On the 20th of December 2001 at around 17:00 hrs the Lundin helicopter (operated by Gulf Air) was shot at and hit by (at least) small arms fire. This incident took place approx. 100-km south of Rubkona. The Pilot (Australian) was hit by a bullet and evacuated to Johannesburg (South Africa) for treatment. Also, two GoS military were hit by shrapnel." U.N. Security Situation Report, week 50/51/52, December 10-30, 2001.
[827] Email, journalist to Human Rights Watch, February 20, 2002 (confidentiality requested); email, relief worker to Human Rights Watch, February 21, 2002 (confidentiality requested).
[828] SPDF press statement, "The SPDF forces Lundin Petroluem out of Block 5A in Western Upper Nile," January 22, 2002, including photos of captured equipment, http://www.usinternet.com/users/helpssudan/SPDFpress39.html (accessed June 24, 2002).
[829] "Sudan: Government and SPLA clash in Upper Nile," IRIN, Nairobi, January 24, 2002.
[830] Lundin press release, "Lundin Petroleum Announces a Temporary Suspension of Activities in Block 5A Sudan," Stockholm, January 22, 2002.
[831] SPDF press statement, "SPDF kills 165 enemy soldiers in Western Upper Nile," Nairobi, January 28, 2002, http://www.usinternet.com/users/helpssudan/SPDFpress40.html (accessed June 25, 2002).
[832] Ibid.
[833] "Oilfield, Battlefield," Africa Confidential (London), March 8, 2002, p.4.
[834] Ibid.
[835] Christian Aid and DanChurchAid, "Hiding Between the Streams. An Advocacy and Humanitarian Assessment Trip to Western Upper Nile March 28th – 31st 2002," Nairobi, London, and Copenhagen, April 11, 2002, pp. 5-6.
[836] SPDF press statement, "Battle over Leer airstrip," Nairobi, February 2, 2002, http://www.usinternet.com/users/helpssudan/SPDFpress42.html (accessed June 25, 2002).
[837] "Hiding Between the Streams," p. 5.
[838] Ibid.
[839] "Depopulating Sudan's Oil Regions," p. 10
[840] "Depopulating Sudan's Oil Regions."
[841] "Hiding Between the Streams."
[842] "Depopulating Sudan's Oil Regions," p. 14.
[843] Ibid., p. 11.
[844] "Hiding Between the Streams," p. 3.
[845] Ibid., p. 1.
[846] Ibid., p. 4.
[847] Gary W. Kenny, KAIROS Researcher/Policy Advocate, "Report of an Investigation into Forced Displacement in the Town of Mankien, Western Upper Nile," April 2002. The researcher visited Twic County in northern Bahr El Ghazal where he interviewed the displaced Bul Nuer.
[848] "Report of an Investigation into . . . Mankien," p. 9.
[849] Nyewit Jaguna, interview, February 14, 2001, quoted in ibid., p. 8.
[850] Ibid., p. 6.
[851] Frank Norbury, "Playing God in Hell, Field Report from Sudan, Western Upper Nile Area," ICI Foundation, February 28, 2002, p. 2. The ICI Foundation is the nonprofit arm of International Charter Inc. (ICI), a frequent contractor to various U.S. agencies including the State Department. http://www.icioregon.com/index.htm (accessed June 24, 2002). ICI provided relief and protection and evacuation services for the U.N. and U.S. in West Africa; its armed defense of the U.S. embassy in Monrovia in 1996, logistical services in delivery of forty tons of food to refugees the WFP could not reach, and other services in Liberia won it the State Department's award of "Small Business Contractor of the Year." http://www.icioregon.com/nomination.htm (accessed June 24, 2002). ICI was brought into Sudan by pressure from U.S. congressmen frustrated that the State Department was perceived to be sitting on funds allocated to help the south "protect civilians from Sudan government attacks," according to an ICI representative. Human Rights Watch interview, Washington, D.C., March 2002. ICI was promised a "grant" of U.S. $ 1 million by the State Department to train paramedics destined to work with the SPLA forces, although it was skeptical that it would ever see that funding and within a few months was no longer operating in Sudan. Ibid.
[852] "Playing God in Hell."
[853] Ibid. His summaries are based on his interviews with SPLA officers, displaced persons and chiefs, and six Sudanese government army soldiers that had defected to the SPLM/A after the battle of Nhialdiu. "Debriefing the soldiers resulted in their confirmation of a large number of civilian casualties in the town and surrounding areas. They confirmed that the casualties were caused by [Sudanese government] small arms fire, helicopter gun-ships and bombing of the town. Exact numbers could not be determined." Ibid.
[854] "Hiding Between the Streams;" "Depopulating Sudan's Oil Regions, January-March, 2002."
[855] There is a relief airstrip at Nhialdiu but nothing resembling a modern airport. The SPLA does not have an airforce.
[856] "Depopulating Sudan's Oil Regions," p. 18.
[857] "Sudan: 'Extreme concern' at potential food crisis," IRIN, Nairobi, January 10, 2001.
[858] WFP press release, "Acute hunger set to hit Sudan as war continues and drought unfolds," Nairobi, February 13, 2001.
[859] Letter, Nicholas Siwinga, WFP Country Director Sudan, Khartoum, to Alastair Lyon, Reuters Bureau chief, Cairo, February 21, 2001.
[860] "Fighting the Main Cause of Displacement," IRIN, Nairobi, May 16, 2001.
[861] "Malnutrition Rates In Bentiu 'Among the Highest,'" IRIN, Nairobi, April 30, 2001.
[862] "The
SPLA Commissioner of Ruweng countyCounty was
interviewed by the investigators at Padit airstrip, where craters from bombing
raids and burned houses from ground attacks were readily visible." "Report of
an Investigation into Oil Development," p. 31.
[863] Greg Palkot, "Oil Fuels Fighting in Sudan," Fox News, Padit, Sudan, July 20, 2001.
[864] "Polio Outbreak Confirmed in Western Upper Nile," IRIN, Nairobi, July 25, 2001.
[865] "U.N. seeks assurance for probe of Sudan polio case," Reuters, U.N., July 27, 2001.
[866] "Depopulating Sudan's Oil Regions," p. 3, 6. Another human rights investigating team estimated that the government of Sudan had displaced between 50,000 and 75,000 civilians from Rubkona County (Block 1) during this period. "Hiding Between the Streams," pp. 3, 9, 10.
[867] Ibid., p. 4.
[868] "Depopulating Sudan's Oil Regions," p. 3.
[869] WFP/OLS Southern Sector, "Internally Displaced Persons in Southern Sudan," Briefing document prepared for the U.N. Inter-Agency Network on IDP's in Sudan, March 2002, p. 2.
[870] "Report on the situation of human rights in the Sudan," prepared for the General Assembly by Leonardo Franco, Special Rapporteur on the situation of human rights in the Sudan, A/54/467, agenda item 117 (c), October 19, 1999.
[871] "During my visit I gathered further evidence that oil exploitation
leads to an exacerbation of the conflict with serious consequences on the
civilians. More specifically, I received information whereby the Government is
resorting to forced eviction of local population and destruction of villages to
depopulate areas and allow for oil operations to proceed unimpeded. I was
informed that all the villages around Nhialdiu, in Nimne, south of Bentiu, have
been burnt to the ground and crop has been destroyed. Similarly, all the
villages along the road up to Pulteri [Pultutni], in the surrounding of the
oilfields at Rier, have been razed." Oral statement of the special rapporteur
on human rights in Sudan Gerhartd Baum to the
U.N. Commission on Human Rights, Geneva, March 19-April 2729,
2001, http://www.unhchr.ch/huricane/huricane.nsf/0/072FE7F713DE0F4FC1256A29002A3757?opendocument
http://www.unhchr.ch/huricane/huricane.nsf/NewsRooms?OpenFrameSet(accessed sSeptember 16, 2003June 20, 2002).
[872] "There is a bad climate in Sudan as far as human rights are concerned. . . . The situation now is worse than one year before. . . . It is a fact that oil is fueling the war," Gerhart Baum said in London. Mara D. Bellaby, "Human rights violations in Sudan are increasing, official says," AP, London, June 27, 2001.
[873] Statement of special rapporteur on human rights in Sudan, to U.N. General Assembly, A/56/336, New York, September 7, 2001, http://www.unhchr.ch/huridocda/huridoca.nsf/AllSymbols/6AAED3320D897CC9C1256AE1004CEAE3/$File/N0153058.pdf?OpenElement (accessed August 13, 2003).
[874] Report of the special rapporteur, Gerhart Baum, to the U.N. Commission on Human Rights, "Situation of human rights in the Sudan," E/CN.4/2002/46, Geneva, January 23, 2002, http://www.unhchr.ch/Huridocda/Huridoca.nsf/TestFrame/64639579934bf6dcc125669d002cfbcd?opendocument (accessed June 20, 2002).
[875] Ibid.
[876] Ibid.
[877] Ibid.
[878] Ibid.
[879] Ibid.
[880] "Report on the situation of human rights in the Sudan," prepared for the U.N. Commission on Human Rights by Gerhart Baum, Special Rapporteur on the situation of human rights in the Sudan, E/CN.4/2003/42, January 6, 2003, http://www.unhchr.ch/huridocda/huridoca.nsf/AllSymbols/898215E39269A2A3C1256CD3004BA3D8/$File/G0310060.pdf?OpenElement (accessed August 13, 2003); "Report on the situation of human rights in the Sudan," prepared for the U.N. General Assembly by Gerhart Baum, Special Rapporteur on the situation of human rights in the Sudan, A/57/326, August 20, 2002, http://www.unhchr.ch/huridocda/huridoca.nsf/AllSymbols/BFD92A8B2481E657C1256C5D003360C5/$File/N0253192.pdf?OpenElement (accessed August 13, 2003). "The Special Rapporteur has continued to receive alarming information pointing to the continuation of grave human rights abuses linked to oil exploitation, aimed at depopulating oil-rich areas to ensure their control." Ibid.
[881] U.N. OLS (Southern Sector) press release, "UN and Aid Agencies welcome agreement between Sudan Government and Rebels," Nairobi, October 15, 2002; Memorandum signed by Dr Sulaf el Din Salih (for the government of Sudan), Elijah Malok (for the SPLM/A), and Ronald Sibanda (for the U.N.), "Meeting Held On The Implementation Of Clause 5 Of The Machakos Mou On Unimpeded Humanitarian Access," Nairobi, 25-26 October 2002. According to a top U.S. AID official, Roger Winter, the Sudanese government has substantially complied with the humanitarian access agreement, although it was responsible for major access problems for almost two decades. http://commdocs.house.gov/committees/intlrel/hfa87089.000/hfa87089_0f.htm (accessed August 13, 2003).
[882] U.N. Commission
on Human Rights draft resolution E/CN.4/2003/L.35 on human rights in the Sudan
was rejected 24-26 (with three abstentions) at the 59th session of
the Commission on April 16, 2003.XX press
release, "TITLE."U.N.
Commission on Human Rights, Geneva, dated,http://www.unhchr.ch/html/menu2/2/59chr/voting16pm.htm
(accessed August 14, 2003).
[883] "Sudan consortium to drill 17 exploration wells in 2001," Reuters, Khartoum, January 9, 2001.
[884] The 2000 production target was 165,000 barrels per day, which was exceeded by the actual production of 180,000 b/d. Ibid.
[885] Andrew England, "Sudan's oil production doing better than anticipated," AP, Khartoum, May 10, 2001.
[886] Ibid. Talisman budgeted U.S. $ 66 million and $ 133 million for exploration and development in 2000 and 2001, respectively. "Sudan consortium to drill 17 wells," January 9, 2001. This included "including pipeline and central processing facility upgrades . . . . " Talisman press release, "Talisman's 2001 Growth Supported by $ 1.7 Billion Exploration and Development Program," Business Wire (Vancouver), Calgary, January 23, 2001.
[887] Bamboo, because of its location north of Heglig, was considered a "low-risk" area and was protected by only fifty government army troops housed in canvas tents outside the main defensive earth wall. Nicholas Coughlan, quoted in "Report of an Investigation into Oil Development," p. 28. "Sudan opens oilfield producing 15,000 bpd – paper," Reuters, Khartoum, July 28, 2001, quoting the pro-government newspaper Akhbar al Youm.
[888] Ibid.
[889] Talisman press release, "Talisman Expects Strong Production Growth in 2002, $ 2 Billion in Spending," Calgary, January 14, 2002.
[890] PFC strategic studies report findings (August 2002), http://www.csis.org/africa/0208_SudanPFCSum.pdf (accessed August 21, 2003).
[891] Talisman, CSIS presentation, April 2002.
[892] Lundin Oil press release, "Lundin Oil Commences Testing on Thar Jath," Geneva, January 30, 2001.
[893] Lundin Oil press release, "Lundin Strikes Oil In Sudan," Business Wire (Vancouver), March 5, 2001.
[894] Ibid.
[895] Ibid.
[896] "Lundin Oil: Report for the Six Months ended 30 June 2001," Stockholm, August 9, 2001.
[897] "Malaysian oil firm given stake in Sudan project: report," AFP, Kuala Lumpur, July 13, 2000.
[898] On April 4, 2001, Deputy Defence Minister Col. Ibrahim Shams Ed-din and thirteen other senior army officers died when visiting the area. Their military Antonov went down in a sandstorm trying to land at the Adar Yel airstrip in Block 3, Eastern Upper Nile. Mohamed Ali Saeed, "Sandstorm blamed for Sudanese plane crash that left 15 dead," AFP, Khartoum, April 5, 2001. President El Bashir said at his memorial service that Shams Ed-din had never been absent for a full week from the front lines, and "has persistently sought martyrdom." The president then vowed, "We will continue on the path chosen by the martyrs and will remain faithful to that path. There is no peace without Islam and Islamic law." Ibid.
[899] "Sudan:
Four Oil Companies Announce Merger," SUNA, Khartoum, September 1, 2001;,Reuters Business Briefings (RBB), in BBCMIR, September 2, 2001; see "New
oil-producing consortium founded in Sudan," AFP, Khartoum, November 21,
2000.
[900] The CNPC announced in March 2001 that it was carrying out oil exploration in this area of 72,400 square kilometers. "New Oil Exploration Announced," IRIN, Nairobi, March 12, 2001. The CNPC said that the company's partners were Gulf Petroleum, 46 percent; CNPC and Thani, both 23 percent; and Sudapet, 8 percent.
[901] See "Japanese company seeking investment in oil, gas exploration," SUNA, Khartoum, May 24, 2001 (Mitsui Company).
[902]
"Russian Firm to Prospect for Oil Around Khartoum,"PANA, Khartoum, April
22, 2001; "Russian oil company in deal with Sudan," Kommersant (Moscow),
April 24, 2001, in Russian, as translated inBBC
Monitoring Service, U.K., April 30, 2001;
"Russian-Belarusian oil firm to develop Sudanese deposits," Interfax,
Moscow, July 20, 2001 (the government and Slavneft planned to sign a production
sharing agreement for Block 9 in 2001 and start work before the end of the year);
"Slavneft Eyes Sudan Oilfields," Reuters, Moscow, April 24, 2001.
[903]
"Russia: Tatarstan signs agreement on joint oil extraction in Sudan," ITAR-TASS
(in English), Kazan, Russia, June 21, 2001, from BBC
Monitoring Service, U.K., June 21, 2001.
[904] All statistics gathered in the south are approximations or educated guesses because of the chaos of war, continual civilian displacement, famine and scarcity, and the skeletal transportation and communications systems. The relief agencies produce, for their operations, estimates of those in need of food or non-food humanitarian assistance. These records, kept in the ordinary course of the relief business, are only reliable as estimates in the absence of better information on population.
[905] Email, Aya Shneerson, WFP press officer to Human Rights Watch, December 1, 1999.
[906] Of the
Nuer displaced from Mankien, an estimated 4,000 went to Maper, Twic countyCounty,
Bahr El Ghazal, and 13,500 fled to Thiekthou, also in Twic countyCounty.
Aya Shneerson, email to Human Rights Watch, December 1, 1999. Those who fled
Mankien (Bul and Leek Nuer) went to Twic countyCounty,
Bahr El Ghazal, for protection with Maj. Gen. Paulino Matiep's former
commander, Philip Bapiny,who had joined the SPLM/A in October 1998 with
his followers. After Cmdr. Philip Bapiny's defection to the SPLM/A, Maj.
Gen.Paulino Matiep became suspicious of Cmdr. Philip Bapiny's relatives and
civilian sympathizers, and reportedly began selective torture, confiscation of
property, and detention, leading to mass flight. Christopher M. Kiilu, WFP,
"Assessment of Displaced Nuer in Twic county," internal agency memo, June 30,
1999.
[907] These
23,000 were mainly displaced in four different directions: 7,000 to Nyal; 4,000
to Ganyliel, south of Nyal; 1,500 to Pabuong, northwest of Nyal, all in Western
Upper Nile/Unity State; and 10,500 to Makuac, Tonj countyCounty,
Bahr El Ghazal. Aya Shneerson, email to Human Rights Watch, December 1, 1999.
[908] The WFP put the number at 3,762 internally displaced in Nyal. WFP, Sudan Bulletin No. 89: May 30-June 5, 1999. There were much larger numbers estimated outside of Nyal. The WFP distributed food for 32,750 beneficiaries in and around Nyal, displaced and needy non-displaced. U.N. OLS (Southern Sector), "Weekly Report: May 31– June 6, 1999," Nairobi, June 6, 1999.
[909] U.N. OLS (Southern Sector), "Weekly Report: May 31– June 6, 1999."
[910] U.N. OLS (Northern and Southern Sectors), "Joint Weekly Report: October 13, 1999," Nairobi, October 13, 1999. The 30,000 escaped into the garrison towns of Bentiu (16,000), Rubkona (4,830), and Mayom (2,900). There were others in need in the government areas of Pariang (4,770), Tong and Gezira (900), and Dorkhan and Kuersilik (600). Those in Pariang included persons who fled from the government military operations outside of Pariang in May 1999.
[911] A breakdown as in 1999 was unavailable for subsequent years.
[912]U.N. OCHA, Consolidated
Inter-Agency Appeal for Sudan, 2001, United Nations, p. 11, see
http://www.reliefweb.int/.
[913] In the few days between July 28-31, 2000, "19,000 displaced people, mainly women and children arrived. After several days walking, with the majority having nothing to eat, they are in an alarming nutritional state." ACF, August 10, 2000, quoted in "Profile of Internal Displacement: Sudan," compilation of the information available in the Global IDP Database of the Norwegian Refugee Council, as of 13 November, 2000, p. 41; also available at http://www.idpproject.org, Geneva, Switzerland.
[914] Although figures for internally displaced in Bahr El Ghazal are available and include Nuer displaced, most have not been disaggregated, as far as we know, in a manner that would enable identification of the numbers of displaced Nuer or Dinka who arrived from Western Upper Nile/Unity State in 2000.
[915] Email, Judy Kimaru, World Food Program, to Diane DeGuzman, OLS, Lokichokkio, Kenya, February 22, 2001.
[916] Lindsey Davis, WFP, email to Human Rights Watch, July 19, 2001.
[917] WFP/OLS, "IDPs Southern Sudan Briefing," March 2002, p. 2. The number of 174,200 displaced individuals is calculated from 55,200 in the Lakes district plus 70 percent (119,000) of the 170,000 in Upper Nile. The report attributed 30 percent of the displaced individuals in Upper Nile to "inter-clan fighting" and 70 percent to "oil mining related fighting," although that is a distinction without a difference.
[918] Ibid., p. 2.
[919] Ibid.
[920] Ibid., p. 1.
[921] Ibid.
[922] The government of Sudan has not acceded to Protocol II, which applies to internal armed conflicts. We look to Protocol I, which as of April 2001 had been ratified or acceded to by 150 states, for authoritative guidance to customary international humanitarian law. The Sudanese government has ratified the four Geneva Conventions of 1949, whose common article 3 applies to internal armed conflicts.
[923] United Nations General Assembly Resolution 2444, adopted by unanimous vote on December 19, 1969, expressly recognized the customary law principle of civilian immunity and its complementary principle requiring the warring parties to distinguish civilians from combatants at all times. U.N. General Assembly, Respect for Human Rights in Armed Conflicts, United Nations Resolution 2444, G.A. Res. 2444, 23 U.N. GAOR Supp. (No. 18), p. 164, U.N. Doc. A/7433 (New York: U.N., 1968).
[924] Protocol additional to the Geneva Conventions of 12 August 1949, and relating to the Protection of Victims of International Armed Conflicts (Protocol I), art. 52 ((2); International Committee of the Red Cross (ICRC), Commentary on the Additional Protocols of 8 June 1977 to the Geneva Conventions of 12 August 1949 (Geneva: Martinus Nijhoff Publishers, 1987), p. 1472.
[925] Ibid.
[926] See, for example, J. Millard Burr and Robert O. Collins, Requiem for the Sudan: War, Drought, and Disaster Relief on the Nile (Boulder, Colorado: Westview Press, 1995); Keen, Benefits of Famine; Ataul Karim, Mark Duffield, et al., OLS, Operation Lifeline Sudan: A Review (Nairobi: OLS, July 1996); African Rights, Food and Power in Sudan: A Critique of Humanitariansm (London: African Rights, May 1997).
[927] Government of Sudan, Sudan Peoples' Liberation Movement, and U.N. OLS, "Agreement on the Implementation of Principles Governing the Protection and Provision of Humanitarian Assistance to War Affected Civilian Populations," Geneva, December 15, 1999. This forum for this agreement is the Technical Committee on Humanitarian Assistance (TCHA) in Rome.
[928] Protocol I, art. 52 (2).
[929] While capture of oilfields might be a legitimate military objective if the purpose is to deny fuel for military vehicles or revenue to the enemy, that rationale is scarcely applicable for attacks on these rebels. The SPLA is in no position to make use of any of the oil production in Upper Nile, lacking refinery and transport facilities; oil is a natural resource demanding a much larger investment to be of economic utility than diamonds, for instance. The SPLA itself remains a legitimate military target, of course, whether it occupies oil infrastructure or not.
[930] David Carnahan, Protecting Civilians under the Draft Geneva Protocol: A Preliminary Inquiry, 18 Air Force Law Review 1976, pp. 47-48, citing Report of the U.S. Agent, 6 Papers relating to the Treaty ofWashington, 1874, pp. 52-57; see Bothe, Michael, Karl Josef Partsch, and Waldemar A. Solf, New Rules for Victims of Armed Conflicts (Geneva: Martinus Nijhoff Publishers: 1982), p. 324, fn. 15.
[931] There are nongovernmental relief agencies operating outside the OLS umbrella. No agency, inside or outside of OLS, could play a consistent role in Western Upper Nile/Unity State from 1998 to date due to fighting.
[932] The southern sector of OLS initially served only areas controlled by rebels in southern Sudan. After Riek Machar signed the Political Charter with the government in 1996, relief to "his" areas in the south continued to be administered as before, through the southern sector of OLS.
Some relief personnel believed that, since Riek Machar had signed a peace agreement with the government of Sudan, he should look to the northern sector based in Khartoum rather than to the southern sector for the relief needs of his areas. Other relief officials argued that the OLS office in Khartoum would not provide even a fraction of the meager assistance these southerners were receiving through the southern sector because of well-known government interference, and therefore the communities concerned were better off with assistance via the southern sector. Their view was that their humanitarian obligations to the needy individuals overrode the political affiliation of whatever authority controlled an area, even if the authority was in alliance with the government.
The relief association created by Riek Machar in 1991, the Relief Association of South Sudan (RASS), kept its name, and the same persons continued as its administrators until the merger of Riek Machar's forces (by then the SPDF) with the SPLM/A in 2002, after which the two rebel-controlled relief organizations were merged and renamed.
[933] During
most of the period covered by this report, WFP was the only OLS agency
operating from Lokichokkio that had access to the rebel area north of Bentiu in
Ruweng countyCounty,
whose garrison towns (Pariang) were served by CARE from Khartoum and Bentiu
with WFP food.
[934] Some areas of Upper Nile that had been in the SPLA before the 1991 split, whose commanders did not follow Riek Machar back into the SPLA in 2002, received spotty service from the southern sector OLS because of the high rate of hostage-taking of relief workers by some commanders. OLS northern sector did not completely cover the neglected areas.
[935] OLS recognized another rebel relief arm covering the Shilluk area, the Fashoda Relief and Rehabilitation Organization (FRAA) of the Shilluk leader Lam Akol. Shortly thereafter, Akol signed the Khartoum Peace Agreement with the government. OLS has been reluctant to recognize any other rebel relief arm (called "local counterparts") since then.
[936]For this period, see UNICEF/OLS-Southern Sector, "Basic Cooperation Agreement between UNICEF/OLS and SPLA/SRRA," Nairobi, April 16, 1999; UNICEF/OLS-Southern Sector, "Basic Cooperation Agreement between UNICEF/OLS and SSIM/RASS," Nairobi, March 1999. Pursuant to these contracts, the SRRA received U.S. $ 1,783,494 and RASS received U.S. $ 949,754, each to be allocated by UNICEF and subject to the availability of donor funding. These funds were for offices and staff salaries.
[937] Former commanders and combatants made up most of the SRRA and RASS staff. In turn they suggested local hires, often demobilized rebels, to NGOs, for positions as drivers and other local employees needed to carry out relief work.
[938] As of the writing of this report, it is too early to say whether the agreement is being honored.
[939] Human Rights Watch, Famine in Sudan, p. 89.
[940] U.N. OLS (Northern Sector), "Weekly Report: June 30, 1999," Khartoum, June 30, 1999.
[941] WFP press release, "Government Ban Threatens Food-Deprived Area," July 14, 1999.
[942] U.N. OLS (Southern Sector), "Weekly Report: 5 July-11 July, 1999," Nairobi, July 11, 1999. The tactic of attacking relief airstrips immediately after supplies had been delivered was used by both Riek Machar's forces in the Hunger Triangle in 1993 and by Kerubino's forces near Gogrial in the late 1990s. Both had U.N. radios with which to monitor deliveries and time attacks. D.H. Johnson, email, April 30, 2001.
[943] WFP, "Sudan Bulletin No. 94: July 4-10, 1999," Rome, July 26, 1999.
[944] See WFP press release, "WFP fears worsening humanitarian crisis for thousands of Sudanese as flight ban compounds access problems," Nairobi, July 27, 1999.
[945] U.N. OLS (Southern Sector), "Weekly Report: July 12-18, 1999," Nairobi, July 22, 1999.
[946] The sudd, the Nile, rains, and seasonal flooding were considered to impose natural barriers to any land invasion of those two areas. They were also far from any Sudanese government or militia ally location and therefore safe from their land attack. Those were among the reasons that the displaced sought refuge there.
[947] U.N. OLS (Southern Sector), "Weekly Report: July 12-18, 1999."
[948] "Conflict Prevents Vaccination of 50,000 Sudanese Children," AFP, Nairobi, July 20, 1999; U.N. OLS (Southern Sector), "Weekly Report: July 5-11, 1999."
[949] WFP, "Sudan Bulletin No. 96: July 18-24, 1999," Nairobi, July 29, 1999. Because it did not control territory in Western Upper Nile/Unity State until mid-2000, the SPLM/A was not in a position to grant or deny access to this area. Nor did RASS, the Riek Machar relief wing, exercise its right to ban access to this area of Western Upper Nile/Unity State.
[950] U.N. OLS (Northern Sector), "Weekly Report: July 14, 1999."
[951] "Flight ban," AFP, Nairobi, July 27, 1999; WFP press release, "WFP fears worsening humanitarian crisis . . . ," July 27, 1999.
[952] U.N. OLS (Southern Sector), "Weekly Report: July 12-18, 1999."
[953] WFP, "Sudan Bulletin No. 99: August 8-14, 1999," Nairobi, September 14, 1999. Nyal became the only location in rebel-held Western Upper Nile/Unity State to which WFP was able to deliver food in August 1999: it distributed 205 metric tons of food for 21,750 people. WFP Sudan Bulletin No. 101: August 22-28, 1999, Nairobi, September 14, 1999.
[954] U.N. OLS (Northern and Southern Sectors), "Joint Weekly Report: August 18, 1999," Nairobi, August 18, 1999.
[955] U.N. OLS (Northern and Southern Sectors), "Joint Weekly Report: August 25, 1999," Nairobi, August 25, 1999. During the next week of August, WFP provided food to 3,938 beneficiaries in Rubkona, the first food since June. U.N. OLS (Northern and Southern Sectors), "Joint Weekly Report: September 1, 1999," Nairobi, September 1, 1999.
[956] U.N. OLS (Northern and Southern Sectors), "Joint Weekly Report: September 8, 1999," Nairobi, September 8, 1999.
[957] U.N. OLS, "Operation Lifeline Sudan Weekly Report: November 10, 1999," Nairobi, November 10, 1999.
[958] Alfred Taban, "WFP Warns of Humanitarian Crisis in South Sudan," Reuters, Khartoum, November 24, 1999. The flight locations in Western Upper Nile/Unity State denied by the government for December 1999 were Nhialdiu, Duar, Toy, Ganyliel, Gumriak, Mankien, Ler, and Wicok. Aya Shneerson, email, December 1, 1999.
[959] "WFP Warns of Humanitarian Crisis," November 24, 1999.
[960] WFP, "Sudan Bulletin No. 120: 1-15 February 2000," Rome, February 15, 2000
[961] WFP, "Sudan Monthly Overview-February 2000," Rome, February 29, 2000.
[962] Owner of aircraft company serving southern Sudan relief operations, Human Rights Watch interview, Lokichokkio, Kenya, August 3, 2000. This included all types of relief planes in various parts of the south: OLS, non-OLS, and ICRC, which has its own separate agreement and ground rules with the government. In most of the locations, there was no SPLA presence. Anonymous relief worker witness to a bombing, Human Rights Watch interview, Lokichokkio, Kenya, July 28, 2000.
[963] Owner of aircraft company serving southern Sudan relief operations, interview, August 3, 2000.
[964] Sikander Khan, deputy to Sarhad Sapra, Deputy Humanitarian Coordinator for Southern Sudan, OCHA, Human Rights Watch interview, Nairobi, August 11, 2000.
[965] These requirements are unrealistic in the context of a complex emergency operation in a large war zone. They give no leeway for the need to replace planes because of broken parts, planes stuck in the mud or diverted on an emergency basis elsewhere, and other practicalities. The requirements resulted in a diminution in access. Diane deGuzman, briefing, May 8, 2001.
[966] Sikander Khan, interview, August 11, 2000.
[967] Ibid.
[968] Makur Kot Dhuor, "Mankien Faces Serious Starvation," South Sudan Post (Nairobi), March 2000, pp. 2-4. Christian Aid did not operate under the OLS umbrella so could choose to ignore the ban and assume the risk of flying into a forbidden location.
[969] See Kenny, "Report of an Investigation in the Town of Mankien."
[970] Human Rights Watch press release, "Sudan Bans All Relief to the South," New York, September 28, 2002, http://hrw.org/press/2002/09/sudan0928.htm, (accessed August 18, 2003).
[971] Human Rights Watch, "LRA Conflict in Northern Uganda and Southern Sudan, 2002," Background Briefing, October 2002, http://hrw.org/press/2002/10/uganda1029-bck.htm (accessed October 31, 2002).
[972] There were military and political barriers even where natural barriers were lacking. An enterprising trucker drove from Rumbek, Bahr El Ghazal (SPLA area) to Nyal, Western Upper Nile (Riek Machar SPDF area) during the dry season in early 2001, over the flat terrain where a road used to be, and the SPLA strongly objected. The February 2001 SPLA/Gatdet attack on Nyal came on foot from the direction of Rumbek. The SPLA did not want a road to be developed/used there because it might be used militarily-for instance to facilitate a reverse strike. Relief official, Human Rights Watch interview, Ganyliel, Western Upper Nile, April 5, 2001.
[973] Airboat delivery was talked about for years, but never became a mode of transport used for relief deliveries in Western Upper Nile. Rumors abounded about possible oil company use of airboats in Block 5A even after the suspension of oil activities there in January 2002.
[974] WFP, "WFP Sudan Monthly Overview-January 2000," Rome, January 31, 2000. WFP did not state why the trucks were held.
[975] WFP, "Sudan Monthly Overview-March 2000," Rome, March 31, 2000.
[976] Sikander Khan, interview, August 11, 2000.
[977] Roger Winter had been executive director of the nongovernmental organization U.S. Committee for Refugees for many years before accepting this position in government. In his NGO capacity, he had visited southern Sudan and other African countries many times, and was known to be an advocate for the Sudanese, particularly those most affected by the war, the southerners. He had considerable credibility with key Congressmen. He brought high-level focus on Sudan to U.S. AID, but he was not the only AID executive concerned about Sudan.
[978] OLS Emergency Preparedness and Response (EP&R) Humanitarian Services Co-ordination Unit, "Report on the findings of the assessment missions to WUN [Western Upper Nile] during five day window 21st-26th June 2002," Lokichokkio, Kenya, July 2002.
[979] Ibid.
[980] Ibid. The report concluded that "lack of access to drinking water is acute in most locations. Coupled with poor hygiene, loss of assets (animals, shelter and other household items) and limited health facilities, this constitutes ideal conditions for a rapid increase in communicable diseases."
[981] Their requests to OLS (Southern Sector), in addition, met with reluctance because of the long history of these militias taking relief workers hostage. The northern sector was not as experienced at relief delivery in the south as was the southern sector and, in addition, local commanders complained that the northern sector OLS relief was delivered by Muslim proselytizing nongovernmental organizations. As a result the affected populations fell into a relief "black hole." SSDF commander/relief liaison and OLS officials, Human Rights Watch interviews, Nairobi, May and June 2003.
[982] Local commanders frequently arrested Sudanese (even those with or employed by NGOs or the U.N.) traveling to territory that was not "theirs." This produced many disputes between those commanders and expatriate staff who often refused to leave the location unless the Sudanese traveling with them were released and could leave with them. The expatriates reasonably feared that the local commander might kill or torture their Sudanese "counterpart." This had a tendency to create and string out a number of hostage situations.
[983] This was also an attempt to assert more rebel "governmental" powers vis-a-vis international NGOs (INGOs). The INGOs were in the position in 1999 of being the only foreign presence in the war-torn region and possessing the only visible assets--vehicles, communications equipment, etc., often better equipment than the rebels. The SRRA designed a Memorandum of Understanding (MOU) for these agencies to sign, among other things to tax and permit more SRRA control over INGO assets and operations. One conclusion that can be drawn from reading the MOU is that the relief "industry" is the biggest and only going economic concern in the south. See Volker Riehl, "Who is ruling in South Sudan? The role of NGOs in rebuilding socio-political order," in Studies on Emergencies and Disaster Relief, Nordiska Afrikainstitutet, Uppsala, Sweden, no. 9, 2001.
[984] "Ultimatum for Aid Agencies Working in Southern Sudan," AFP, Nairobi, January 20, 2000; Anthony Morland, "CARE, Other NGOs, Withdraw from South Sudan," AFP, Nairobi, February 24, 2000; "Sudan Rebels Reject Talks with Expelled NGOs," Reuters, Nairobi, February 29, 2000; Oxfam press release, "Humanitarian Agencies Call on SRRA to Reopen Negotiations," Nairobi, March 1, 2000; see Human Rights Watch press release, "Sudan Rebels Leaving Civilians in the Lurch," New York, March 7, 2000.
[985] U.S.
officials up to and including Secretary of State Dr. Madeleine Albright called
Colonel Garang to ask him to extend the deadline, as did President Moi of
Kenya. Colonel Garang refused them all. Meeting between U.S. officials and
NGOs, Washington
DCWashington, D.C., March 2000.
[986] The SPLM/A did not control the whole south or even the whole rural south. The Riek Machar SPDF controlled some parts of Upper Nile and government militias existed in enclaves around many garrison towns and among ethnic groups alienated from the SPLM/A by its abuses.
[987] One INGO resigned from OLS in protest of the fact that OLS should have coordinated and negotiated access across the board for the NGOs with the SPLM/A. Anonymous agency document, August 2000.
[988] The fact-finding mission included U.N., NGO, and SRRA officials.
[989] Mindy Belz, "Understanding MOUs," World, vol. 15, no. 49, December 16, 2000.
[990] They received no distribution for the months February through May 2000. WFP, "Sudan Monthly Overview-May 2000," Rome, May 31, 2000, says: "these populations [referring to an estimated 20,000 internally displaced persons in Tonj county fleeing insecurity in Ler] have received no humanitarian assistance since [the NGO] terminated their activities in the county in February."
[991] In 2001 the SPLM/A came to an agreement to deliver more than 300 metric tons of sorghum and maize to the relief authorities as compensation. Relief official, email to Human Rights Watch, February 26, 2001 (anonymity requested).
[992] On January 2, 2000, unknown forces intercepted a CARE relief team in a CARE vehicle going from Bentiu to open a health clinic inMayom. A U.N. security team considered Mayom unsafe in November 1999, but health conditions in Mayom were of concern because it had been cut off for months. Ibrahim Ishag Abaker and Mekki El Ekheir Mekki (whose names suggest Arab origin) were killed. Kwaq Makwaq and Santino Deng, a consultant (names southern), were captured. The group reportedly was last seen alive thirty miles from Bentiu. A search and rescue team located the truck and the body of Mekki on January 5, 2000, along the road to Mayom, and the body of Ibrahim a few miles away. After negotiations, Cmdr. Peter Gatdet released the two surviving CARE workers on March 9. In exchange negotiators promised Cmdr. Peter Gatdet educational material (reportedly not supplied in the quantities requested). Cmdr. Peter Gatdet denied that his troops were responsible for the killing or capture of the CARE team. He said in January 2000 that other SPLA forces moving south from the Nuba mountains through Toy (Bul Nuer) in Western Upper Nile had encountered the CARE truck and turned the two captives over to him. WFP, "Sudan Bulletin No. 112: 7-13 November 1999," Rome, November 13, 1999; WFP, "WFP Sudan Monthly Overview-January 2000," Rome, January 31, 2000; CARE press release, "CARE Reports Release of Two Staff Abducted in Sudan," Atlanta, March 9, 2000; anonymous relief source, Human Rights Watch telephone interview, East Africa, April 12, 2000; "Sudanese Rebels Secure Release of Two Detained CARE Workers," AFP, Nairobi, March 9, 2000; U.N. security official, Human Rights Watch interviews, July 27 and August 5, 2000.
[993] WFP, "Sudan Monthly Overview-March 2000," Rome, March 31, 2000.
[994] This "taxation" occurred despite the rebel's agreement after the 1998 famine that the SRRA or SPLM/A would not tax relief food.
[995] Diane deGuzman, briefing, May 8, 2001.
[996] "Ethiopia to import Sudanese oil from 15 January 2003 – Ethiopian envoy," SUNA, Khartoum, in English, January 13, 2003, from BBC Monitoring Middle East, January 13, 2002.
[997] Table
1, below. The official exchange rates of Sudanese dinars to U.S. dollars were
as follows: 1999, 256.9; 2000, 257.4; 2001, 261.4; 2002, 261.7. IMF, "Sudan:
Final Review Under the 2002 Staff-Monitored Program and the 2003 Program," IMF
Staff Country Report No. 03/273, Washington, DCWashington, D.C.,
September 2003, Table 3, p. 24.
[998] "U.N. Register of Conventional Arms, 2001, Addendum 1," (New York: U.N., September 24, 2002), UN document number A/57/221/Add1.
[999] "U. N. Register of Conventional Arms, 2002," Russia submission, June 23, 2003, http://disarmament.un.org/un_register.nsf.; Belarus submission, June 3, 2003, http://disarmament.un.org/un_register.nsf (accessed August 6, 2003).
[1000] According to Military Balance 1999-2000 (Oxford, U.K.: International Institute for Strategic Studies, 1999), p. 276, Sudan then had four Mi-24Bs and five Mi-35s (export version).
[1001]
Sources: IMF Staff Country Report No. 03/273, September 2003; IMF, "Sudan:
Final Review Under the Medium-Term Staff-Monitored Program and the 2002
Progarm-Staff Report," IMF Staff Country Report No. 02/245,
November 5, 2002. Military expenditures for 2001 were calculated based on
ibid., p. 30; Middle Eastern and Policy Development and Review
Departments, IMF, Middle Eastern and Policy Development and Review
Departments, "Subject: '"Sudan-Third
Review of the Second Annual Program Under the Medium-Term Staff-Monitored
Program and Annual Program for 2001,'" Washington,
DCWashington, D.C., January 26, 2001
(confidential); IMF, "Sudan: Staff Report for the 2000 Article IV Consultation
and Fourth Review of the First annual Program Under the Medium-Term
Staff-Monitored Program," IMF Staff Country Report No. 00/70, Washington,
DCWashington, D.C., June 2000; Talisman
Energy, Corporate Social Responsibility Report 2001, p. 26.
No numbers were presented for actual or projected Sudanese military expenditures in 2002 or 2003 from the IMF. This lack of Sudanese government transparency is lamentable. The calculated military expenditures for 2002 are based on the IMF statement that "military spending reached 2.3 percent of GDP [gross domestic product], below the program projection of 2.5 percent." IMF Staff Country Report No. 03/273, September 2003, p. 6.
The GDP for 2002 was 3,559 b Sudanese dinars. Ibid., Table 3, p. 24. At 2.3 percent of GDP, the military spending for 2002 was 81.85 b Sudanese dinars (U.S. $ 31.27 m).
[1002] IMF Staff
? Country
Report No. 00/70, staff memorandum, January 2001, p. 5;
IMF Staff
Country Report No. 02/245, November 2002.
[1003]Oil prices
per barrel for the years 1999-2003 according to the IMF were: 1999, U.S. $
19.80; 2000, U.S. $ 27.80; 2001, U.S. $21.50; 2002, U.S.
$23.20; 2003 (projected), $ 24.50. FILL IN ANNUAL oil prices per
barrel, found at bottom of Table 3, p. 24: Oil prices per barrel: 1999, XX;
2000, 27.3, etc. …….IMF Staff Country Report No.
03/273, September 2003, Table 3, p. 24.
[1004] "Sudan
Stops Petroleum Imports," (???),Khartoum, May 10,
2000, http://www.sudanshop.co.uk (accessed May 10, 2000).
[1005] Ibid.
[1006] "Interview-Sudan Sees Fruits of Painful Economic Reform," Reuters, Khartoum, May 12, 2000.
[1007] IMF Staff
?Country Report, No. 00/70, staff memorandum, January
2001, p. 15.
[1008] "Country Outlook: Sudan," Economist Intelligence Unit, London, April 2001.
[1009] Ibid.
[1010] IMF Staff Country Report No. 02/245, November 2002.
[1011] Ibid.; IMF Staff Country Report No. 03/273, September 2003, Table 3, p. 24.
[1012] IMF Staff Country Report No. 02/245, November 2002, p. 16.
[1013] "Sudan: Memorandum of Economic and Financial Policies," Attachment 1 to letter from the Sudanese Minister of Finance and National Economy and the Governor of the Bank of Sudan, which is an attachment to IMF Staff Country Report No. 02/245, p. 63.
[1014] IMF Staff Country Report No. 02/245, November 2002, p. 32, n. 15, and box 4, p. 34.
[1015] Ibid.
[1016] IMF Staff Country Report, No. 03/273, September 2003, p. 6 and Table 3, p. 24.
[1017] IMF Staff Country
Report, No. 00/700, staff memorandum,
January 2001, p. 15.
[1018] Talisman Energy, 2002 Annual Report, p. 5.
[1019] "Sudan to double oil production by 2005, says official," SUNA, Khartoum, January 25, 2001, in English, from BBC Monitoring Service, January 26, 2001.
[1020] PFC Strategic Studies report findings, PowerPoint presentation, August 2002, http://www.csis.org/africa/0208_SudanPFCSum.pdf (accessed August 21, 2003).
[1021] Table 1; IMF, January 2001 staff memo, p. 9.
[1022] In
1998, military expenditures were 42.8 billion dinars (U.S. $ 166.5 million). "Sudan:
Staff Report for the 2000 Article IV Consultation and Fourth Review of the
First annual Program Under the Medium-Term Staff-Monitored Program," IMF Staff
Country Report No. 00/70, Washington, D.C., June 2000, IMF Staff
Country Report, Sudan, p. 11. For 1999-2001, see
January 2001staff memo, p. 9 Table 1. In 2001, the military expenditure was
planned to be 93.2 billion dinars, which includes the 31.3 billion dinars
planned but not expended in 2000, plus 8.1 b dinars (U.S. $ 31.9 million). This
might indicate that delivery of or payment for expensive military hardware was
not made in 2000 but in 2001. As Russian arms sales disclosures later revealed,
in 2001 Russia sold twelve attack helicopters and twenty-two armored vehicles
to Sudan. See below.
[1023] See Table 1.
[1024] See Table 1.
[1025] Abdel Rahim Hamdi, a former finance minister of Sudan (1990-93), has been the chairman of the Khartoum Stock Exchange since 1994, and describes himself as a "leading Islamic Economist." He was reappointed minister of finance in March 2001, http://www.hamdi.com (accessed June 21, 2001).
[1026] Claudia Cattaneo, "Oil and Politics Don't Mix: Canada's Talisman Feeling the Heat in Sudan," National Post (Toronto), Khartoum, November 20, 1999.
[1027] Claudia Cattaneo, with Carol Howes, "Analysts upbeat about Talisman's Sudan role," Financial Post (Toronto), Heglig, Sudan, November 17, 1999.
[1028] See Table 1, military expenditures of 62.2 billion Sudanese dinars and total government expenditures of 205.5 billion Sudanese dinars, or 27.37 percent. See IMF Staff Country Report No. 00.70, June 2000, p. 11.
[1029] IMF, January 2001 staff memo, p. 9.
[1030]Although military expenditures dropped from 27.37 percent of the budget in 1999 to 22.3 percent of the budget in 2001, military expenditures were up 45 percent in cash terms in these years. There is another expenditure for "domestic security expenditure"-related to but not included in military expenses-which was 4.267 billion dinars or U.S. $ 16.6 million in 2000 (3.2 billion dinars--U.S. $ 12.4 million-for the first three quarters, prorated annually). This amount was under the general reserve spending account. See IMF, January 2001 staff memo, p. 9, fn. 6.
[1031] Hailes Janney, "Oil reserves transform the Sudanese civil war," Jane's Intelligence Review, June 1, 2001, in FOCUS: Vol. 13, no. 6 (Surrey, U.K.).
[1032]If oil
revenues had been as predicted, roughly 158.5 billion Sudanese dinars (U.S. $
604 million), the defense expenditures of 81.85 billion Sudanese dinars (U.S. $312 million) would have been 51.6 percent of oil revenues for 2002, almost
as much a percentage as in 2001. IMF Staff Country Report 02/245, November
2002, p.13, table 3.If oil revenues had been as predicted, roughly U.S.
$ 512 billion, the defense expenditures of U.S. $312 billion would have
been 60 percent of oil revenues again for 2002, as in 2001.
[1033] "U.N. Register of Conventional Arms, 2001, Addendum 1," (New York: U.N., September 24, 2002), UN document number A/57/221/Add1.
[1034] "U. N. Register of Conventional Arms, 2002," Russia submission, June 23, 2003, http://disarmament.un.org/un_register.nsf.; Belarus submission, June 3, 2003, http://disarmament.un.org/un_register.nsf (accessed August 6, 2003).
[1035] "Sudan to Manufacture Tanks, Missiles: Assembly Speaker," AFP, Khartoum, April 30, 1999. Also quoted in Linda Slobodian, "Little Stock in Sudan Deal," Calgary Sun, May 5, 1999.
[1036] "Dr. El-Turabi: Oil for War Is a Ridiculous Disinformation," Al Ra'iAl-a'am, Khartoum, May 6, 1999.
[1037] "Sudan to achieve self-sufficiency in weapons: spokesman," AFP, Khartoum, July 1, 2000.
[1038] "El-Bashir: Sudan on Way to Producing Own Tanks," AP, Khartoum, October 27, 2000.
[1039]"Polish Premier, Nowak-Jezioranski on Tank Deal," containing the text of a statement on the matter by the Polish prime minister, Gazeta Wyborcza (Warsaw), as translated in FBIS, Washington, D.C., August 31, 1999; "Poland halts tank sale to Yemen," AP, August 31, 1999; "Poland admits 20 tanks sold to Yemen were illegally diverted," Reuters, September 1, 1999.
[1040] Ibid.
[1041] "Polish premier confirms arms trade control after failed tank sale to Sudan," PAP news agency (Warsaw), BBC Worldwide Monitoring, January 16, 1998.
[1042] Ibid.;
"US would consider sanctions on Poland for tank sales," AFP, Washington
DCWashington, D.C., August 31, 1999; "US
May Apply Sanctions Over Tanks," UPI,Washington DCWashington,
D.C., August 31, 1999; "US Said Angered That Polish Tanks Went To
Sudan," Reuters, Warsaw, August 31, 1999.
[1043] Ibid.
[1044]"Polish Premier . . . on Tank Deal," Gazeta Wyborcza, FBIS,August 31, 1999.
[1045] Ibid.
[1046] International Institute for Strategic Studies, The Military Balance 1999-2000 (London: Oxford University Press, 1999), pp. 275-276.
[1047] "Foreign Ministry official reacts to press report on arms from Bulgaria," SUNA, Khartoum, January 31, 2000. Undersecretary of the Ministry of External Relations Dr. Hasan Abdin categorically denied a report published by al-Sharq al-Awsat newspaper on January 28, 2000 that Sudan had concluded a secret arms deal with Bulgaria. He called the report "totally untrue and baseless."
[1048] "Bulgaria Has Issued No Export Permits for Embargoed Countries," Capital Weekly (Sofia), May 29, 2002; "Beta Claiming Millions in Debt from Sudan," PARI Daily (Sofia), May 22, 2002.
[1049]"Bulgaria Has Issued No Export Permits…," Capital Weekly.
[1050] Ibid.; "Beta Claiming Millions…," PARI Daily.
[1051] "Bulgaria Stops Arms Sales for 20 Countries," Bulgarian Press Digest, April 6, 2001.
[1052] Ibid.
[1053]Ibid. Email, Human
Rights Watch Arms Division to Africa Division, June 3, 2001.
[1054] "Canada's Talisman vows to continue oil operations in Sudan," AFP, Khartoum, June 4, 2001.
[1055] "Sudan says foreign oil revenues do not finance war," Reuters, Cairo, June 10, 2001.
[1056] Phillip Smucker, "From Khartoum," U.K. Electronic Telegraph (London), Khartoum, March 7, 2001.
[1057] IMF Staff Country Report No. 02/245, November 2002.
[1058] Ibid.
[1059] "Ethiopia To Import 85 % Of Its Fuel Needs From Sudan," AP, Addis Ababa, June 22, 2001.
[1060] "Trade Link Established Through Port Sudan," IRIN, Nairobi, August 2, 2001.
[1061]
"Ethiopia to import oil from Sudan," IRIN, Addis Ababa, January 7, 2003;
"Sudan starts exporting oil to Ethiopia," SUNA, Khartoum, February 1,
2003, in English, from BBC Monitoring Middle East,
February 1, 2003; "Oil Imports From Sudan At a Standstill," IRIN (Addis
Ababa), Addis Ababa, March 27, 2003;
"Ethiopia industry: Oil imports switched from Sudan to Kuwait," Economist
Intelligence Unit, EIU ViewsWire no. 301, July 15, 2003,
http:global.factiva.com/en/arch/display.asp (accessed September 10, 2003));
"Ethiopia to import oil from Sudan," IRIN, Addis Ababa, January 7, 2003.
[1062] "Oil
Imports From Sudan At a Standstill," IRIN, March
27, 2003.
[1063] "Major Oil Exploration Deal," IRIN, Addis Ababa, June 16, 2003.
[1064]
"Kenya: Agreement on importation of duty free oil from Sudan not yet
concluded," London, BBC, London, July 12,
2001; "Kenya: Catholic church opposes Sudan oil deal," London, BBC, London, July
10, 2001. In addition to moral reasons, oil import duties were an important
source of income for the Kenyan government. Ibid.
[1065] "Sudan warns Kenya against ban on Sudanese oil imports," AFP, Khartoum, July 22, 2001.
[1066] Jaindi
Kisero, "Kenya opens door to Sudan oil imports," The Nation (Nairobi),
August 14, 2001.
[1067] Ochieng Sino, "Kenya to Import Sudan Oil," East African Standard, Nairobi, March 20, 3002.
[1068] See below, "Increased Government Bombing of the South."
[1069] Thuli Nhlapo, "South African Company Embroiled in Sudan Oil Row," Mail & Guardian (Johannesburg), July 20, 2001; "South Africa becomes involved in oil protest," IRIN, Nairobi, July 23, 2001.
[1070] "South African Oil Firm Says 'No Plans for Sudan,'" IRIN, Nairobi, July 25, 2001.
[1071] "Energy minister in talks with South African delegation on oil projects," SUNA, Khartoum, April 8, 2003, in English, from BBC Monitoring Middle East, April 8, 2003.
[1072] See Protocol II of 1977 to the Four Geneva Conventions of 1949, art. 11:
Medical units and transports shall be respected and protected at all times and shall not be the object of attack.
The protection to which medical units and transports are entitled shall not cease unless they are used to commit hostile acts, outside their humanitarian function. Protection may, however, cease only after a warning has been given setting, whenever appropriate, a reasonable time-limit, and after such warning has remained unheeded.
[1073] See Human Rights Watch, Civilian Devastation,
p. 350TO COME.
[1074] Foreign Minister Mustafa Osman Ismail, Human Rights Watch interview, New York, September 1998.
[1075] MSF, "'Living under aerial bombardments,' Report of an investigation in the Province of Equatoria, Southern Soudan," Geneva, February 2000, p. 3, appendix.
[1076] Andrew Mayfuth, "Oil money may be funding attacks on Sudanese rebels," Philadelphia Inquirer, Lui, Sudan, May 7, 2000.
[1077] U.S.
Committee for Refugees press release, "Bombings of Civilian Targets in Sudan
Have Doubled; 132 Confirmed Aerial Attacks This Year," Washington DCWashington,
D.C., December 12, 2000.
[1078] GNPOC
delivered oil for export at the new port starting in August 1999 and
continuing steadily thereafter. for the last four months of
1999 and for all twelve months of 2000.
[1079] Starting in June 2000, numbers of bombing incidents were charted monthly by an independent NGO, the Sudan Peace Forum-Africa, in Nairobi. A condensation of its numbers is an appendix to this report.
[1080]U.N. OCHA,
Consolidated Inter-Agency Appeal 2001, pp. 11, 142.
[1081] Stephen Amin, "Sudan: A civil war turned against school children," Africanews, Nairobi, issue 47, February 2000; "Sudan school still in shock after fatal air strike," Reuters, Kaouda, Sudan, February 11, 2000. Stephen Amin took the amateur video.
[1082] See,
e.g., White House Press Office, "Statement by President Clinton on School
Bombings in Sudan," US Newswire, Washington DCWashington,
D.C., February 14, 2000; "Canadian minister condemns Sudan for
'intentional' bombing of targets," Radio Canada
International, Montreal, March 8, 2000.
[1083]Stephen
Amin, "Sudan School Still in Shock . . . ," after Fatal
Air Strike," Reuters, February 11. 2000.
[1084] Andrew England, "Witness to Sudan School Bombing Describes Attack," AP, February 11, 2000.
[1085] "Sudan says it may have hit civilians inadvertently," AFP, Khartoum, February 14, 2000.
[1086] U.S.
Senator William Frist (R-TN), Congressional Record (Senate), March 2, 2000;
Samaritan's Purse press release, "American Charity Hospital, Run by Franklin
Graham's Samaritan's Purse, Bombed by Sudan Government," Lui, Sudan, March 2,
2000,
www.samaritanspurse.org/index.asp?section=news+room&page=2000/mar/030200.txt
(accessed August 18, 2002); "Relief agency: Sudan bombs compound in southern
Sudan," AP, Nairobi, March 6, 2000. Samaritan's Purse iswas
run by Franklin Graham, brother of the Rev. Billy Graham.
[1087] "Samaritan's Purse hospital bombed," Calgary Herald, March 18, 2000.
[1088] "More than 25 bombs dropped on southern Sudan during the last week," AP, Nairobi, March 27, 2000.
[1089] Letter, Rev. Eberhard Hitzler, Dr. Wolfgang Heinrich, et al., to Embassy of the Federal Republic of Germany, Nairobi, March 16, 2000.
[1090] SPLM/A Press Release, "Tali Comes Under Another Air Raid as GOS Targets Relief Centers," Nairobi, April 20, 2000; see Ken Isaacs, spokesman, "Urgent Communication from Samaritan's Purse Hospital," Samaritan's Purse, Boone, North Carolina, April 19, 2000.
[1091]Military Balance 1999-2000, p. 276.
[1092] Ted
Dagne, researcher, Congressional Research Service, Human Rights Watch telephone
interview, Washington DCWashington, D.C.,
May 4, 2000.
[1093] The MIG-23 is known more as an air defense aircraft, but Jane's showed that it could carry conventional bombs, a variety of rockets, and air-to-surface missiles. Jane's All the World's Aircraft, 1993-94 (London: Jane's Information Group), p. 280.
[1094] Statement of the Sudanese Churches on the Oil Factor in the Sudan Conflict, prepared April 12, 2000 (by New Sudan Council of Churches and Sudan Council of Churches), http://www.pcusa.org/pda/sudanoil.htm (accessed June 25, 2001). A no-fly zone is one which military aircraft cannot overfly for any reason without permission of the authority maintaining the zone.
[1095] Southern African Catholic Bishops' conference press statement, "Visit to Sudan by the Southern African Catholic Bishops' Conference," Pretoria, South Africa, April 10, 2000.
[1096] Ibid.
[1097]The
Canadian government on March 8, 2000, through its foreign minister Lloyd
Axworthy, condemned the bombing; according to Radio Canada International,
Axworthy said the "sustained and intentional bombing of civilian targets" was
"reprehensible and shows that Khartoum is not concerned with the security of
its population." "Canadian minister condemns Sudan . . . ," March 8, 2000;
James Rubin, State Department briefing, "US Condemns Civilian Bombings in
Sudan,"
Washington, D.C., March 8, 2000. U.S. Secretary of State
Madeleine Albright condemned the bombing and urged the Sudanese government to
refrain from all aerial bombardment of civilian targets. "U.S. says Sudan
bombed civilians, two dead," Reuters, Washington DCWashington,
D.C., March 3, 2000.
[1098] U.N. Commission on Human Rights, Resolution on the Situation of Human Rights in the Sudan, 56th session, E/CN.4/RES/2000/27, April 18, 2000, http://www.unhchr.ch/Huridocda/Huridoca.nsf/(Symbol)/E.CN.4.RES.2000.27.En?Opendocument (accessed July 18, 2002). This resolution was adopted by twenty-eight votes to none, with twenty-four abstentions.
[1099] "Rebels 'Sceptical' Over Bashir Order To Stop Air Strikes," IRIN, Nairobi, April 21, 2000; "Sudanese president stops air raids in southern Sudan," DPA, Khartoum, April 19, 2000.
[1100]See Appendix A: Chart Of Bombing Conducted By The Government Of Sudan, 2000-2001; see also SPLM/A Press Release, "Tali Comes Under Another Air Raid . . . ," April 20, 2000.
[1101] "Sudanese president stops air . . . ,"April 19, 2000.
[1102] E.U. press release, "Declaration by the Presidency on behalf of the European Union on the bombings of civilian targets by the Sudanese air force," Brussels, May 5, 2000.
[1103] Eli J. Lake, "Sudan offers bombing halt, U.S. skeptical," UPI, Khartoum, January 14, 2002.
[1104] "Danforth Leaves Without Deal On Government Bombings," IRIN, January 17, 2002; Eli J. Lake, "US Envoy Leaves Sudan Without Deal," UPI, Khartoum, January 16, 2002.
[1105] Ibid.
[1106] "U.S. presses Sudan on monitors," UPI, Washington, February 5, 2002.
[1107] MSF press release, "Medical supplies and village deliberately looted in Nimne, Western Upper Nile," Nairobi, February 11, 2002; MSF press release, "MSF Denounces Killing of Aid Worker and Civilians in Southern Sudan," Nairobi/New York, February 15, 2002; MSF-Holland, "Summary of Events: Nimne, Western Upper Nile," Nairobi, February 2002. The MSF press releases were only picked up by the U.N. Integrated Regional Information Network in Nairobi: "Sudan: Medical team flee troop movements in Bentiu area," IRIN, Nairobi, February 7, 2002; "Sudan: Medical center in Bentiu area 'systematically looted,'" IRIN, Nairobi, February 12, 2002; "Sudan: MSF worker and four civilians killed in Bentiu area," IRIN, Nairobi, February 18, 2002.
[1108] WFP press release, "WFP Condemns Air Attack At Food Distribution Site In Southern Sudan," Nairobi, February 13, 2002. The WFP noted that this was the fourth attack on Akuem since May 2001.
[1109]
Richard Boucher, spokesman, State Department press statement, "Aerial Attacks
in Southern Sudan," Washington, DCWashington, D.C.,
February 12, 2002, http://www.state.gov/r/pa/prs/ps/2002/7966.htm (accessed
June 20, 2002).
[1110] WFP press release, "WFP Condemns Attack on Civilians at Food Distribution in Southern Sudan," New York/Nairobi, February 21, 2002; "Sudan: Peace talks suspended after alarming gunship attack," IRIN, Nairobi, February 22, 2002 ("Khartoum subsequently expressed its 'profound regrets' over the attack at Akuem, saying it was the result of a technical error and not a premeditated act.").
[1111] "WFP Condemns Attack . . . at Food Distribution," February 21, 2002; "Sudan Army Helicopter Rockets Civilians at UN Food Center," AP, Nairobi, February 21, 2002; "NGO urges concerted action against civilian attacks," IRIN, Nairobi, March 1, 2002.
[1112] "WFP Condemns Attack . . . at Food Distribution," February 21, 2002.
[1113] Richard Boucher, spokesman, State Department press statement, "Aerial Attacks on Feeding Site in Sudan," Washington, D.C., February 21, 2002.
[1114] Eli J.
Lake, "U.S. suspends talks with Sudan," UPI, Washington, DCWashington,
D.C., February 21, 2002.
[1115] Julie Flint, "Fuels Flames of War in Sudan," Guardian (London), Ngop, Southern Sudan, March 7, 2002.
[1116]WFP press release, "WFP condemns attack on civilians at food distribution in Southern Sudan," New York/Nairobi, February 21, 2002; OCHA press release, "Statement Attributable to ERC [U.N. Emergency Relief Coordinator], WFP Executive Director and UNICEF Executive Director on Attacks on Civilians in Sudan," February 21, 2002; Government of Norway press release, "Norway condemns attack by Sudan government on civilians," February 21, 2002; "UK angry as civilians in Sudan killed," Birmingham [U.K.] Post, February 23, 2002;E.U. press release, "Declaration by the Presidency on behalf of the European Union on bombings of civilian targets in Sudan," February 28, 2002; CARE press release, "Humanitarian agencies condemn government attacks on civilians," Atlanta, March 4, 2002, All Africa Global Media, March 4, 2002; HRW press release, "Sudan: Investigage Helicopter Killings," New York, March 1, 2002, http://hrw.org/press/2002/03/sudan0301.htm (accessed September 23, 2003); Letter, Jim Buckee, Talisman CEO, to Mustafa Osman Ismail and Awad Ahmed El Jazz, Sudanese government ministers of foreign affairs and energy and mining, respectively, February 26, 2002, provided by Reg Manhas of Talisman, email to Human Rights Watch, March 6, 2002. Buckee criticized the government for its statement that the Sudanese army was protecting oil wells against rebel attack, noting that the Lundin oil wells are not operational and that the nearest oil wells are those of Talisman and GNPOC, some one hundred to 150 kilometers north of Bieh, where civilians were killed while gathered at a WFP food distribution point. "This linkage of defense of the oilfields with attacks on noncombatants is improper and outrageous," he stated.
[1117] "Sudan criticizes US suspension of peace efforts, probes civilian killings," AFP, Khartoum, February 25, 2002.
[1118]
Embassy of the Republic of Sudan to Germany, press release, February 24, 2002,
translation provided by Marina Peter, Sudan Focal
Point-Europe.
[1119] "Sudan voices regret over 'mistaken' bombing of civilians," AFP, Cairo, February 28, 2002; see "Sudan says its helicopter fired on civilians receiving U.N. aid,"AP, Cairo, February 28, 2002. The statement of regret carried in AP was hedged with references to U.S. armed forces mistakes in Afghanistan and blame of the SPLM/A for not signing a ceasefire.
[1120] Ibid.
[1121] The language of the agreement was broadened from a prohibition on aerial bombardment of civilians to include all forms of attacks on civilians and civilian objects when it became clear that Khartoum would read the "no aerial bombardment" provision to permit it to conduct ground attacks on civilians. In addition, the government sought to include SPLA attacks in the agreement.
[1122] Sen. Russell Feingold (D-WI)chastised the State Department, the agency responsible for the civil protection monitoring project, for its delay in implementing the agreemtn at a hearing on July 11, 2002, held by the Senate Foreign Relations Committee. See Federal Document Clearing House, Inc. for July 11, 2002, from CQ Testimony Service, 209 Pennsylvania Avenue, S.E., Washington, D.C. 20003.
[1123]S.L. Laki,
"The Impact of the Jonglei Canal on the Economy of the Local People," International
Journal of Sustainable Development and World Ecology 1 (1994), p. 90."The Impact
of the Jongelei Canal," p. 93;
Sam L. Laki, "Management of water resources of the Nile Basin," International.
Journal of Sustainable Development, World Ecology 5 (1998), p. 292; another
source says that the shoebill stork occurs also in Zambia and Uganda, and is
very rare. Philip Winter, email to Human Rights Watch, August 22, 2003.
[1124] "The
Impact of the Jongelei Canal," p. 93; "Management of
water resources of the Nile Basin," p. 292.
[1125] "The
Impact of the Jongelei Canal," p. 89; see Jonglei
Investigation Team.
[1126] "Impact of the Jonglei Canal," p. 91.
[1127] IGAD
is an East African body created under the Organization of African Unity in
1986, comprising Djibouti, Eritrea, Ethiopia, Kenya, Somalia, Uganda, and Sudan),
initially called the Intergovernment Authority on Drought and Dessertification
(IGADD). IGAD now stands for the Intergovernmental Authority
on Development.The IGAD member states are Djibouti, Eritrea,
Ethiopia, Kenya, Somalia, Sudan, and Uganda.
[1128]The IGAD
Partners' Forum included the following: Norway, Italy, Belgium, Canada, Egypt,
Finland, France, Germany, Greece, Ireland, Japan, the Netherlands, Sweden,
Switzerland, the U.K., the U.S., the European Commission, the United Nations
Secretariat, the UNDP, the UNHCR, and the WFP. The
Russian Federation as observer attended the seventh meeting of the Committee on
Sudan of the IGAD Partners' Forum in Rome on March 20, 2001.The active
members of the IGAD Partners' Forum were Canada, Egypt, France, Italy, the
Netherlands, Norway, Switzerland, U.K., E.U., U.N. Food and Agriculture
Organization (FAO), U.N. Development Programme (UNDP), U.N. High Commissioner
for Refugees (UNHCR), and WFP. Those periodically participating were Japan,
Russia, Sweden, the U.S., and WHO. Draft Second Interim Report,
"IPF Working Group on Planning for Peace in Sudan," prepared for the IPF meeting,
Rome, March 20, 2001, internal agency document.
[1129] Ibid., p. 8.
[1130] Email, Philip Winter to Human Rights Watch, August 22, 2003.
[1131] Although the wells' location was not specified, at the time CNPC was engaged in the GNPOC project.
[1132] The environmental conservation movement in Sudan started in the 1960s with the founding of the National History Society in the University of Khartoum, followed by the Nature Conservation Society in 1970. The SECS was established with fifty members with research and academic backgrounds in 1975. Its membership increased to 3,000 by 1992. It has about fifteen chapters throughout Sudan (except for the south) and about 6,000 members. Mohamed Ibrahim Elgadi, Oppression Evaluation: Covert Agenda in Program Evaluation (Amherst, MA: Center for International Education, University of MA, forthcoming).
[1133] Yahya el Hassan, "Sudan Keen to Avert Oil Industry Pollution," PANA, Khartoum, February 1, 1999.
[1134] "Sudan's President Bashir Slashes Fuel Prices," PANA, Khartoum, June 30, 2000.
[1135] Ibid.
[1136] "Sudan:
Energy Ministry keen to make oil production environmentally friendly," SUNA,
Khartoum, in English, May 11, 2000, from BBC
Monitoring,May 11, 2000,
World Reporter, May 11, 2000. John Dor had earlier
beenwas state minister for petroleum. John
Dor, Human Rights Watch interview, Khartoum, July 25, 1999.
[1137] "Sudan
adopts new law on environmental protection," Sudan TV, Omdurman, Sudan, in
Arabic, June 5, 2000, as translated inBBC
Monitoring, June 5, 2000, World Reporter, June 5,
2000.
[1138] "Environmental Policy Laws, Sudan," in English, Reg Manhas, letter to Human Rights Watch, September 4, 2001.
[1139] Ibid.
[1140] "Muglad Basin Oil Development Project, Pipeline System EPC II, Environmental Impact Assessment Report," revised by Institute of Environmental Studies, University of Khartoum, for China Petroleum Engineering Construction Corporation, August, 1998. Faxed from Reg Manhas, Talisman Energy, to Human Rights Watch, February 13, 2001.
[1141] David Porter, Talisman, email to Human Rights Watch, March 21, 2001.
[1142] Ibid.
[1143] Lundin Oil Annual Report, 2000, page 6, fax from Christine Batrusch, Lundin Oil, to Human Rights Watch, June 5, 2001.
[1144] Ibid.
[1145] Ibid.
[1146] Lundin Petroleum AB, "Code of Conduct, Attitude Towards the Environment," http://www.Lundin-petroleum.com (accessed May 28, 2002).
[1147] Lundin Oil press release, "Lundin Oil Looks into Allegations on Sudan," Geneva, March 15, 2001.
[1148] Christine Batruch, Lundin Oil, letter to Human Rights Watch, attaching Lundin Oil Annual report, p. 6, faxed March 7, 2001.
[1149] OMV, "Environmental Report," http://OMV.com/mainframe.html (accessed March 18, 2001).
[1150]"Kalagate Imagery Report, Sudan Oilfield Exploration Concession," April 2001, published by Talisman Energy, Calgary. Inside the cover is the report of Geoffrey John Oxlee, Kalagate Imagery Bureau, "Report KIB/035-1/2001, Subject: Sudan Oilfield Exploration Concession," April 2, 2001.
[1151] Ibid., pp. 5-6, and Image 2. The "new road" refers to the oilfield road.
[1152] See, for example, Human Rights Watch, The Price of Oil: Corporate Responsibility and Human Rights Violations in Nigeria's Oil Producing Communities (New York: Human Rights Watch, 1999), pp. 68-72.
[1153] Riek Mansour Khalid, Deputy Secretary General, Foreign Relations, NDA press release, London, August 10, 1995 ("the NDA wishes to serve notice . . . that any agreements concluded with the NIF illegitimate regime . . . shall be considered . . . a contribution to that regime's war effort . . .."); Deng Alor Kuol, "SPLM/SPLA Press Release" ("all Arakis Energy Corporation oil production installations, pipeline and port facilities will be legitimate SPLA military targets"), Chukudum, New Sudan, July 11, 1995. Threats by the NDA and SPLM/A to Arakis were mentioned in Cheryl Strauss Einhorn, "Arakis Energy Corp.: Pipe Dream?" Barron's (New York), August 28, 1995.
[1154] "Arakis Energy Belittles Threat From Sudanese Rebel Group," Bloomberg (New York), August 14, 1995.
[1155] As of July 1, 2001, the Inter-Church Coalition on Africa (ICCAF) became part of KAIROS: Canadian Ecumenical Justice Initiatives/Initiatives canadiennes oecumeniques pour la justice.
[1156] Inter-Church Coalition on Africa press release, Toronto, July 20, 1995.
[1157] "Arakis to Awaken Slumbering Sudan with Saudi Cash," Petroleum Intelligence Weekly (New York), July 17, 1995.
[1158] Jim Buckee, Talisman Energy press release, "Talisman Agrees to Acquire Arakis,"Canada Stockwatch (Vancouver), Calgary, August 17, 1998. Shortly thereafter, the U.S. bombed a pharmaceutical plant in Khartoum. See Human Rights Watch letter to U.S. President Bill Clinton, September 15, 1998, http://www.hrw.org/press98/sept/sudan915.htm. Talisman decided to proceed with its investment.
[1159] TCCR letter to Talisman dated August 28, 1998, available at http://www.web.net/~tccr/CorpResp/Talisman-PhaseOneRep(Jn99).html (accessed March 18, 2001).
[1160] Talisman purchased all the outstanding stock of Arakis. Jim Buckee, Talisman Energy press release, "Talisman Advances Funds to Arakis," Canada Stockwatch (Vancouver), Calgary, August 31, 1998; David Mann, Talisman Energy press release, "Talisman Advances Additional Funds to Arakis," Canada Stockwatch (Vancouver), Calgary, September 18, 1998. David Mann, Talisman Energy press release, "Talisman Acquires Arakis Energy," Canadian Corporate News, Calgary, October 8, 1998.
[1161] Talisman Energy, "Background Paper," pp. 2-3; Talisman Energy, "Company Highlights," http://www.Talisman-energy.com/high.html (accessed July 17, 1999).
[1162]Inter-Church Coalition on Africa, "Media Release Re: Canadian corporate involvement in Sudan Action against Talisman Energy Inc. needed urgently, Canadian agencies tell Axworthy," Toronto, November 18, 1998.
[1163] Talisman officials, interview, February 3, 2000.
[1164] See
[1165] Riek Machar, interview, August 8, 2000. Riek Machar said he told Jim Buckee that the unit of forty-one rebels who "closed down" Chevron by killing three expatriate employees was led by Cmdr. James Lial Dieu.
[1166] Reg
Manhas, Senior Advisor, Corporate Responsibility, Talisman
Energy, letter to Human Rights Watch, September 13, 2000.
[1167] Talisman officials, interview, February 3, 2000.
[1168] Riek Machar, interview, August 8, 2000.
[1169] Reg Manhas, letter to Human Rights Watch, September 13, 2000
[1170] Riek Machar, interview, August 8, 2000.
[1171] Reg Manhas, letter to Human Rights Watch, September 13, 2000.
[1172] J.W. Buckee, "Letter to Shareholders-Sudan," Calgary, November 23, 1999.
[1173] Riek Machar, "Response to The Letter to the Shareholders," May 5, 2000.
[1174] Reg Manhas, letter to Human Rights Watch, September 13, 2000.
[1175] Taban Deng, interview, July 26, 1999.
[1176] Ibid.
[1177] Ralph R. Capeling, General Manager, GNPOC, Pipeline Division, telephone interview with Human Rights Watch, Khartoum, July 28, 1999.
[1178] Jennifer Ditchburn, "Codes of Conduct Needed in Deals with Sudan: Axworthy," Canadian Press, Ottawa, March 15, 1999.
[1179] Chris Varcoe, "Talisman Sees Hope in Sudan; Calgary Firm Continues to Face Obstacles," Calgary Herald, Ottawa Citizen, March 19, 1999.
[1180] Jeff Sallot, "Ottawa, Calgary oil firm pursue peace in Sudan," Globe and Mail (Toronto), Ottawa, March 18, 1999.
[1181] Claudia Cattaneo, "Oil Independents Playing in the Bigs," National Post (Toronto), Calgary, June 10, 1999.
[1182] "Talisman Energy Inc. Rejects Shareholder Proposal," Canada NewsWire, Toronto, March 8, 1999.
[1183]J.W. Buckee, "Letter to Shareholders," March 10, 1999.
[1184] "Focus: Sudan rebels say Talisman oil wells legitimate target," Reuters, Calgary,
May 4, 1999.
[1185] See Michael L. Ross, "Does Oil Hurt Democracy?" World Politics, April 2001 The study concluded that answer to the question posed by the title was "yes": "First, the oil-impedes-democracy claim is both valid and statistically robust. Oil does greater damage to the cause of democracy in poor states than rich ones, and a given rise in oil exports will do more harm in oil-poor states than oil-rich ones. . . . The fourth finding is that there is at least a tentative support for three causal mechanisms that link oil and authoritarianism: a rentier effect, . . . ; a repression effect, by which governments build up their internal security forces; and a modernization effect, in which the failure of the population to move into industrial and service sector jobs renders them less likely to push for democracy." Ibid., p. 31.
[1186]Human Rights Watch, The Price of Oil: Corporate Responsibility and Human Rights Violations in Nigeria's Oil Producing Communities; Human Rights Watch Backgrounder, "The International Monetary Fund's Staff Monitoring Program for Angola: The Human Rights Implications," (New York: Human Rights Watch, updated September 25, 2000); Human Rights Watch Backgrounder, "The Oil Diagnostic in Angola: A Update," (New York: Human Rights Watch, March 2001); Human Rights Watch, The Niger Delta: No Democratic Dividend (New York: Human Rights Watch, October 2002). All at www.hrw.org/corporations.
[1187] See above, "Government Campaign of Forcible Displacement from Block 1, February-July 1999."
[1188] J.W. Buckee, letter to Talisman shareholders, Calgary, May 27, 1999.
[1189] Press coverage of Biem internally displaced persons, i.e., Charlie Gillis, "Meeting the Victims of Sudan's Oil Boom," National Post (Toronto), Biem, Western Upper Nile, November 27, 1999; see "Oil-Related Events, Displacement, and Devastation by the Sudan Government in Blocks 1 and 4, 1999," above.
[1190] Talisman Energy press release, "Talisman – First Oil into Sudan Pipeline," Calgary, July 6, 1999.
[1191] Talisman Energy Background Paper, "Sudan – The Greater Nile Oil Project," December 1998, p. 6.
[1192]
"Report on the situation of human rights in the Sudan," prepared for the
General Assembly by Leonardo Franco, sSpecial
rRapporteur
on the situation of human rights in the Sudan, A/54/467, agenda item 117 (c),
October 19, 1999.
[1193] Steven Edwards, Claudia Cattaneo, and Sheldon Alberts, "Calgary Firm Tied to Sudan 'Atrocities,'" National Post (Toronto), United Nations, Khartoum, and Ottawa, November 17, 1999.
[1194] J.W. Buckee, president and CEO of Talisman, letter to Martin Hill, Acting Africa Program Director, Amnesty International, July 14, 2000, attached to letter, Reg Manhas to Human Rights Watch, September 13, 2000.
[1195] Amnesty International, "Oil in Sudan – Deteriorating Human Rights," London, AFR: 54/04/OO, May 3, 2000.
[1196] Linda Slobodian, "No Profits for the Sudanese," Calgary Sun, July 25, 1999.
[1197] See "Commander Gatdet's Troops Attack Oil Areas and Oilrig in Block 1, October 1999," above; Talisman officials, interview, February 3, 2000.
[1198] Government of Canada press release, "Canada Announces Support to Sudan Peace Process," Ottawa, October 26, 1999.
[1199] Backgrounder, "Canada's Sudan Policy," Ottawa, October 26, 1999, p. 5.
[1200] David Ljunggren, "Canada threatens Talisman sanctions over Sudan," Reuters, Ottawa, October 26, 1999.
[1201]International Code of Ethics for Canadian Business, http://www.uottawa.ca/hrrec/busethics/codeint.html (accessed June 6, 2001). The code was developed by the private sector following two conferences with the foreign ministry. Canadian Department of Foreign Affairs Press Release No. 143, "Axworthy And Marchi Welcome Canadian Business Focus On International Practices," September 5, 1997, http://www.dfait-maeci.gc.ca/english/news/press_releases/97_press/97_143e.htm (accessed June 24, 2001).
[1202] In 1994 the parties to the IGAD negotiations, the SPLM/A and the government of Sudan, agreed to a Declaration of Principles (DOP). "IGAD Peace Initiative: Declaration of Principles," Nairobi, July 20, 1994, http://www.freedomhouse.org/religion/sudan/publications/igad_dop.htm (accessed September 25, 2003).
[1203] Backgrounder, "Canada's Sudan Policy," p. 6.
[1204] Ibid. EICA The Export
and Import Controls Act provides that, as designated by the
minister of foreign affairs, certain imports from and exports to a particular
country may be subjected to scrutiny by the foreign ministry, which could
refuse to permit the transaction. SEMA The Special Economic Measures
Act authorizes imposition of sanctions on Canadian corporations as
part of a multilateral action, such as Security Council mandated sanctions.
The Area Control List, mentioned in the Harker report as an alternative consideration, provides that Canada is able to apply selective trade restrictions with regard to a country placed on the ACL list, in support of specific foreign policy and security objectives. Thus machine tools for weapons production would not be permitted to be sent to Sudan under the ACL. Harker report, pp. 68-69.
[1205] "Shares in Canada's Talisman fall on sanctions talk," Reuters, Calgary, October 27, 1999; "Talisman Share Price Drop a Short-Term Situation, Analysts Say," Bloomberg, Calgary, October 29, 1999; Jeffrey Jones, "Sudan fears overshadow Talisman's rich results," Reuters, Calgary, November 5, 1999.
[1206]Jeffrey
Jones, "FOCUS-Sudan fears overshadow Talisman's rich results," Reuters,
Calgary, November 5, 1999.Ibid.
[1207] Ibid.
[1208] Peter Foster, "Sudan: Talisman in ethical no man's land," Financial Post (Toronto), November 12, 1999.
[1209] International Code of Ethics for Canadian Business.
[1210] "Statement by the USAP on Oil," reprinted in Sudan Democratic Gazette, Year X [10], no. 115, London, December 1999, p. 9.
[1211] As with all other political parties in Sudan, USAP was banned when the current government came into office in 1989, and it registered as a political party under 1999 legislation authorizing political associations.
[1212] "Statement by the USAP on Oil."
[1213] Ibid. As a result, the statement continued, whole villages were burned down, and many residents were shot with bullets "acquired with oil money." Ibid.
[1214] Harker report, p. 15.
[1215] See satellite image, http://rightsmaps.com/html/sudsat1.html (accessed June 5, 2001), go to Umm Sagura and Munga oilfields for images of seismic tracks.
[1216] "Seeking Riches in Sudan," Calgary Herald, November 20, 1999. This assumes that the plane actually flew over villages allegedly destroyed, a fact not in evidence.
[1217]Claudia
Cattaneo with Carol Howes, "Analysts upbeat
about Talisman's Sudan role," [source?
SOURCE?]November 17,
1999.
[1218] Rosalind Russell, "Sudan's new oil riches could bring wealth or war," Reuters, Heglig oilfield, Sudan, November 18, 1999. Russell was based in Nairobi, unlike most of the journalists on the trip.
[1219] As set forth above, the census and most Sudanese do not regard Nuer and Dinka as nomads. They are regarded as "rural" in the census, and from a social science or anthropological point of view are transhumant, that is, practicing a form of pastoralism (or nomadism) organized around the seasonal migration of livestock. Transhumance is practiced in those parts of the world where there are mountains, highlands, or other areas that are too cold (or too flooded, in the case of Sudan) to be utilized for grazing throughout the year.
[1220]J.W. Buckee, letter to Talisman shareholders, "Letter to Shareholders – Sudan," Calgary, November 23, 1999.
[1221] Rosalind Russell, "Sudan's new oil riches could bring wealth or war," November 18, 1999.
[1222] Buckee, letter to shareholders, November 27, 1999.
[1223] Talisman officials, interview, February 3, 2000.
[1224] Harker report, p. 63.
[1225] The other team members were Georgette Gagnon, Audrey Macklin, Ernie Regehr, Penelope Simons, and Hamouda Soubhi.
[1226] Charlie Gillis, "Letter to Envoy Contradicts Firm's Earlier Denials," National Post (Toronto), January 14, 2000.
[1227] Jeff Sallot, "Axworthy protests Sudan's tactics in oilfields," Globeand Mail (Toronto), January 6, 2000.
[1228] David Ljunggren, "Sudan denies Canada allegations on military flights," Reuters, Ottawa, January 13, 2000.
[1229] Harker report, p. 15.
[1230] The Canadian foreign ministry said that as a matter of Canadian privacy law, it had to submit the Harker report to Talisman before its public release, because the Talisman name appeared in the report. As a result, the company was able to conduct a lobbying campaign with several powerful Canadian government ministries to avoid strong government measures. See David Ljunggren, "Canada oil firm said in talks on key Sudan report," Reuters, Ottawa, February 7, 2000.
[1231] Harker report, p. 16. Indeed, fighting continued for almost three more years of oil extraction, until a vigorous international peace-making effort led by IGAD, the U.S., the U.K., and Norway produced an interim ceasefire agreement in October 2002, which was violated by the government in Western Upper Nile/Unity State on several occasions in 2003. See Herbert J. Lloyd, Civilian Protection Monitoring Team (CPMT), "CPMT Final Report: Military Events in Western Upper Nile 31 December 2002 to 30 January 2003," February 6, 2003; Charles H. Baumann, CPMT, "Report of Investigation: Violence Against Civilians Along the Bentieu-Leer-Adok-Road," Khartoum, August 19, 2003, http://www.cpmtsudan.org/finalreports/violence.zip (accessed September 24, 2003).
[1232] "Statement of the Sudanese Churches on the oil factor in the conflict in the Sudan," signed by representatives of the Sudan Council of Churches, based in Khartoum, and the New Sudan Council of Churches, based in Nairobi, dated April 14, 2000, http://SudanInfonet.tripod.com/NSI (accessed June 7, 2001).
[1233]Lloyd Axworthy, minister of foreign affairs, press conference on Sudan, Ottawa, February 14, 2000 (the minister said that sanctions were not off the table and the issue would be revisited).
[1234] "Talisman shares jump in wake of Sudan report," Financial Post (Toronto), Ottawa, February 16, 2000.
[1235] The Canadian government had supported the establishment and operation of a Sudan Peace Talks Secretariat in Nairobi, under IGAD, to carry out continuous and sustained mediation efforts for peace in Sudan. "Canada Supports Sudan Peace Talks Secretariat," Canada News Wires, Ottawa, July 26, 1999.
[1236] The Canadian government was aware that four Canadian NGOs were having quiet discussions with Talisman to, among other things, establish an independent human rights monitoring office with funding from Talisman, the Canadian government, and other sources. The four groups were Steelworkers Humanity Fund, United Church of Canada, Project Ploughshares, and World Vision Canada. Many Canadian NGOs declined to participate in these talks because they felt Talisman would not negotiate in good faith. Ernie Regehr, "Drilling for a Corporate Conscience," Globe and Mail (Toronto), March 20, 2000. (Regher was a participant in the negotiations.)
[1237] Department of Foreign Affairs and International Trade Press release no. 26, "Axworthy Outlines New Initiatives to Further Peace in Sudan," Ottawa, February 14, 2000.
[1238] Randall Palmer, "Focus: Rights groups deal blow to Canada Sudan policy," Reuters, Ottawa, February 24, 2000. Less than one month after Canada's failure to enact sanctions against Talisman, another Canadian oil company announced it would invest in Sudan's oilfields. In March 2000, Fosters Explorations Ltd., described in the press as "a fledgling Canadian junior oil company," said it was investing in Blocks 3 and 7, in the Adar Yale oilfield in the Melut Basin in Eastern Upper Nile. Minister Axworthy recommended that Fosters think twice about operating in Sudan. Oil company operations "have a serious impact on the political situation and the human rights situation," said Minister Axworthy. "It puts a much stronger onus on companies." Fosters backed out as quickly as it jumped in, saying it was unable to raise the money. In the meantime, human rights critics, both Canadian and American, had besieged it. Sudan had been inviting bids for exploration on these blocks since 1998. Claudia Cattaneo, "Fosters unit wins Sudan concession: Junior's site double the size of nearby Talisman field," Financial Post (Toronto), Calgary, Canada, March 13, 2000; "Slavneft Seeks Oil Riches in Sudan," Africa Analysis, May 3, 2001.
[1239] U.S.
Treasury Department news release, No. 320, "Treasury Announces Sanctions
Against Sudan's Sudapet Oil," Washington, DCWashington, D.C.,
February 24, 2000.
[1240] Peter
Morton and Claudia Cattaneo, "U.S. imposes sanctions on Talisman Sudan project,
Contrast with Canada," National Post (Toronto), Washington, DCWashington,
D.C., and Calgary, February 17, 2000; Karen DeYoung, "Over U.S.
Protests, Canada to Reopen Sudan Ties," Washington Post, February 15,
2000.
[1241] Ibid.
[1242] "U.S. imposes sanctions . . . Contrast with Canada," February 17, 2000.
[1243] David Melvill, desk officer, Canadian Department of Foreign Affairs and International Trade, email to Human Rights Watch, Ottawa, April 3, 2000.
[1244] Anthony Goodman, "Canada drops bid to discuss Sudan in U.N. council," Reuters, United Nations, April 4, 2000.
[1245]Anonymous
Human Rights Watch interview with diplomat, May 2000.
[1246] Steven Chase, "War and Profit: Talisman plays with fire in Sudan," Globe and Mail (Toronto), Calgary, October 9, 1999.
[1247] Claudia Cattaneo, "Lingering 'Sudan effect' likely to tarnish Talisman," Financial Post (Toronto), Calgary, February 24, 2000.
[1248]
Jeffrey Jones, "Talisman CEO faces sharp criticism . . . at annual
meeting," Reuters, Calgary, May 3,
2000.
[1249] Eoin Kenny, "Investors curse Calgary oil giant's involvement in wartorn Sudan," Canadian Press Newswire, May 4, 2000.
[1250] Amnesty International, "Oil in Sudan – Deteriorating Human Rights," AFR/54/01/00, London, May 3, 2000, p. 5. This report was also based on interviews of the displaced.
[1251] Jeffrey Jones, "Talisman CEO faces sharp criticism at annual meeting," Reuters, Calgary, May 3, 2000.
[1252] J.W. Buckee, letter to Martin Hill, Amnesty International, July 14, 2000.
[1253] Amnesty International, "Oil in Sudan – Deteriorating Human Rights."
[1254] Reg Manhas, letter to Human Rights Watch, September 13, 2000.
[1255] Amnesty Internatinal press release, "Sudan: Talisman must do more to protect human rights," London, May 1, 2001.
[1256] Reg Manhas, letter to Human Rights Watch, September 13, 2000.
[1257] See Appendix A.
[1258] Arakis had been lead partner in GNPOC and Talisman bought out Arakis. Later Talisman publications did not designate any company as "lead" but stated the key management positions within GNPOC were occupied by representatives of each consortium member, and that decisions made by committees within GNPOC required an affirmative vote of at least two consortium members holding at least 60 percent interest. Talisman Energy, Corporate Social Responsibilty Report 2001, p.13.
[1259]Reg Manhas, Talisman corporate responsibility representative, presentation at Tufts conference, July 2000, and at CSIS, November 2000; Talisman Energy, Corporate Responsibility Report 2001, p. 17.
[1260] Reg Manhas, letter to Human Rights Watch, September 13, 2000.
[1261] Ibid.
[1262] Ibid.
[1263] See http://www.petronas.com.
[1264] Reg Manhas, letter to Human Rights Watch, attached unsigned code, October 20, 2000; Talisman, Corporate Social Responsibility Report 2001, p.12.
[1265] Letter, Reg Manhas to Human Rights Watch, attached unsigned code, October 20, 2000, emphasis added.
[1266] Ibid.
[1267] Reg Manhas, letter to Human Rights Watch, attached unsigned code, October 20, 2000; Talisman Energy, Corporate Social Responsibility Report 2001, p.12.
[1268] Reg Manhas, letter to Human Rights Watch, September 13, 2000.
[1269]
Humanitarian Agency Coordination Conflict Resolution Database; Talisman
(Greater Nile) B.V., "Community Development Strategy – 2001," updated
October 30, 2000undated, appendix (undatedupdated
October 30, 2000)..
[1270] Talisman Energy, Corporate Social Responsibility Report 2000, Pricewaterhouse Coopers audit (March 6, 2001), pp. 11-42.
[1271] Ibid., p. 18.
[1272] Ibid.
[1273] The Corporate Responsibility Report 2000 says, "In the concession area, GNPOC has compensated people affected by GNPOC operations, such as the drilling of wells and seismic exploration activity. However, the process of identifying people affected by such activity and the provision of fair compensation has not been well documented." Ibid., p. 17.
[1274] Ibid.
[1275] Talisman Energy, Corporate Social Responsibility Report 2000, p. 18.
[1276] Reg Manhas, letter to Human Rights Watch, September 13, 2000.
[1277] Ibid.
[1278] HRW interviews, various, 1999-2000.
[1279] Reg Manhas, letter to Human Rights Watch, September 13, 2000.
[1280] Koblanck, "Lundin Oil's road/DN in Sudan," April 28, 2001.
[1281] Hafirs are an ancient low-tech method of collecting, holding, and filtering rainwater in areas lacking access to a suitable underground aquifer.
[1282]Talisman
(Greater Nile) B.V., "Community Development Strategy – 2001," undated, pp. 6-8.Talisman, Corporate
Social Responsibilit Report 2000, p. 18. not
on this page or specifically in report [CK NOTE]
[1283] Claudia Cattaneo, "Talisman lending a hand to Sudan refugees," National Post (Toronto), August 23, 2000.
[1284] Ibid.
[1285] One consideration facing these organizations was that the SPLM/A had already declared Talisman a military target, so that association with Talisman might result in the NGO also being targeted, a consequence Talisman may not have considered.
[1286] CARE, Oxfam, German Agro Action (GAA), Fellowship for African Relief (FAR), Norwegian Church Aid (NCA), and International Volunteer Organization for Cooperation (OCVI).
Inter-Church Commission on Africa press release, Toronto, September 8, 2000.
[1287]Inter-Church Commission on Africa press release, Toronto, September 8, 2000. Commenting further on Talisman's newsletter, the press release stated, "Talisman has merely 'consulted' those organizations' documents and made it sound like engagement, dialogue and cooperation are ongoing." Ibid.
[1288]
Talisman (Greater Nile) B.V., "Community Development Strategy – 2001," updated
October 30, 2000undated, appendix (October 30, 2000undated).
[1289] Ibid, p. 1.
[1290] The total net income available to shareholders in 2000 was U.S. $ 835 million, and Sudan social spending was U.S. $ 1 million, or 0.12 percent of total net income. The comparable amounts were post-tax income of U.S. $ 709 million in 2001, with Sudan social spending of U.S. $ 1.437 million, or 0.2012 percent of total net income. Talisman Energy, 2002 Annual Report, March 4, 2003, p. 38; Talisman Energy, Corporate Social Responsibility Report 2000, p. 23; Talisman Energy, Corporate Social Responsibility Report 2001, pp. 11, 23.
[1291] Talisman Energy, Corporate Social Responsibility Report 2000, p. 23.
[1292] Alistair Lyon, "Talisman hopes work in Sudan will silence critics," Reuters, Khartoum, January 22, 2001.
[1293] Talisman Energy, Corporate Social Responsibility Report 2001, pp. 11, 23. Talisman approved a U.S. $ 2 million community development work plan for 2001, but because it was not all expended, it put the balance (U.S. $ 581,515) into a trust. Ibid., p. 11.
[1294] For the year 2002, in which Talisman sold out its interest in Sudan, it issued a Corporate Social Responsibility Report 2002 that did not include social spending information on Sudan comparable to that of 2001.
[1295] "Church officials say foreign oil companies should stop Sudan operations," AP, Ottawa, April 10, 2001.
[1296] "Talisman Energy posts Q1 profit of $346 million," Canadian Press, Calgary, May 1, 2001, http://www.canoe.ca/MoneyNews/may1_talisman-cp.html (accessed May 3, 2001); James Stevenson, "Sudan overhangs Talisman annual meeting despite record profit, new dividend," CP, Calgary, May 1, 2001.
[1297] "Sudan
overhangs Talisman annual meeting . . . ."; Jeffrey Jones, "Talisman CEO faces
human rights critics . . . over Sudan," Reuters, Calgary, May
1, 2001.
[1298] Amnesty International press release, "Sudan – Talisman Energy must do more to protect human rights," London, May 1, 2001.
[1299] Preliminary Report, May 15, 2001. The full report was issued in October 2001, and presented at the Royal Institute of International Affairs in London on October 15, 2001, where Talisman CEO Jim Buckee was one of three keynote speakers on corporate social responsibility. John Ryle and Georgette Gagnon, "Report of An Investigation into Oil Development, Conflict and Displacement in Western Upper Nile, Sudan," London and Toronto, October 15, 2001, Royal Institute of International Affairs, http://www.riia.org/Conferences/corporatesocialresponsibility.pdf (accessed November 1, 2001).
[1300] Gagnon and Ryle, "Preliminary report," Toronto, May 15, 2001.
[1301] Charlie Gillis, "Letter to Envoy Contradicts Firm's Earlier Denial," National Post (Toronto), January 14, 2000.
[1302] There is no such category in the rules of war for "offensive" and "defensive" activities. International humanitarian rules of war forbid targeting civilians or civilian objects, or indiscriminately attacking them. "Defensive" activities that target or indiscriminately hit civilians or civilian objects are not permissible under the rules of war. Therefore even "defensive" activities that targeted or indiscriminately hit civilians or civilian objects would be illegal.
[1303] Talisman Energy, Corporate Social Responsibility 2000, p.16.
[1304] "Market Snapshot: This Talisman unlikely to fend off bids," CBS.MarketWatch.com, Calgary, June 7, 2001; Claudia Cattaneo, "Talisman wavers on Sudan: Considering offers; Oil firm spooked by U.S. moves on ownership," Financial Post (Toronto), Calgary, June 19, 2001.
[1305] "Canada's Talisman vows to continue oil operations in Sudan," AFP, Khartoum, June 4, 2001.
[1306] Simon Tuck and Heather Scoffield, "Federal MP targets firm's Sudan links," Globe and Mail (Toronto), Ottawa, March 10, 2001.
[1307] Rachel Noeman, "Canada concerned on Sudan links to oil airfield," Reuters, Cairo, May 7, 2001. John Manley was on the first leg of a regional tour when quoted. Axworthy stepped down in September 2000 as foreign minister and Manley was appointed to that position in November 2000.
[1308] Ibid.
[1309] "Canadian MP blasts Sudanese government," AFP, Ottawa, May 1, 2001.
[1310] "Canada criticizes both sides in Sudan civil war," Reuters, Ottawa, May 23, 2001; Foreign Affairs press release No. 64, "Manley and Kilgour Express Concern Over Situation in Sudan," Ottawa, May 23, 2001.
[1311] Rev. Bill Phipps and four other Canadian church leaders, letter to the Hon. John Manley, Ottawa, June 22, 2001.
[1312] Statement from the office of Maurice Vellacott, MP-Saskatoon (Canadian Alliance), Ottawa, August 2, 2001.
[1313] Claudie Senay, second secretary, Canadian High Commission in Nairobi, "Canada Condemns Attacks on Civilians and Humanitarian Workers in Sudan," email, March 5, 2002; this condemnation appeared to follow a fax to the office of the minister of foreign affairs by Gary W. Kenny, Africa Human Rights Researcher/Policy Advocate, KAIROS, Toronto, March 1, 2002, conveying his dismay at the ministry's failure to issue an appropriate public statement, email to Human Rights Watch, March 1, 2002.
[1314] Claudia Cattaneo, "Talisman fights back on Sudan displacement claims: releases aerial images," Financial Post (Toronto), Calgary, April 19, 2001; "Kalagate Imagery Report, Sudan Oilfield Exploration Concession," April 2001, published by Talisman Energy, Calgary. Inside the cover is the report of Geoffrey John Oxlee, Kalagate Imagery Bureau, "Report KIB/035-1/2001, Subject: Sudan Oilfield Exploration Concession," April 2, 2001.
[1315] David Mann, Talisman Energy press release, "Kalagate Report Background," in "Kalagate Imagery Report, Sudan Oilfield Exploration Concession," Calgary, April, 2001.
[1316] But the word "appreciable" gives pause. Indeed, there is some evidence buried in the text that warrants this qualification. El Toor's images show an original indigenous village (Athonj) that disappeared from the photos in the time frame under consideration. Another village in a different location a few kilometers away first appeared in the 2000 image, however. "Kalagate Imagery Report, Sudan Oilfield Exploration Concession," Talisman Energy, Calgary, April 2001. Inside the cover is the report of Geoffrey John Oxlee, Kalagate Imagery Bureau, "Report KIB/035-1/2001, Subject: Sudan Oilfield Exploration Concession," April 2, 2001, pp. 6-7.
[1317] Indeed,
since Talisman started its activities in Sudan, the constitution was suspended,
a state of emergency declared in December 1999 that has lasted three several years
as of the writing of this report, opposition parties' leaders jailed on flimsy
charges, bombing of civilian targets in the war greatly increased, and the pace
of civilians displaced from the oilfields quickened. This is not visible on the
satellite images, however.
[1318] Talisman devised a costly public relations technique geared to the First World press, and paid for it. It is doubtful that the Sudanese government, the Chinese, or the Malaysians would have thought of this approach alone-much less paid for it.
[1319] Talisman press release, "Talisman to Sell Sudan Assets For C1.2 billion," Calgary, October 30, 2002, http://micro.newswire.ca/releases/October2002/30/c6739.htm (accessed October 30, 2002).
[1320] Ibid.
[1321] Ibid.
[1322] Ibid.
[1323] The consortium is described in Lundin Petroleum AB, Community Development and Humanitarian Assistance Program (CDHAP), Sudan, 2001-2004 (October 2001).
[1324] See above, "Numbers of Nuer and Dinka Desplaced from Oil Blocks in Western Upper Nile/Unity State." On October 15, 2002, the parties to the IGAD peace talks at Machakos, Kenya, agreed to a ceasefire. "Memorandum of Understanding between the Government of Sudan and the Sudan People's Liberation Movement/Army on Resumption of negotiations on Peace in Sudan," Nairobi, October 15, 2002.
[1325]Governing the Nuer, pp. 162-3 ("Nuer mythology traces a common ancestry for the sub-tribes the origin of which was a miraculous descent from Heaven at Kot (a Tamarind . . . tree) in the Jagey country of Western Nuer, some 300 to 350 years ago.").
[1326]See above, "Battle for Control over Block 5A, April-June 1999."
[1327] WFP press release, "150,000 Trapped by Renewed Fighting . . . ,"July 10, 1999.
[1328] Ibid.
[1329] After
estimating that its oil find might be up to 300 million barrels, Lundin stated,
"The rain [sic]y period
is just starting so Lundin Oil cannot investigate the current finding in detail
until the autumn of 1999." "Jackpot for Lundin Oil in Sudan," Finanstidningen
(Stockholm), May 21, 1999, abstracted from Finanstidningen in Swedish, BBC World
Reporter.
[1330] Lundin Oil (SE) press release, "Stable Production and Good Oilprices. Lundin Oil about to embark on heavy work programme for year 2000," published January 10, 2000.
[1331] Lundin press release, "Lundin Oil AB – Lundin subsidiary suspends Thar Jath testing," Canada Stockwatch (Vancouver), Geneva, February 22, 2000.
[1332] Ibid.
[1333] Ibid.
[1334] Lundin Oil (SE), "Report for the Financial Year ended 31 December 1999," Geneva, February 28, 2000.
[1335] Lundin Oil AB press release, "Further delay in Sudan. January Production Update," Geneva, March 21, 2000.
[1336] Lundin Oil (SE), "Report for the Nine Months ended 30 September 2000: Record Profit," Geneva, November 14, 2000.
[1337] John Noble, briefing, August 5, 2000.
[1338] See above, "Government-Armed Offensive Leaces Tens of Thousands of Civilians Uprooted, 2000."
[1339] Christine
Batruch, Lundin Oil AB, letter to Human Rights Watch, September 11, 2000, from
Geneva to Washington DCWashington, D.C.
This reply letter from Lundin was mistakenly faxed to the wrong address, and
was not resent or received by Human Rights Watch until on or about January 16,
2001.
[1340] Lundin Oil report, "Lundin Oil: Report for the Year Ended 31 December 2000," February 23, 2001.
[1341] Lundin Oil press release, "Lundin Oil Commences Testing on Thar Jath," Geneva, January 30, 2001.
[1342] Lundin Oil press release, "Lundin Oil: Lundin Strikes Oil in Sudan," Geneva, March 5, 2001.
[1343] Lundin Oil report, "Report for the Year Ended 31 December 2000."
[1344] Ibid.
[1345] Christian Aid, The Scorched Earth: Oil and war in Sudan, London, March 2001.
[1346] Ibid., p. 7.
[1347] Christian Aid press release, "Christian Aid calls on UN Special Envoy to resign," London, March 16, 2001.
[1348] Moussa Awuonda, "UN Envoy Under Scrutiny Over Links With Oil Firm," African Church Information Service (Nairobi), Stockholm, April 10, 2001. It noted that the intensity of media interest in this situation was unusual for Sweden.
[1349] Nicholas George and Frances Williams, "Bildt pressed on Sudan link," Financial Times (London), Geneva, March 19, 2001.
[1350] Lundin Oil press release, "Lundin Oil: Lundin Oil Welcomes Government Enquiry," Geneva, March 21, 2001.
[1351] "Lundin Oil's owners seek explanation," Dagens Nyheter (Stockholm), March 21, 2001, translated and abstracted from Swedish into English, BBC World Reporter.
[1352] Lundin Oil press release, "Lundin Oil Looks into Allegations on Sudan," Geneva, March 15, 2001.
[1353] Ibid.
[1354] Letter to Lundin shareholders, March 2001. The hasty Lundin investigatory trip to Block 5A occurred between March 16 and 31, 2001, at the outside.
[1355] Koblanck, "Lundin Oil's road/DN in Sudan," April 28, 2001; see above "A Journalist Travels the Oil Road, April 2001."
[1356] Letter to Lundin shareholders, March 2001.
[1357] Ibid.
[1358] In
September 1997 Rupnyagai was one of the first towns destroyed in the Paulino
Matiep/Riek Machar fighting-precisely because it was the location of a booming
market and also of the temporary homes of commanders.
[1359] Wangkei, also south of the river and accessible without a bridge, was a trading town on the river years ago, but has been a garrison town for a long time. There was little river traffic to Wangkei because of the war. Anonymous RASS relief worker, interview, August 1-2, 2000.
[1360] Lundin Oil AB press release, "Sudan: Lundin Oil refutes the allegations," Geneva, April 3, 2001.
[1361] Lundin Oil, "Report for the three months ended 31 March 2001," Stockholm, May 10, 2001.
[1362] Lundin
Oil
AB press release, "Sudan: Lundin Oil refutes the allegations," Geneva, April
3, 2001.
[1363] Ibid.
[1364] Ibid.
[1365] http://www.Lundinoil.com/eng/SudanPolicy.shtr (accessed March 7, 2001).
[1366] Letter to Lundin shareholders, March 2001.
[1367] Lundin Oil press release, "Lundin Oil Recommends Acceptance of Public Cash Offer from Talisman and Spins Off Key Exploration Assets into a New Swedish Oil Company," Stockholm, June 21, 2001; Drew Hasselback, "Lundins search for the big score, wherever that leads: Not giving up on Sudan," Financial Post (Toronto), Vancouver, June 22, 2001; Lily Nguyen, "Talisman snaps up oil firm," Globe and Mail (Toronto), Calgary, June 22, 2001; "Talisman bids $529 million for Sweden's Lundin Oil," Canadian Broadcasting Corporation, Calgary, June 21, 2001.
[1368] The Halaib Block was inactive because of a Sudan/Egypt border dispute. Lundin acquired this interest in 1991.
[1369] Lundin press release, "Lundin Petroleum Shares Start Trading Today," Stockholm, September 6, 2001.
[1370] "Sudan: Minister discusses oil investment with former Swedish prime minister," Sudan TV, Omdurman, in Arabic, Khartoum, July 15, 2001, as translated inBBC Monitoring Service, July 15, 2001; Lundin Oil press release, Stockholm, July 23, 2001.
[1371] Lundin Petroleum press release, "Lundin Petroleum comments on Latest Events," September 18, 2001. This release noted that the Sudanese government had reaffirmed its commitment to combat all forms of terrorism in the aftermath of the September 11 attacks in the U.S. Lundin Petroleum announced that its operations in Sudan would continue as planned. Ibid.
[1372] "Lundin Petroleum Announces A Rights Issue," Business Wire (Vancouver), Stockholm, October 2, 2001.
[1373] U.N. Security Situation Report, week 50/51/52, December 10-30, 2001, Khartoum.
[1374] Confidential email from journalist to Human Rights Watch, February 20, 2002; confidential email from relief worker to Human Rights Watch, February 13, 2002.
[1375] "Western Upper Nile Koch Peace Covenant," Upper Nile People to People Peace and Reconciliation Conference, January 26-February 1, 2002, Koch, Western Upper Nile, South Sudan.
The agreement was signed just weeks after the unity agreement between John Garang of the SPLM/A and Riek Machar of the SPDF.
[1376] Lundin press release, "Lundin Petroleum Announces a Temporary Suspension of Activities in Block 5A Sudan," Stockholm, January 22, 2002.
[1377] Ibid.
[1378] Ian H. Lundin, letter to Lundin Petroleum shareholders, "Report for the period ended 31 December 2001," Geneva, February 15, 2002, p. 1, http://www.Lundin-petroleum.com/Documents/qr_4_2001_e.pdf (accessed May 28, 2002).
[1379]Letter,
Ian H. Levin, letter to Lundin Petroleum
shareholders, "Report for the first three months, 1 January-31 March 2002," p.
1, http://www.Lundin-petroleum.com/Documents/qr_1_2002_e.pdf (accessed May 28,
2002).
[1380]Ian H.
Lundin, "Report for the period ended 31 December 2001," February
15, 2002, p. 1.
[1381] Lundin press release with letter to shareholders, C. Ashley Heppenstall, "Lundin: Report for the six months ended 30 June 2002," http://www.lundin-petroleum.com/Documents/pr_corp_08-08-02_e.html (accessed November 4, 2002).
[1382] Lundin statement, "Sudan Peace Process," dated July 24, 2002, http://www.lundin-petroleum.com/Documents/pr_sudan_24-07-02_e.html (accessed November 4, 2002).
[1383] Lundin Petroleum AB, "Community Development and Humanitarian Assistance Program (CDHAP) Sudan, 2001-2004," October 2001.
[1384] MSF, Violence, Health and Access to Aid, pp. 28-29.
[1385] "Depopulating Sudan's Oil Regions," p. 4.
[1386]Herbert J. Lloyd, Civilian Protection Monitoring Team (CPMT), "CPMT Final Report: Military Events in Western Upper Nile 31 December 2002 to 30 January 2003," February 6, 2003; Charles H. Baumann, CPMT, "Report of Investigation: Violence Against Civilians Along the Bentieu-Leer-Adok-Road," Khartoum, August 19, 2003, http://www.cpmtsudan.org/finalreports/violence.zip (accessed September 24, 2003).
[1387] Human Rights Watch, "Sudan: Global Trade, Local Impact, Arms Transfers to all Sides in the Civil War in Sudan," Vol. 10, No. 4 (a) (New York: Human Rights Watch, August 1998), pp. 28-29.
[1388] Ibid., p. 20.
[1389] The government of China did not respond to a letter from Human Rights Watch soliciting its comments on these allegations. Ibid., p. 29.
[1390] "China Finishes Sudan Oil Projects," AP, Beijing, July 14, 1999.
[1391] "CNPC Plans to Raise Investment Cash with Share Sale," Bloomberg (New York), Hong Kong, April 1, 1999; Xu Yihe, "China CNPC's Pursuit for Foreign Oil Fuels Competition," Dow Jones Energy Service (New York), Singapore, June 3, 1999.
[1392] "China Making Headway in Overseas Oil Market," Xinhua, Beijing, July 14, 1999.
[1393] Xu
Yihe, "China CNPC's Pursuit for Foreign Oil . . . Fuels
Competition," Dow Jones Energy Service (New York),
Singapore, June 3, 1999; See C. Raja Mohan, "China joins the Great
Game," Hindu (New Delhi), February 1, 1998.
[1394]Xu Yihe, "China CNPC's Pursuit for Foreign Oil . . .," June 3, 1999. According to the article, the aggressive foreign buying had slacked off in 1998 but resumed when Chinese crude supplies showed a marginal decline (average 1.8 percent domestic crude production for the 1990s) and domestic demand increased (average 5.4 percent a year for the 1990s).
[1395] "Arakis Forms Sudan Consortium," December 6, 1996.
[1396] "China Making Headway in Overseas Oil Market," July 15, 1999.
[1397] CNPC release, "China Extensively Enter into International Oil Market," January 11, 2001, http://www.CNPC.com.cn/english/news/index.html (accessed March 16, 2001).
[1398] "CNPC
is now [1999] operating in nine countries, including Sudan, Peru, Venezuela, Canada,
Thailand, Kuwait and Kazakhstan. . . . For China, Kazakhstan acts as a land
bridge to Iran and Iraq." Xu Yihe, "China CNPC's Pursuit for Foreign Oil . . . Fuels
Competition," Dow Jones Energy Service (New York),
Singapore, June 3, 1999.
[1399] "China Making Headway in Overseas Oil Market," July 15, 1999.
[1400] "China Completes Huge Oil Projects for Sudan," Xinhua, Beijing, July 24, 1999.
[1401] Ian Johnson, "China Takes Long View In Overseas Oil Projects," Wall Street Journal (New York), Beijing, December 16, 1999.
[1402] Ibid.
[1403] Paul Wilson, interview, May 16, 2001.
[1404] Ibid.; Anonymous, interview, 2001.
[1405]Ian Johnson, "China Takes Long View," December 16, 1999.
[1406] Paul
Wilson, interview, May 16, 2001. In 1998, one of the northern Sudanese workers
reportedly sexually abused a Nuer boy. The boy's family allegedly set up an
ambush to kill the man in revenge. He had to be smuggled out of the area to
save his life. Wilson, interview, May 16, 2001. Ibid.
[1407]Ian Johnson, "China Takes Long View," December 16, 1999.
[1408] "CNPC
Plans to Raise Investment Cash with Share Sale," Bloomberg (New York),
Hong Kong, April 1, 1999. The proposal was made in 1999 when crude prices rose
2.9 percent to U.S. $15.24, the highest since September
1998. For a comprehensive analysis of China's oil demands
and international expansion by CNPC, see: Rice
University, James A. Baker III Institute for Public Policy, "China and
Long-range Asia Energy Security: An Analysis of the Political, Economic and
Technological Factors Shaping Asian Energy Markets," Baker Institute Study
Number 11, April 1999,
http://riceinfo.rice.edu/projects/baker/publications/claes/executive_summary.html. Also see
http://www.csis.org/africa/index.htm (accessed October 30, 2002).
[1409] John Berlau, "Is China Stock a Security Risk?" Investor's Business Daily (Los Angeles), October 5, 1999.
[1410] Ibid.;
John Lebate and Stephen Fidler, "Sudan Ties Jeopardize Chinese Oil Listing," Financial
Times (London), reprinted in USA edition, Washington, DCWashington,
D.C., October 6, 1999.
[1411] "Is
China Stock a Security Risk?", October 5, 1999; William J. Casey Institute
press release, "Casey's Robinson
Testifies Before California Legislature on Prospect of Global 'Bad Actors'
Penetrating State Portfolios," William J. Casey Institute press releaseWashington,
D.C., January 14, 2000.
[1412] The
U.S. CIRF was created pursuant to U.S. legislation, the International Religious
Freedom Act of 1998, 22 U.S.C. 6410 et seq., passed in October 1998.
[1413]
"Federal Commission Urges President to Ban Foreign Investors on Sudan Oil
Pipeline from U.S. Stock Markets," PR Newswire, Washington, DCWashington,
D.C., November 1, 1999.
[1414] David B. Ottaway, "Chinese Fought on NYSE Listing," WashingtonPost, January 27, 2000.
[1415] See "CNPC To Drop Sudan Operations from IPO- report,"Reuters, Singapore, November 3, 1999.
[1416] "Investors Skeptical Over CNPC's Overseas . . . ," September 6, 1999.
[1417] Ibid.; "CNPC to drop Sudan operations from IPO," November 3, 1999.
[1418] Ibid.; "Investors Skeptical Over CNPC's Overseas . . .," September 6, 1999.
[1419] "China Finishes Sudan Oil Projects," July 14, 1999.
[1420] "Chinese Fought on NYSE Listing," January 27, 2000.
[1421]
Eduardo Lachica, "U.S. Religion Task Force to Scrutinize CNPC's Stock Offer for
Sudanese Ties," Wall Street Journal (New York), Washington, DCWashington,
D.C., December 22, 1999.
[1422] "PetroChina Head Rejects Criticism," AP, March 26, 2000.
[1423] Ibid.
[1424] John
Lebate and Stephen Fidler, "China Oil Group Prepares for $7 billion IPO,"
Financial Times (London), New York and Washington, DCWashington,
D.C., December 20, 1999.
[1425] U.S. President William J. Clinton, Executive Order 13067, "Blocking Sudanese Government Property and Prohibiting Transactions with Sudan," Washington, D.C., November 4, 1997, http://www.pub.whitehouse.gov/uri‑res/I2R?urn:pdi://oma.eop.gov.us/1997/11/5/2.text.2 (accessed February 24, 2000).
[1426] R.
Richard Newcomb, director, Office of Foreign Assets Control, Department of the
Treasury, letter to Sen. Russell D. Feingold, Washington DCWashington,
D.C., April 13, 2000.
[1427]
Eduardo Lachica, "U.S. Lawmakers Oppose Plans by China . . . Firm to
Launch IPO,"Wall Street Journal (New York),
Washington, DC, March, 2000.
[1428] "U.S. Religion Task Force to Scrutinize CNPC's Stock Offer," December 22, 1999.
[1429] "China
National Petroleum Delays IPO Road Show On NYSE Inquiries" The DowJones.com
Archives, January 25, 1999; see Ho Swee Lin, "CNPC: IPO Delayed by U.S.
Regulator," Financial Times(London), Hong Kong, February 3,
2000.
[1430]
Eduardo Lachica, "U.S. Lawmakers Oppose Plans by China . . . Firm to
Launch IPO,"Wall Street Journal (New York),
Washington, DC, March 1, 2000.
[1431] American Federation of Labor-Congress of Industrial Organizations is a voluntary federation of America's unions, representing more than 13 million working men and women nationwide. See http://www.aflcio.org/front/faqs.htm (accessed May 22, 2002).
[1432] John Burgess, "AFL-CIO Opposes Stock Sale by Chinese," Washington Post, March 10, 2000.
[1433] Eduardo Lachica, "AFL-CIO's Influence Erodes Interest in PetroChina's IPO," Wall Street Journal (New York), March 14, 2000.
[1434] Mark Landler, "Stakes in China Suddenly Seem Less Appealing," New York Times, March 31, 2000; John Burgess, "AFL-CIO's Influence Erodes Interest," March 14, 2000.
[1435] Ibid.
[1436] "PetroChina, BP Amoco Deal Protested," PR Newswire, April 3, 2000; Tom Doggett, "China Oil IPO Faces a Fight," Reuters, April 6, 2000.
[1437] John Berlau, "Chinese Oil Firm's Listing on NYSE Faces Fight Due to Terrorist Links," Investor's Business Daily (Los Angeles),March 10, 2000.
[1438] "PetroChina IPO Finishes Unchanged," AP, New York, April 6, 2000.
[1439] Chen Aizhu, "China CNPC see Sudan pillar for overseas ambition," Reuters, Singapore, June 18, 2001.
[1440] "China Jan-Jul Crude Imports 37M MT, dn 2.5 % - Official," Dow Jones International News Service, Singapore, August 23, 2001.
[1441] Mindy Belz, "Blood for oil," World on the Web, vol. 16, no. 9, March 20, 2001, distributed by the office of U.S. Rep. Frank R. Wolf, March 7, 2001, sourced to http://www.worldmag.com/world/issue/03-10-01/international_1.asp.
[1442] As of July 22, 2003, we know of no further investigation.
[1443] IMF Staff Country Report No. 02/245, November 2002, p. 38, fn. 22.
[1444] The World Bank has resumed its engagement in Sudan and is preparing a Country Economic Memorandum for Sudan. Its has assisted in research in Sudan in preparation for its full engagement at a later date, presumably when the arrears are paid off. The nonlending program provided assistance in the areas of irrigation and Nile Basin management services. The Bank approved a Post-Conflict Fund grant to support several analyses, including a survey on selected human resource indicators (a survey that could not be undertaken throughout Sudan, of course). This program was initiated after the government began repaying part of its arrears off in 1999 at a rate of U.S. $ 2 million a month, which it was forced to suspend because of lower than expected oil prices. Ibid., pp. 41, 57.
[1445]Petronas
press release, "Prime Minister Opens Petronas Office and Launches
Petronas Operations in Sudan," Media Releases, Khartoum, May 15,
1998.
[1446] Petronas press release, "Petronas' Subsidiary Awarded Oil Development Job in Sudan," October 18, 2000, http://safan.com/cgi-bin/petromin/news/viewnews.cgi?search (accessed November 21, 2000).
[1447] "Nation: Petronas To Ignore U.S. Sanctions: Dompok," Business Time (Kuala Lumpur, Malaysia), March 8, 2000.
[1448] "Sudanese Govt Invites Investment by Malaysian Cos," Asia Pulse via COMTEX, Kuala Lumpur, January 13, 1999.
[1449]
Petromin press release, "Sudan to attract Malaysia's oil and gas investments," posted
Tuesday, May 16, 2000,
http://safan.com/cgi-bin/petromin/news/viewnews.cgi?search (accessed November
21, 2000).
[1450] Mohd Fisol Jaafar, "Petronas contributing towards well-being of Sudan," Bernama, Khartoum, July 13, 2000.
[1451] Mohd Azhar Bin Osman Khairuddin, Senior General Manager, Legal & Corporate Affairs, Petroliam Nasional Berhad, Kuala Lampur, letter to Human Rights Watch, December 14, 2000.
[1452] Ibid.
[1453] Ibid.
[1454] Lundin press release, "Lundin Oil: Petronas, OMV, Sudapet and Lundin Oil are Granted Block 5B Onshore Sudan," May 3, 2001. The secretary general of Sudan's mining and energy ministry Hassan Mohamad Ali announced that Petronas was awarded at least a 40 percent stake in Block 5B. "Malaysian oil firm given stake in Sudan project: report," AFP, Kuala Lumpur, July 13, 2000.
[1455] West Bank Peace Council, Ganyliel, Western Upper Nile, 5th April to 7th April, 2001, resolutions.
[1456] OMV Aktiengesellschaft has revenues of US $ 4.593 trillion yearly, and is based in Vienna. It was the state-owned petroleum company until a process of privatization began in 1987. Now the state entity, Österreichische Industrieholding AG (ÖIAG), owns 35 percent and its next-largest shareholder is the International Petroleum Investing Co. (IPIC), based in Abu Dhabi, with 19.56 percent. See http://www.OMV.com/mainframe.html (English, Investor Relations, Stockholder Services, Stockholder Structure and Privatization, accessed July 11, 2001).
[1457] Ibid.
[1458] OMV press release, http://OMV.com/mainframe.html (accessed March 18, 2001), OMV did not list an office address in Sudan in correspondence with Human Rights Watch or on its website.
[1459] Ibid.
[1460] OMV's Guiding Principles, http://www.omv.com/smgr/portal/jsp/index.jsp?p_site=AT (accessed November 4, 2002).
[1461] Email, OMV Aktiengesellschaft, Bettina Gneisz, Kommunikation, to Human Rights Watch, April 6, 2001.
[1462] Louis Charbonneau, "OMV alarmed by claims of govt-led violence in Sudan," Reuters, Vienna, May 15, 2002.
[1463] Email, Philipp-Stephan Schneider, Sudan Plattform Austria, to Human Rights Watch, Vienna, October 9, 2002; see Sudan Plattform Austria, http://www.8ung.at/sudanplattformaustria (accessed November 5, 2002).
[1464] Louis Charbonneau, "OMV studying human rights situation in Sudan," Reuters, Vienna, July 11, 2002.
[1465] OMV announcement, http://www.omv.com/smgr/portal/jsp/index.jsp?BV_SessionID=@@@@0446117636.1063216490@@@@&BV_EngineID=ccceadcjehldeefcefecefgdhffdfgh.0&p_site=global (accessed September 10, 2003).
[1466] Total had been active in the fledgling Sudanese petroleum sector for several years. It signed one oil prospecting agreement (for the Red Sea area) in 1979 and another in 1980. "Sudan: French Oil Agreement," SUNA, in English, November 5, 1980, BBC, November 18, 1980; "Oil Prospecting Agreement with Total,", November 7, 1979, BBC, November 20, 1979.
[1467] "Total Fina Plans to Resume Oil, Gas Exploration In Sudan," Dow Jones Newswires, London, October 1, 1999.
[1468] Anonymous corporate source, June 2001.
[1469] "Sudan: Energy Minister Working Hard," Indian Ocean Newsletter (Paris), September 11, 1999. This followed a July 1999 trip abroad by John Dor, then deputy minister of energy and mining, who tried but failed to convince Western oil majors to take up new petroleum exploration permits in Sudan. Ibid.
[1470] "Total
Fina Plans to Resume Oil, Gas Exploration In Sudan," Dow Jones International News, London, October
1, 1999.
[1471] Ibid.
[1472] "French investment in Sudan to increase: ambassador," AFP, Khartoum, October 27, 1999.
[1473] "Shell
Seeks More Contracts to Purchase Oil," Omdurman Republic of Sudan Radio
Network, Omdurman, in Arabic, September 4, 1999, as translated in FBIS,,Washington,
D.C., September 7, 1999.
[1474] Ibid.
[1475] See Human Rights Watch, Civilian Devastation, p. 60.
[1476] See Human Rights Watch, Behind the Red Line.
[1477] "Sudan: Global Trade, Local Impact, Arms Transfers to all Sides in the Civil War in Sudan," p. 47.
[1478] "U.S. Eased Law on Terrorism To Aid Oil Firm," Washington Post, January 23, 1997.
[1479] Tom Raum, "CIA: 1998 Sudan Bombing Not Mistake," AP, October 19, 1999; Milt Bearden, "U.S. Should Admit Its Mistake in Sudan Bombing," Wall Street Journal (New York), May 20, 1999.
[1480] United Nations, "Final report of the Panel of Experts on the Illegal Exploitation of Natural Resources and Other Forms of Wealth of the Democratic Republic of the Congo," S/2002/1146, October 2002, http://www.monuc.org/downloads/N0262179.pdf (accessed August 21, 2003). "The Uganda People's Defence Forces and their associated rebel militias have been used as the de facto enforcement arm of the network [in northeastern Congo], ensuring the network's pre-eminent commercial position through intimidation, and the threat and use of force. UPDF or militias associated with individual UPDF officers have established physical control over areas containing commercially viable natural resources – coltan, diamonds, timber and gold." Ibid., p. 20.
[1481] U.S. State Department official, briefing, Washington, D.C., August 27, 2003.
[1482] U.S.
State Department official, meeting held by outgoing special envoy Harry
Johnston, Washington DCWashington, D.C.,
November 2000.
[1483] "UN End Sanctions Against Sudan," AP, New York, September 29, 2001.
[1484] Two U.S. CIRF commissioners were familiar faces from the Reagan era: Elliott Abrams, former assistant secretary of state for human rights and humanitarian affairs, who was found to have lied to the U.S. Congress during the Iran-Contra hearings about his solicitation of funds from the Sultan of Brunei for the benefit of the Nicaraguan contras, and Nina Shea, who had been a vocal Nicaraguan contra supporter while at the Puebla Institute. She had since written a book about persecuted Christians worldwide. Both were among the first commissioners on the U.S. CIRF. Elliott Abrams resigned from the U.S. CIRF in 2001 to take a high-level position at the National Security Council in the Bush administration, reportedly acting as liaison between the NSC and the White House on Sudan matters.
[1485] One month later a commission member criticized the State Department's first report on religious human rights in Sudan as inadequate because it was "unclear-even about the basic fact that religious persecution is at the core of the conflict." Testimony of Nina Shea before the House International Relations Committee et al., March 8, 2000. http://uscirf.gov/briefings/shea_030800.php3?scale=800 (accessed July 17, 2001).
[1486] http://uscirf.gov/reports/01May00/policy_Sudan.php3 (accessed June 15, 2001).
[1487] U.S. House of Representatives, "Condemning the National Islamic Front (NIF) government for its genocidal war in southern Sudan, support for terrorism, and continued human rights violations, and for other purposes," Concurrent Resolution, H. Con. Res. 75, 106th Cong., 1st sess, June 16, 1999.
[1488] Section 592(b) of the Fiscal Year 2000 Foreign Operations, Export Financing and Related Programs Appropriations Act.
[1489] Karen DeYoung, "Aid Groups Challenge U.S. Policy on Sudan," International Herald Tribune, January 6, 2000; Stephen Mbogo, "Stakeholders Lobby against New U.S. Strategy on Food Aid," All Africa News Agency, Nairobi, January 31, 2000. WFP also expressed concern that the U.S. plan would represent a threat to OLS and "disrupt an existing non-partisan aid programme." "WFP Worried about US Food Aid Project for Southern Sudanese Rebels," AFP, Geneva, November 30, 1999. See Human Rights Watch press release, "Food Aid to Sudanese Rebels Opposed," New York, December 13, 1999.
[1490] Nhial Deng Nhial, SPLM/A press release, "Statement on the MOU between the SRRA and the NGOs," Nairobi, March 1, 2000.
[1491] William J. Clinton, Text of a Letter from the President to the Chairman of the House and Senate Committees on Appropriations, February 10, 2000. p. 2.
[1492]
Testimony, Charles Jacobs, American Anti-Slavery Group, before the Senate
Foreign Relations Committee, Washington DCWashington, D.C.,
September 28, 2000.
[1493] "Senate majority leader went on his own for medical missions to Sudan, Kenya," AP, Washington, D.C., September 3, 2003.
[1494] Bill Sammon, "Christians, Jews say African slavery being ignored; U.S. black activists deny Farrakhan factor," Washington Times, February 27, 1998 (quoting Charles Jacobs, American Anti-Slavery Group, "Jesse Jackson's office told me he wouldn't touch it because it could be perceived as an anti-Arab campaign." Ibid.) "Black African" is not a term that southern Sudanese use to describe themselves, at least not before the AASG and others used it.
[1495]Linda
Slobodian, "The Slave Trail," http://www.canoe.ca/SlaveTrain/ (accessed March
26, 1998); see Christian Solidaritry International, "Slavery In Sudan: Evidence
to Congressional Sub-Committee Hearings, March 1996," testimony of Baroness
Cox, Washington
DCWashington, D.C., March 13, 1996;
Caroline Cox and John Eibner, "Christian Solidarity International: Visit to
Sudan, May 31-June 5, 1995," preliminary draft, Oxford, U.K., June 1995.
[1496] A joint statement the SCC and the NSCC issued in Geneva in July 1999 said, "The issue of slavery should be looked at in the context of the crisis in Sudan; When the crises in Sudan are brought to an end, slavery will also come to an end; Partners should support the efforts of the U.N. Commission on Human Rights to end slavery in Sudan; With all the good intentions in slave redemption, it does not end slavery."
[1497] Human Rights Watch, "Background Paper on Slavery and Slavery Redemption in the Sudan," March 1999, http://www.hrw.org/backgrounder/africa/sudan1.htm, and "Slavery and Slave Redemption in Sudan," March 2002, http://www.hrw.org/backgrounder/africa/sudanupdate.htm; and Human Rights Watch, Children of Sudan: Slaves, Street Children, Child Soldiers (New York: Human Rights Watch, 1995), http://www.hrw.org/reports/1995/Sudan.htm (all accessed May 22, 2002); AntiSlavery International (London), www.antislavery.org/ (accessed May 22, 2002);
[1498] See
Human Rights Watch, "Slavery and Slave Redemption in Sudan," March 2002.
[1499] The
U.S. had exempted gum arabic from its own sanctions on trade with Sudan. An
editorial in the Washington Post chastised the U.S. for "Soda Pop
Diplomacy," specifically: "it does seem fair to ask whether a nation that can't
accept the pulp settling on the bottom of the can of soda pop is totally,
utterly-and credibly-committed to the fight against` global
terrorism." "Soda Pop Diplomacy," editorial, Washington Post, November
8, 1997.
[1500] Steve Chase and Guy Dixon, "Silence is golden, PR experts tell Talisman," Globe and Mail (Toronto), Calgary and Toronto, November 20, 1999.
[1501]Nicola Luksic, "University of Toronto holds millions in controversial Talisman Energy," University of Toronto Varsity newspaper, December 9, 1999; Angela Pacienza, "York Money Immersed in Controversy: Faculty Urges University to Sell Talisman Stocks Linked to Civil War," York University Excalibur, December 1, 1999; Nancy Kuyumcu, "Stock Controversy Continues," York University Excalibur, January 19, 2000; Reka Szekely, "Sudan War Grips York Student," York University Excalibur, March 22, 2000.
[1502] Steven Chase, "Ontario teachers target Talisman," Globe and Mail (Toronto), Calgary, November 18, 1999.
[1503] Paul Waldie, "Teachers urged to dump Talisman," National Post (Toronto), November 18, 1999.
[1504]
Gary Kenny, KAIROS, email to Human Rights Watch, June 21, 2002. The Ontario
Teachers' Pension Plan Board website states, regarding corporate social
responsibility, that "non-financial considerations cannot take precedence over
risk and return considerations in the management of the pension fund. . . ."
The pension plan proxy voting guidelines then state that the pension plan
encourages companies to develop policies to address social policy issues
including environmental impact and impact on the communities of its operations;
which policies Talisman had not adopted with regard to Sudan. Ontario
Teachers' Pension Plan Board, Corporate Governance Policies and Voting Proxy
Guidelines, http://www.otpp.com/web/website.nsf/web/CorporateGovern/$FILE/ProxyVoting.pdf
(accessed June 24, 2002).
[1505] See, e.g., Com. John Busby, National Commander, The Salvation Army; Charles W. Colson, founder, Prison Fellowship Ministries; Nina Shea, director, Center for Religious Freedom, Freedom House; Rabbi Irving Greenberg, President, Jewish Life Network et al., letter to James Burton, Chief Executive Officer, California Public Employees Retirement System, January 24, 2000.
[1506] Leslie
Miller, "Group calls for stock boycott to prevent slavery," AP, Boston,
July 28, 1999.;American Anti-Slavery GroupAASG
press release, "New Jersey divests from 'slave stock,'" Boston, January 27,
2000,http://www.anti-slavery.org/pages/updates/njdivest.html
(accessed Aug. 27, 2003).
[1507] The Teacher Retirement System of Texas was established by the Texas state legislature. http://www.tsha.utexas.edu/handbook/online/articles/view/TT/met1.html.(accessed August 21, 2003).
[1508] These
numbers include only those Talisman shareholders that who liquidated
100 percent of their position after being targeted, and have publicly
acknowledged the liquidation.,The numbersand
thus understate the extent of the divestment campaign as a whole. Eric Reeves,
email to Human Rights Watch, May 18, 2001.
[1509] Steven Chase, "Talisman urged to threaten Sudan," Globe and Mail (Toronto), Calgary, October 13, 1999.
[1510] Ian Fisher, "Oil Flowing in Sudan, Raising the Stakes in Its Civil War," New York Times, Khartoum, October 17, 1999.
[1511] Business section, New York Post, September 16, 2000.
[1512] Charles Frank, "U.S. teacher fund sells Talisman shares," Calgary Herald, December 10, 1999.
[1513] "Activists Applaud TIAA-CREF's Talisman Share Sale," Dow Jones Energy Service (New York), Washington, December 8, 1999.
[1514] Paul Waldie, "[Ontario] Teachers urged to dump Talisman," National Post (Toronto), November 18, 1999; "Anti-Slavery Group Hails Texas Teachers for Divesting from 'Slave Stock,'" PRNewswire, November 1, 1999; Jane Lampman, "Battle against oppression abroad turns to Wall Street," Christian Science Monitor (Boston), March 3, 2000.
[1515] "New Jersey's Pension Funds Unload Stock in Canadian Oil Company," Star-Ledger/KRTBN (Newark), January 27, 2000.
[1516] Eric Reeves, email to Human Rights Watch, June 7, 2001 (quoting letter from Vanguard CEO to individuals who had been pressuring for divestment, first half of 2000).
[1517] Eric Reeves, Smith College press release, February 26, 2000.
[1518] "Silence is golden, PR experts tell Talisman," November 20, 1999.
[1519] Paul
Waldie and Charlie Tillis, "Talisman to embark on share buyback; Buckee admits
Sudanese operations have hurt stock price," National Post (Toronto),
December 15, 1999. Talisman bought back a total of 4,278,300 common
shares for a total Canadian $ 210.2 million (U.S. $ 142.5 million) (Canadian $
49.13 or U.S. $33.31 per share) in February 2000 at the time of their
repurchasing bid. Talisman also bought back, before year's end, 730,800 common
shares for Canadian $ 40.8 million (U.S. $ 27.7 million). The grand total for
2000 was 5,009,100 shares repurchased for Canadian. $ 251 million. Talisman
2000 Annual Report, p. 33.Talisman bought back a total
of 4,278,300 common shares for a total $210.2 million ($49.13 share) in Feb.
2000 at the time of their repurchasing bid and 730,800 common shares for
$40.8 million before year's end, for a total of
5,009,100 shares for $251 million. Talisman 2000 Annual Report, p. 33.
[1520]Talisman
press release, "Talisman Energy Inc. Normal Course Issuer Bid,"
Calgary, March 6, 2001."Talisman renews its normal
course issuer bid," Calgary, http://www.Talisman-energy.com/news/2001/Q1/02282001.html
(accessed June 6, 2001).
[1521] "Sudan's Bashir seeks better ties with U.S.," Reuters, Cairo, January 10, 2001.
[1522] Edward Alden, "US And Canada: SEC Chief Inherits Disclosure Bombshell: Capital Markets
Watchdog's Expanded Role May Cause Sea Change In The Way Foreign Companies List In US," Financial Times (London) Washington, May 11, 2001.
[1523] Among
the signatories were Bishop Robert Morgan, the President of the Council of
Bishops of the United Methodist Church; Clifton Kirkpatrick, the Stated Clerk
of the Presbyterian Church, U.S.A.; the Rt. Rev. Stephen Jecko and four other
bishops of the Episcopal Church (but not its conference of bishops); Peggy
Noonan, Chuck Colson, Michael Horowitz, at Hudson Institute; Freedom House Chairman
Bette Bao Lord; former U.S. Secretary of the Treasury William Simon; and former
U.S. National Security Advisor William P. Clark. Letter to President William
Jefferson Clinton, Washington DCWashington, D.C.,
December 9, 1999.
[1524] R.
Richard Newcomb, director, Office of Foreign Assets Control, Department of the
Treasury, letter to Sen. Russell D. Feingold, Washington DCWashington,
D.C., April 13, 2000.
[1525] See
above, "China's First Initial Public Offering on the N.Y. Stock Exchange
Backfires;" Letter and attachments from Laura S. Unger, acting chairman, SEC,
to the Honorable Frank P. Wolf, U.S. House of Representatives, Washington,
DCWashington, D.C., May 8, 2001,
http://www.security-policy.org/papers/2001/LSEC-Wolf.pdf (accessed June 7,
2001).
[1526] Ibid, p. 3.
[1527] See
Jane Lampman, "Human rights groups gain 'disclosure' victory on Wall Street," Christian
Science Monitor (Boston), May 17, 2001; Edward Alden and John Labate, "The
Americas: SEC plans to tighten rules on embargoes," Financial Times
(London), May 11, 2001; Barrie McKenna, "SEC policy change to put Talisman
under tighter scrutiny," Globe and Mail (Toronto), Washington, DCWashington,
D.C., May 15, 2001; Jim Wolf, "U.S. SEC to examine foreign firms'
deals with foes," Reuters, Washington, DCWashington, D.C.,
May 14, 2001.
[1528] Eric Reeves, "Capital market sanctions," email to Human Rights Watch, March 26, 2001.
[1529] The Sudan Peace Act, which sought to draw policy and appropriations on Sudan together into one bill, was first offered in 1999 and again in 2000. In June 2001 it passed the House of Representatives by a vote of 422 to 2, and was sent to the Senate. The capital market sanctions amendment was dropped and the bill passed the Senate and was signed into law by Pres. George W. Bush on October 21, 2002.
[1530] Steven Mufson, "House Bill on Sudan Troubles Bush," Washington Post, August 15, 2001.
[1531] "State
Department Has Reservations about Sudan Act," Reuters, Washington,
DCWashington, D.C., June 14, 2001.
[1532] Campion Walsh, "Bush Admin, Greenspan Oppose Tighter Sudan Sanctions," Dow Jones (New York), Washington, July 25, 2001.
[1533] E.g., "Malaysia slams US 'bullying' tactics against firms in Sudan," AFP, Kuala Lumpur, June 16, 2001.
[1534] Claudia Cattaneo, "US human rights legislation lessens pressure on Talisman," Financial Post (Toronto), June 14, 2001.
[1535] Marc Lacey, "The House Votes Strongly in Favor of Putting Pressure on Sudan," New York Times, June 14, 2001.
[1536] Talisman press release, "Talisman Energy Comments On Proposed US Legislation," Calgary, June 13, 2001.
[1537] James Stevenson, "Talisman says Sudan oil holdings not worth being banned in the U.S.," Canadian Press, Calgary, June 18, 2001
[1538] "Talisman can be replaced by other 'reputable' oil companies, says Sudan," Canadian Press, Calgary, June 26, 2001; Jeffrey Jones, "Sudan puts brave face on potential Talisman exit," Reuters, Calgary, June 26, 2001; Kamarul Yunus, "Petronas may benefit if Talisman pulls out from Sudan," News Straits Times (Kuala Lumpur), July 16, 2001.
[1539] Paul Basken, "U.S. Lawmarkers Seeking Sudan Sanctions Encounter China Obstacle," Bloomberg, Washington, January 17, 2002.
[1540] Talisman press release, "Talisman announces successful $ 325 million medium term note issue," Calgary, January 22, 2002. The press release specifically said that these securities have not been and will not be registered in the U.S.
[1541]Presbyterian
Church of Sudan vs. Talisman Energy Inc., Civ. Action No. 101CV9882
(AGS), S.D.N.Y., second amended complaint dated August 15, 2003,
http://www.bergermontague.com/pdfs/SecondAmendedClassActionComplaint.pdf
(accessed August 21, 2003).
[1542] Ibid.
[1543]Presbyterian Church of Sudan
vs. Talisman Energy Inc., Civ. Action No. 01CV9882
(AGS, S.D.N.Y., opinion on motion to dismiss dated March 19, 2003,
http://www.bergermontague.com/pdfs/talisman.pdf.pdf (accessed September 24,
2003).The Presbyterian
Church of Sudan vs. Talisman Energy Inc.,TO COME
[1544]
"Report of the United States Commission on International Religious Freedom," Washington,
DCWashington, D.C., May 1, 2001, p. 133
(concurrence with qualifications to recommendations 3 and 5 regarding Sudan).
[1545] The NDA is the umbrella opposition group of which the SPLA is by far the largest military force. Since the withdrawal of the Umma Party, the Democratic Unionist Party (DUP) is the biggest political party in the NDA.
[1546] William J. Clinton, Letter from the President to the Chairmen of the House and Senate Committees on Appropriations, February 10, 2000.
[1547] The U.S. $ 3 million funding, separate from the U.S. $ 10 million inserted into the 2001 appropriations bill, was initially approved during the Clinton administration. "Determination: Assistance to the National Democratic Alliance (NDA)," signed by Secretary of State Madeliene Albright, November 15, 2000.
[1548] "Report of the United States Commission on International Religious Freedom," Washington, D.C., May 1, 2001, p. 130.
[1549]
Coincidentally, an article appeared about DynCorp's work in Bosnia, where 161
of 1,832 U.N. police officers weare from the
United States, all selected and trained by DynCorp under an exclusive U.S. $ 15
million annual contract with the State Department: "American officials
acknowledge serious problems in selecting and training American police officers
to serve in Bosnia." Colum Lynch, "UN Police in Bosnia: Who's Watching?" Washington
Post U.N., New York, May 29, 2001. DynCorp is the leading U.S. government
contractor for anti-drug work in Colombia, Bolivia, and Peru. Nora Boustany and
Alan Sipress, "U.S. Slates $3 Million for Sudanese Opposition," Washington
Post, May 25, 2001.
[1550] "U.S. Slates $3 Million for Sudanese Opposition," May 25, 2001.
[1551] "Sudan slams US for supporting opposition," AFP, Khartoum, May 28, 2001 (quoting Colin Powell).
[1552] Jeff
Millington, director, East Africa, U.S. State Department, Washington, DCWashington,
D.C., June 11, 2001.
[1553] The
language from the report accompanying the Foreign Operations Appropriations
bill for FY 2001 was: "Provided further, That up to $10,000,000 of the funds
appropriated under this heading may be used, notwithstanding any other provision
of law, to provide assistance to the National
Democratic Alliance of Sudan to strengthen its ability to protect civilians
from attacks, slave raids, and aerial bombardment by the Sudanese Government
forces and its militia allies, and the provision of such funds shall be subject
to the regular notification procedures of the Committees on Appropriations:
Provided further, That in the previous proviso, the term 'assistance' includes
non-lethal, non-food aid such as blankets, medicine, fuel, mobile clinics,
water drilling equipment, communications equipment to notify civilians of
aerial bombardment, non-military vehicles, tents, and shoes."
[1554]Ibid., "Report
of the United States Commission on International Religious Freedom," Washington,
DCWashington, D.C., May 1, 2001, p. 130
(footnote omitted). The concurring U.S. CIRF commissioner noted that due to the
degree of documented human rights abuses by the SPLA, "actual compliance with
international norms (not simply "efforts") must be significant and sustained
before any aid would be considered. At this time, no such improvements have
been verified by either the U.S. government or credible non-governmental human
rights organizations in the region." Ibid., p. 133. The U.S. government is not
bound by these recommendations.
[1555]
DynCorp official, Human Rights Watch interview, Washington DCWashington,
D.C., May 7, 2002.
[1556] Ibid.
[1557]
Pauline Jelinek, "Sudan's 18-year civil war '`a
priority,'' Powell says," AP,
Washington
DCWashington, D.C., March 9, 2001.
[1558] Remarks by the President to the American Jewish Committee, National Building Museum, Washington, D.C., May 3, 2001, http://www.whitehouse.gov/news/releases/2001/05/20010504.html (accessed June 24, 2002).
[1559] The government at the time was showcasing several thousand needy displaced persons who fled north to Darfur when the SPLA captured Raga in western Bahr El Ghazal. It continued to ignore the much larger number of persons it had caused to be displaced from the oilfields of Western Upper Nile/Unity State, and to actively forbid humanitarian access to them.
[1560]
"President Appoints Danforth as Special Envoy to the Sudan." Remarks by the
President and Senator John Danforth on Danforth's Appointment as Special Envoy
to the Sudan, The Rose Garden, Washington, DCWashington, D.C.,
September 6, 2001,
http://www.whitehouse.gov/news/releases/2001/09/20010906-3.html (accessed June
24, 2002).
[1561] See Human Rights Watch backgrounder on the Danforth initiative, http://hrw.org/backgrounder/africa/danforth-bck0515.htm
[1562] Richard Boucher, Press Statement, "Aerial Attacks on Feeding Site in Sudan," U.S. Department of State, February 21, 2002, http://www.state.gov/r/pa/prs/ps/2002/8205.htm (accessed June 20, 2002).
[1563] "U.S. suspends talks with Sudan," February 21, 2002.
[1564] John C. Danforth, "Hope for peace? Gunship rockets blow up government promises," St. Louis Post-Dispatch, commentary column, February 24, 2002.
[1565] The language of the agreement was broadened from a prohibition on aerial bombardment of civilians to include all forms of attacks on civilians and civilian objects when it became clear that Khartoum would read the "no aerial bombardment" provision to permit it to conduct ground attacks on civilians. In addition, the government sought to include SPLA attacks in the agreement.
[1566] Indeed, the Washington-based Center for Strategic and International Studies (CSIS) graphically demonstrated to the parties in mid-2002, through expert oil industry advice in a Nairobi workshop attended by important representatives from both sides, how much more oil revenue could be expected in the event of peace. See http://www.csis.org/africa/index.htm (accessed October 30, 2002).
[1567] The
parties agreed to the Declaration of Principles (DOP) in 1994 and the
Sudanese government spent considerable effort backing away from it until the
Machakos Protocol was signed in Machakos, Kenya, on July 20, 2002.
In the DOP the parties affirmed the "rights of self-determination of the people
of South Sudan to determine their future status through a referendum" and
agreed that a "secular and democratic state must be established in the Sudan."
Declaration of Principles, articles 2 and 4, signed by representatives of the
government of Sudan and the SPLM/A, Nairobi, May 20, 1994. The Sudanese government
spent considerable effort backing away from it until the Machakos Protocol was
signed in Machakos, Kenya, on July 20, 2002.
[1568]The IGAD
Partners Forum members in 2001 are listed in a footnote above under "Neglect of
the Environment: Environmental Issues Regarding the Sudd and the Jonglei Canal."The IGAD
Partners Forum included the following: Norway, Italy, Belgium, Canada, Egypt,
Finland, France, Germany, Greece, Ireland, Japan, the Netherlands, Sweden,
Switzerland, the U.K., the U.S., the European Commission, the United Nations
Secretariat, the UNDP, the UNHCR, the WFP, and the Russian Federation as
observer attended the seventh meeting of the Committee on Sudan of the IGAD
Partners Forum in Rome on March 20, 2001.
[1569] The four sanctions are: 1) the U.S. will oppose any funding for Sudan from international financial institutions; 2) the U.S. will suspend diplomatic relations with Sudan; 3) the U.S. will take "all necessary and appropriate steps" to deny the Sudanese government access to oil revenues to ensure that it "neither directly nor indirectly utilizes any oil revenues for the purchase of military equipment;" and 4) the U.S. will seek a U.N. Security Council arms embargo against the Sudanese government. Sudan Peace Act, Public Law 107-245, 107th Congress, http://frwebgate.access.gpo.gov/cgi-bin…07_cong_public_laws&docid+f:publ245.107 (accessed November 18, 2002).
[1570] "Bush Signs and Commends Sudan Peace Act," Statement by the President, October 21, 2002; U.S. State Department Fact Sheet on the Sudan Peace Act, October 15, 2002. Text of bill, http://thomas.loc.gov/cgi-bin/query/D?c107:5:./temp/~c1072cIX1F
(accessed August 21, 2003).
[1571] ACP-E.U. Joint Parliamentary Assembly, "Report on the mission to the Sudan, 26 June – 2 July 2001," September 28, 2001, CR\446637EN.doc, APP/3221.
[1572] "Sudan Country Profile 2001" Economist Intelligence Unit, London, 2001, p. 13.
[1573]
ACP-E.U. Joint Parliamentary Assembly, "Report
on the mission to the Sudan, 26 June – 2 July 2001.,"
September
28, 2001.
[1574] Ibid.
[1575]ACP-E.U.
Joint Parliamentary Assembly, "Report on the mission to the Sudan, 26 June – 2
July 2001," September 28, 2001.Ibid. At the end
of the first phase the parties decided that the political dialogue would
continue with the discussion of the first three subjects, as there was no
terrorism problem and relations with neighbors had improved.
[1576] Ibid.
[1577] Ibid.
[1578]ACP-E.U. Joint Parliamentary Assembly, Resolution on the situation in Sudan, ACP-EU/3227/fin, adopted November 1, 2001, in Brussels, Belgium, http://www.europarl.eu.int/intcoop/acp/bru2001/pdf/res_004_en.pdf (accessed June 24, 2002).
[1579] E.U.-Sudan Joint Communiqué, Press Release: Khartoum (9/12/2001) - Press: 467 Nr: 15216/01, http://ue.eu.int/newsroom/newmain.asp?lang=1 (accessed June 24, 2002).
[1580] E.U.-Sudan Joint Communiqé, Press Release: Khartoum (9/12/2001) - Press: 467 Nr: 15216/01, http://ue.eu.int/newsroom/newmain.asp?lang=1 (accessed June 24, 2002).
[1581] Partnership Agreement between the African, Caribbean and Pacific Group of States (ACP), of the one part, and the European Community and its Members States, of the other part, signed in Cotonou, Benin, on 23 June 2000 (notification by Sudan, October 29, 2001); Official Journal of the European Communities, L. 317/ 8 EN, 15.12.2000, article 8 ("Political Dialogue").http://europa.eu.int/eur-lex/pri/en/oj/dat/2000/l_317/l_31720001215en00030286.pdf (accessed June 24, 2002).
[1582] European Commission, "EU-Sudan relations: EU prepares for the possible resumption of development assistance," January 31, 2002, MEMO02-001EN, http://europa-eu-un.org/article.asp?id=1117 (accessed June 20, 2002).
[1583] Declaration by the Presidency on behalf of the European Union on bombings of civilian targets in Sudan, press release 6773/02 (Presse 58-G), P 27/02, Brussels, Belgium, February 28, 2002.
[1584] "Depopulating Sudan's Oil Regions."
[1585]The Council of Ministers is responsible for defining and implementing the common foreign policy of the European Union.
[1586]
"General Affairs," 2437th Council meeting, Luxembourg, June 17,
2002, 9717/02 (Presse 178), "items approved without debate, p.
III-V, http://ue.eu.int/pressData/en/gena/71044.pdf
(accessed June 20, 2002).
[1587] Ralph-Joseph Taraf, counselor, German Foreign Ministry, Human Rights Watch interview, Bonn, Germany, May 13, 1999.
[1588] U.N. High Commissioner for Human Rights, "Commission on Human Rights adopts resolutions on situation of human rights in Nigeria, Lebanon, Iran, Iraq and Sudan," Geneva, HR/CN/99/55, April 23, 1999 ("Ibrahim Ibrahim (Sudan) said it noted with great appreciation that the draft resolution was the product of work between Germany on behalf of the European Union and Sudan."); "Situation of human rights in the Sudan," E/CN.4/RES/1999/15, April 23, 1999, http://www.unhchr.ch/Huridocda/Huridoca.nsf/(Symbol)/E.CN.4.RES.1999.15.En?Opendocument (accessed July 18, 2002).
[1589] U.N. Commission on Human Rights, 56th session, Resolution on the Situation of Human Rights in the Sudan, E/CN.4/RES/2000/27, April 18, 2000, http://www.unhchr.ch/Huridocda/Huridoca.nsf/(Symbol)/E.CN.4.RES.2000.27.En?Opendocument (accessed July 18, 2002).
[1590] U.N. Commission on Human Rights, "Situation of human rights in the Sudan, summary of the draft report of special rapporteur," Geneva, E/CN.4/2000/36, April 19, 2000, http://www.unhchr.ch/Huridocda/Huridoca.nsf/(Symbol)/E.CN.4.2000.36.En?Opendocument (accessed June 21, 2002).
[1591] U.N. Commission on Human Rights, 58th session, "Situation of human rights in the Sudan, Commission on Human Rights resolution 2000/27," E/CN.4/RES/2000/27, Geneva, April 18, 2002, http://www.unhchr.ch/Huridocda/Huridoca.nsf/(Symbol)/E.CN.4.RES.2000.27.En?Opendocument (accessed June 21, 2002).
[1592] Gerhart Baum, Special Rapporteur on the situation of human rights in the Sudan, oral statement at the U.N. Commission on Human Rights, 57th session, 19 March – 27 April 2001, http://www.unhchr.ch/huricane/huricane.nsf/NewsRoom?OpenFramsSet (accessed July 18, 2002).
[1593] Ibid.
[1594] Ibid.
[1595] U.N. Commission on Human Rights, 57th session, "Situation of human rights in the Sudan, Commission on Human Rights resolution 2001/18," Geneva, Operative Clause 2(a)(viii). E/CN.4/RES/2001/18, April 20, 2001, http://www.unhchr.ch/Huridocda/Huridoca.nsf/(Symbol)/E.CN.4.RES.2001.18.En?Opendocument (accessed June 20, 2002).
[1596] U.N. Commission on Human Rights, 57th session, "Situation of human rights in the Sudan, Commission on Human Rights resolution 2001/18," Geneva, E/CN.4/RES/2001/18, April 20, 2001, http://www.unhchr.ch/Huridocda/Huridoca.nsf/(Symbol)/E.CN.4.RES.2001.18.En?Opendocument (accessed June 20, 2002).
[1597] U.N. press release, Geneva, April 20, 2001.
[1598] Report of the special rapporteur, Gerhart Baum, to the U.N. Commission on Human Rights, 58th session, "Situation of human rights in the Sudan," E/CN.4/2002/46, January 23, 2002, Geneva, http://www.unhchr.ch/Huridocda/Huridoca.nsf/TestFrame/64639579934bf6dcc125669d002cfbcd?opendocument (June 20, 2002).
[1599] U.N. Commission on Human Rights, 58th session, "Situation of human rights in the Sudan," Geneva, E/CN.4/RES/2002/16, April 19, 2002, http://www.unhchr.ch/Huridocda/Huridoca.nsf/(Symbol)/E.CN.4.RES.2002.16.En?Opendocument, (accessed July 18, 2002), p. 3.
[1600] Ibid.: "adopted by a recorded vote of 25 votes to 24, with 4 abstentions."
[1601] "UN rights body narrowly adopts motion condemning Sudan," AFP, Geneva, April 19, 2002.
[1602] U.N. press release, "Commission On Human Rights Adopts Measures On Situations In North Korea, Turkmenistan, Myanmar; Member States Reject Draft Resolution on Situation in the Sudan," Geneva, April 16, 2003; U.N. Commission on Human Rights draft resolution E/CN.4/2003/L.35, on human rights in the Sudan, was rejected. http://www.unhchr.ch/html/menu2/2/59chr/voting16pm.htm (accessed August 14, 2003).
[1603] U.N. Consolidated Appeal 2001, p. 11
[1604]Human
Rights Watch, The Price of Oil: Corporate Responsibility and Human Rights
Violations in Nigeria's Oil Producing Communities (New York: Human Rights
Watch, 1999); Human Rights Watch, The Niger Delta: No Democratic Dividend,
(Human Rights Watch: New York, October 2002); Human Rights Watch Backgrounder,
"The International Monetary Fund's Staff Monitoring Program for Angola: The
Human Rights Implications," (New York: Human Rights Watch,
September, 2000), and Backgrounder, "The Oil Diagnostic in Angola: An Update,"
(New York: Human Rights Watch, March 2001), www.hrw.org/corporations.
[1605] U.N. Guiding Principles on Internal Displacement, Principle 29 (2), http://www.reliefweb.int/ocha_ol/pub/idp_gp/idp.html. Although non-binding, the Guiding Principles are based upon and reflect international humanitarian and human rights law, which are binding.
[1606] These data are a conservative estimate taken only from confirmed reports. The numbers of bombs, injuries and deaths exceeded that which is listed here.
[1607]A report of the bombing conducted in January, February, April, and May 2000 is not available.