Decades of Disparity
Drug Arrests and Race in the United States
Overview
New national drug arrest data illuminate the persistence and extent of racial disparities in the "war on drugs" in the United States. According to Human Rights Watch's analysis of arrest data obtained from the FBI:
- In every year from 1980 to 2007, blacks were arrested nationwide on drug charges at rates relative to population that were 2.8 to 5.5 times higher than white arrest rates.[1]
- State-by-state data from 2006 show that blacks were arrested for drug offenses at rates in individual states that were 2 to 11.3 times greater than the rate for whites.[2]
The data also shed light on the persistence and extent of arrests for drug possession rather than sales:
- In every year between 1980 and 2007, arrests for drug possession have constituted 64 percent or more of all drug arrests. From 1999 through 2007, 80 percent or more of all drug arrests were for possession.[3]
The higher rates of black drug arrests do not reflect higher rates of black drug offending. Indeed, as detailed in our May 2008 report, Targeting Blacks: Drug Law Enforcement and Race in the United States, blacks and whites engage in drug offenses-possession and sales-at roughly comparable rates. But because black drug offenders are the principal targets in the "war on drugs," the burden of drug arrests and incarceration falls disproportionately on black men and women, their families and neighborhoods. The human as well as social, economic and political toll is as incalculable as it is unjust.
Racial disparities in drug arrests reflect a history of complex political, criminal justice and socio-economic dynamics, each individually and cumulatively affected by racial concerns and tensions. Reducing the disparities is imperative, but should not be accomplished simply by increasing the rate of white drug arrests. A fresh and evidence-based rethinking of the drug war paradigm is needed. We urge local, state, and the federal governments to:
- restructure funding and resource allocation priorities to place more emphasis on substance abuse treatment and prevention outreach, and less on drug law enforcement;
- review and revise drug sentencing laws to increase the use of community-based sanctions for drug offenses and to eliminate mandatory minimum sentences for them;
- conduct comprehensive analyses of racial disparities in all phases of drug law enforcement to devise ways to ensure the enforcement of drug laws does not disproportionately burden black communities;
- assess the extent to which considerations of race may influence police decision-making, including decisions regarding the neighborhoods in which police are deployed for drug law enforcement purposes and whom to arrest, particularly for low level offenses such as simple drug possession; and
- monitor patterns in pedestrian and vehicle stops and other police activities to determine if unwarranted racial disparities exist that suggest racial profiling or other race-based decision-making and to take appropriate action to eliminate racially disparate treatment.
Methodology
The figures, tables, and charts presented in this report are based primarily on drug arrest data[4] Human Rights Watch obtained directly from the Federal Bureau of Investigation (FBI) Uniform Crime Reporting (UCR) Program, the most complete nationwide arrest and crime database available.[5] While UCR drug arrest data are available on the internet for each year beginning with 1995,[6] we obtained from the UCR Program data for the years 1980-2006, which permits us to show the trends in drug arrests from a period prior to the full onset of the war on drugs in the mid-1980s to the present. The UCR data Human Rights Watch obtained includes annual figures for total arrests as well as the distribution of adult drug arrests by race[7] and type of drug offense (sales/manufacturing or possession). The data for 2007 presented in this report are from the FBI's publication, "Crime in the United States, 2007," which is also based on UCR data.[8] Because national arrest data mask considerable variations among the individual states, Human Rights Watch also obtained from the UCR Program state-by-state data for 2006 (the most recent year for which such data were available at the time of the request) that provide for each state the number of adult drug arrests by race, broken down by type of offense.[9] Using the data obtained from the UCR Program and population estimates from the US Census Bureau, Human Rights Watch was able to compute national rates of arrest by race proportional to population and therefore the ratios of black to white drug arrests for the years 1980-2007.
As detailed below, the numbers show that stark racial disparities in drug arrest rates are an enduring feature of the US war on drugs.
US Drug Arrests, 1980-2007
Between 1980 and 2007, there were more than 25.4 million adult drug arrests in the United States.[10] The number of annual drug arrests increased almost every year, with the number of black arrests showing considerably more variation annually than white arrests, as shown in Table 1. During this period, the increase in the annual number of black arrests was greater than in the annual number of white arrests: black drug arrests were 4.8 times greater in 2007 than in 1980; white arrests were 3.2 times greater.
Overall, about one in three drug arrestees was black, although throughout this period blacks only constitutedabout 13 percent of the US population. The percentage of black arrestees among all drug arrestees increased from 27 percent in 1980 to a high ranging from 40 to 42 percent between 1989 and 1993, and then declined more or less steadily to the current percentage of 35 percent (Table 1).
Table 1: US Adult Drug Arrests by Race, 1980-2007 | |||||||
Year |
Total Arrests |
White |
Black |
Other Races** |
Percent White* |
Percent Black* |
Percent Other* |
1980 |
376,155 |
272,341 |
100,671 |
3,143 |
72% |
27% |
1% |
1981 |
448,255 |
322,250 |
122,076 |
3,929 |
72% |
27% |
1% |
1982 |
487,160 |
340,582 |
142,254 |
4,324 |
70% |
29% |
1% |
1983 |
543,259 |
366,911 |
171,144 |
5,204 |
68% |
32% |
1% |
1984 |
557,229 |
372,470 |
179,955 |
4,804 |
67% |
32% |
1% |
1985 |
640,626 |
427,579 |
206,830 |
6,217 |
67% |
32% |
1% |
1986 |
656,434 |
421,803 |
229,179 |
5,452 |
64% |
35% |
1% |
1987 |
733,908 |
463,213 |
264,958 |
5,737 |
63% |
36% |
1% |
1988 |
781,745 |
465,646 |
309,512 |
6,587 |
60% |
40% |
1% |
1989 |
981,381 |
567,163 |
408,853 |
5,365 |
58% |
42% |
1% |
1990 |
835,321 |
490,412 |
338,717 |
6,192 |
59% |
41% |
1% |
1991 |
735,294 |
422,166 |
306,932 |
6,196 |
57% |
42% |
1% |
1992 |
892,371 |
519,966 |
364,587 |
7,818 |
58% |
41% |
1% |
1993 |
901,860 |
530,237 |
363,582 |
8,041 |
59% |
40% |
1% |
1994 |
988,542 |
599,663 |
379,741 |
9,138 |
61% |
38% |
1% |
1995 |
1,073,480 |
642,540 |
420,731 |
10,209 |
60% |
39% |
1% |
1996 |
996,809 |
599,512 |
386,906 |
10,391 |
60% |
39% |
1% |
1997 |
1,078,745 |
645,277 |
421,348 |
12,120 |
60% |
39% |
1% |
1998 |
1,098,784 |
651,137 |
436,048 |
11,599 |
59% |
40% |
1% |
1999 |
1,068,525 |
645,288 |
411,400 |
11,837 |
60% |
39% |
1% |
2000 |
1,109,300 |
673,752 |
422,669 |
12,879 |
61% |
38% |
1% |
2001 |
1,107,140 |
674,323 |
419,781 |
13,036 |
61% |
38% |
1% |
2002 |
1,046,149 |
665,276 |
367,424 |
13,449 |
64% |
35% |
1% |
2003 |
1,239,337 |
811,574 |
410,533 |
17,230 |
65% |
33% |
1% |
2004 |
1,159,979 |
752,992 |
392,240 |
14,747 |
65% |
34% |
1% |
2005 |
1,235,355 |
795,726 |
423,440 |
16,189 |
64% |
34% |
1% |
2006 |
1,270,324 |
802,583 |
451,506 |
16,235 |
63% |
36% |
1% |
2007 |
1,382,783 |
880,742 |
485,054 |
16,987 |
64% |
35% |
1% |
*Due to rounding, totals may not equal 100 percent.
**The FBI classifies "other races" as American Indians, Alaskan Natives, Asians and Pacific Islanders.
As shown in Table 2 and reflected graphically in Figure 1, blacks have been arrested at consistently higher rates than whites, even as rates for both have gone up sharply. The national rate of drug arrests per 100,000 black adults has ranged from a low of 554 in 1980 to a high of 2,009 in 1989; the rate in 2007 was 1,721.[11] The rate of drug arrests per 100,000 white adults has ranged from a low of 190 in 1980 to a high of 476 in 2007. In 1981, the year with the lowest disparity between the two races, blacks were arrested at rates almost three (2.8) times the rate of whites. In the years with the worst disparities, between 1988 and 1993, blacks were arrested at rates more than five (between 5.1 and 5.5) times the rate of whites. From 2002 through 2007, the ratio of black to white drug arrest rates has ranged between 3.5 and 3.9. The more or less steady decline in the disparity since the early 1990s reflects several significant drops in annual black arrest rates as well as a white arrest rate that has been increasing at a slightly faster pace than the black arrest rate.
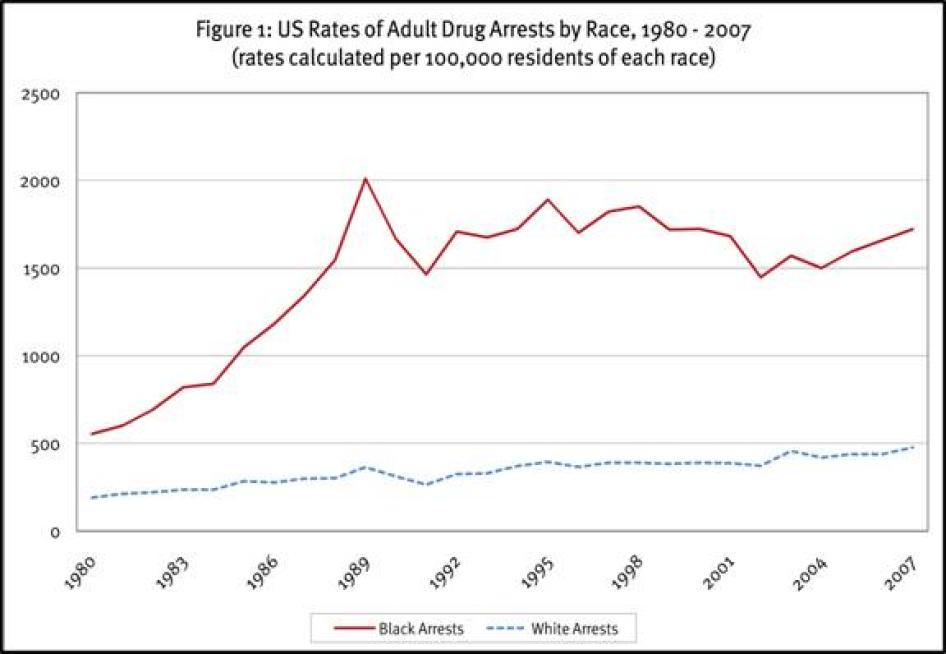
Table 2: US Rates of Adult Drug Arrests, 1980-2007
Rates calculated per 100,000 residents of each race
Year |
Black Rate |
White Rate |
Ratio of Black to White |
1980 |
554 |
190 |
2.9 |
1981 |
601 |
212 |
2.8 |
1982 |
691 |
220 |
3.1 |
1983 |
819 |
235 |
3.5 |
1984 |
840 |
236 |
3.6 |
1985 |
1,048 |
283 |
3.7 |
1986 |
1,182 |
277 |
4.3 |
1987 |
1,346 |
299 |
4.5 |
1988 |
1,547 |
301 |
5.1 |
1989 |
2,009 |
363 |
5.5 |
1990 |
1,666 |
311 |
5.4 |
1991 |
1,464 |
264 |
5.5 |
1992 |
1,707 |
325 |
5.3 |
1993 |
1,675 |
329 |
5.1 |
1994 |
1,723 |
370 |
4.7 |
1995 |
1,889 |
393 |
4.8 |
1996 |
1,700 |
364 |
4.7 |
1997 |
1,822 |
389 |
4.7 |
1998 |
1,851 |
389 |
4.8 |
1999 |
1,719 |
382 |
4.5 |
2000 |
1,722 |
389 |
4.4 |
2001 |
1,682 |
386 |
4.4 |
2002 |
1,448 |
371 |
3.9 |
2003 |
1,570 |
455 |
3.5 |
2004 |
1,500 |
418 |
3.6 |
2005 |
1,594 |
438 |
3.6 |
2006 |
1,658 |
437 |
3.8 |
2007 |
1,721 |
476 |
3.6 |
Drug Arrests by State, 2006
There is marked variation among the states in the racial breakdown of their drug arrests. Table 3 presents the number of black and white drug arrests in each state[12] and the percentage by race of the black and white arrests combined.[13]
Table 3: State Adult Drug Arrests by Race, 2006
State |
Black Drug Arrests |
White Drug Arrests |
Black Arrests as Percent of Total |
White Arrests as Percent of Total |
Alabama |
7,924 |
5,856 |
58% |
42% |
Alaska |
155 |
1,029 |
13% |
87% |
Arizona |
3,377 |
25,942 |
12% |
88% |
Arkansas |
4,410 |
7,855 |
36% |
64% |
California |
58,891 |
217,531 |
21% |
79% |
Colorado |
2,150 |
16,638 |
11% |
89% |
Connecticut |
4,603 |
8,916 |
34% |
66% |
Delaware |
2,734 |
2,220 |
55% |
45% |
District of Columbia |
n/a |
n/a |
n/a |
n/a |
Florida |
n/a |
n/a |
n/a |
n/a |
Georgia |
20,254 |
10,494 |
66% |
34% |
Hawaii |
127 |
928 |
12% |
88% |
Idaho |
101 |
4,539 |
2% |
98% |
Illinois |
45,999 |
11,820 |
80% |
20% |
Indiana |
4,985 |
12,519 |
28% |
72% |
Iowa |
1,719 |
6,335 |
21% |
79% |
Kansas |
1,400 |
4,583 |
23% |
77% |
Kentucky |
4,707 |
6,016 |
44% |
56% |
Louisiana |
12,534 |
9,420 |
57% |
43% |
Maine |
217 |
4,893 |
4% |
96% |
Maryland |
32,091 |
15,743 |
67% |
33% |
Massachusetts |
4,710 |
10,996 |
30% |
70% |
Michigan |
12,442 |
18,097 |
41% |
59% |
Minnesota |
4,885 |
9,734 |
33% |
67% |
Mississippi |
8,905 |
6,708 |
57% |
43% |
Missouri |
13,467 |
26,730 |
34% |
66% |
Montana |
25 |
1,253 |
2% |
98% |
Nebraska |
2,195 |
6,907 |
24% |
76% |
Nevada |
3,839 |
8,262 |
32% |
68% |
New Hampshire |
131 |
2,413 |
5% |
95% |
New Jersey |
22,510 |
24,772 |
48% |
52% |
New Mexico |
393 |
3,543 |
10% |
90% |
New York |
20,248 |
34,350 |
37% |
63% |
North Carolina |
16,159 |
15,027 |
52% |
48% |
North Dakota |
95 |
1,282 |
7% |
93% |
Ohio |
13,506 |
18,104 |
43% |
57% |
Oklahoma |
4,814 |
13,313 |
27% |
73% |
Oregon |
2,035 |
16,057 |
11% |
89% |
Pennsylvania |
22,201 |
27,081 |
45% |
55% |
Rhode Island |
839 |
2,590 |
24% |
76% |
South Carolina |
16,359 |
12,908 |
56% |
44% |
South Dakota |
79 |
910 |
8% |
92% |
Tennessee |
13,516 |
21,314 |
39% |
61% |
Texas |
37,752 |
82,739 |
31% |
69% |
Utah |
369 |
7,002 |
5% |
95% |
Vermont |
101 |
1,486 |
6% |
94% |
Virginia |
14,739 |
13,552 |
52% |
48% |
Washington |
4,356 |
19,999 |
18% |
82% |
West Virginia |
1,373 |
5,148 |
21% |
79% |
Wisconsin |
5,761 |
13,988 |
29% |
71% |
Wyoming |
81 |
2,467 |
3% |
97% |
Because the proportion of blacks and whites in state populations varies considerably, drug arrest rates for each race by state-set forth in Figure 2 and Table 4-present a more telling picture of the racial impact of drug law enforcement.[14] Although state rates of black and white drug arrests vary considerably, in every state the black rate of drug arrests per 100,000 black residents is considerably higher than the white rate per 100,000 white residents. Black rates of drug arrest range from a low of 428 in Hawaii to a high of 4,210 per 100,000 blacks in Illinois. In 20 states, the black rate of arrest is 2,000 or more per 100,000. White drug arrest rates range from a low of 169 to a high of 1,029 per 100,000 whites. The black-to-white ratio of drug arrest rates ranges from a low of two in Hawaii to a high of 11.3 in Minnesota and Iowa (Table 4). In nine states, blacks are arrested on drug charges at rates more than seven times the rate of whites.
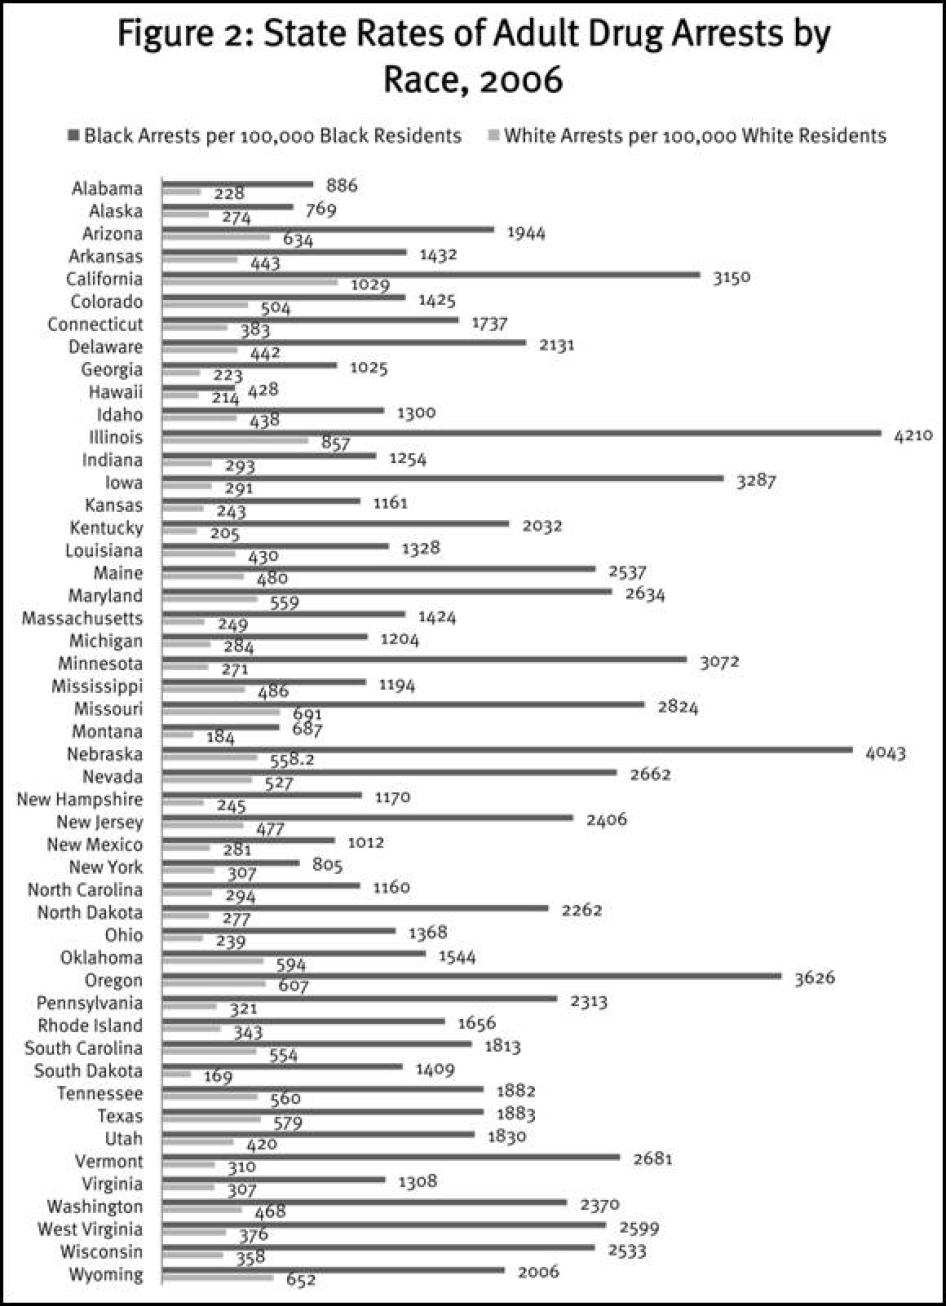
Table 4: State Rates of Adult Drug Arrests by Race, 2006
Rates calculated per 100,000 residents of each race
State |
Black Arrests |
White Arrests |
Ratio of Black to White Arrests |
Alabama |
886 |
228 |
3.9 |
Alaska |
769 |
274 |
2.8 |
Arizona |
1,944 |
634 |
3.1 |
Arkansas |
1,432 |
443 |
3.2 |
California |
3,150 |
1,029 |
3.1 |
Colorado |
1,425 |
504 |
2.8 |
Connecticut |
1,737 |
383 |
4.5 |
Delaware |
2,131 |
442 |
4.8 |
District of Columbia |
n/a |
n/a |
n/a |
Florida |
n/a |
n/a |
n/a |
Georgia |
1,025 |
223 |
4.6 |
Hawaii |
428 |
214 |
2.0 |
Idaho |
1,300 |
438 |
3 |
Illinois |
4,210 |
857 |
4.9 |
Indiana |
1,254 |
293 |
4.3 |
Iowa |
3,287 |
291 |
11.3 |
Kansas |
1,161 |
243 |
4.8 |
Kentucky |
2,032 |
205 |
9.9 |
Louisiana |
1,328 |
430 |
3.1 |
Maine |
2,537 |
480 |
5.3 |
Maryland |
2,634 |
559 |
4.7 |
Massachusetts |
1,424 |
249 |
5.7 |
Michigan |
1,204 |
284 |
4.2 |
Minnesota |
3,072 |
271 |
11.3 |
Mississippi |
1,194 |
486 |
2.5 |
Missouri |
2,824 |
691 |
4.1 |
Montana |
687 |
184 |
3.7 |
Nebraska |
4,043 |
558 |
7.2 |
Nevada |
2,662 |
527 |
5.1 |
New Hampshire |
1,170 |
245 |
4.8 |
New Jersey |
2,406 |
477 |
5 |
New Mexico |
1,012 |
281 |
3.6 |
New York |
805 |
307 |
2.6 |
North Carolina |
1,160 |
294 |
3.9 |
North Dakota |
2,262 |
277 |
8.2 |
Ohio |
1,368 |
239 |
5.7 |
Oklahoma |
1,544 |
594 |
2.6 |
Oregon |
3,626 |
607 |
6 |
Pennsylvania |
2,313 |
321 |
7.2 |
Rhode Island |
1,656 |
343 |
4.8 |
South Carolina |
1,813 |
554 |
3.3 |
South Dakota |
1,409 |
169 |
8.3 |
Tennessee |
1,882 |
560 |
3.4 |
Texas |
1,883 |
579 |
3.3 |
Utah |
1,830 |
420 |
4.4 |
Vermont |
2,681 |
310 |
8.6 |
Virginia |
1,308 |
307 |
4.3 |
Washington |
2,370 |
468 |
5.1 |
West Virginia |
2,599 |
376 |
6.9 |
Wisconsin |
2,533 |
358 |
7.1 |
Wyoming |
2,006 |
653 |
3.1 |
Possession versus Sales
Relatively few arrests made in the war on drugs involve drug importers, manufacturers, major dealers, or even small dealers. As shown in Table 5 and reflected graphically in Figure 3, from 1999 through 2007, 80 percent or more of all drug arrests were for possession rather than sales.[15] Between 1980 and the present, sales arrests have never represented more than 36 percent of all drug arrests. Indeed, the proportion of drug arrests for possession has been increasing.[16] It is worth noting that marijuana possession accounts for a large proportion of all drug arrests: in the years 2000 through 2007, marijuana possession arrests constituted between 37.7 percent and 42.1 percent of all drug arrests.[17]
Possession arrests account for the preponderance of black as well as white drug arrests. As shown in Table 6, 76 percent of black drug arrests and 85 percent of white drug arrests in 2006 were for possession. From the 2006 state by state data provided to us by the UCR Program we were able to calculate the proportion of black and white drug arrests that were for sales or possession. Among black drug arrestees, the proportion who were arrested for possession varied among the states from a low of 33 percent to a high of 96 percent. The percentage of white drug arrestees arrested for possession ranged from a low of 50 percent to a high of 93 percent.
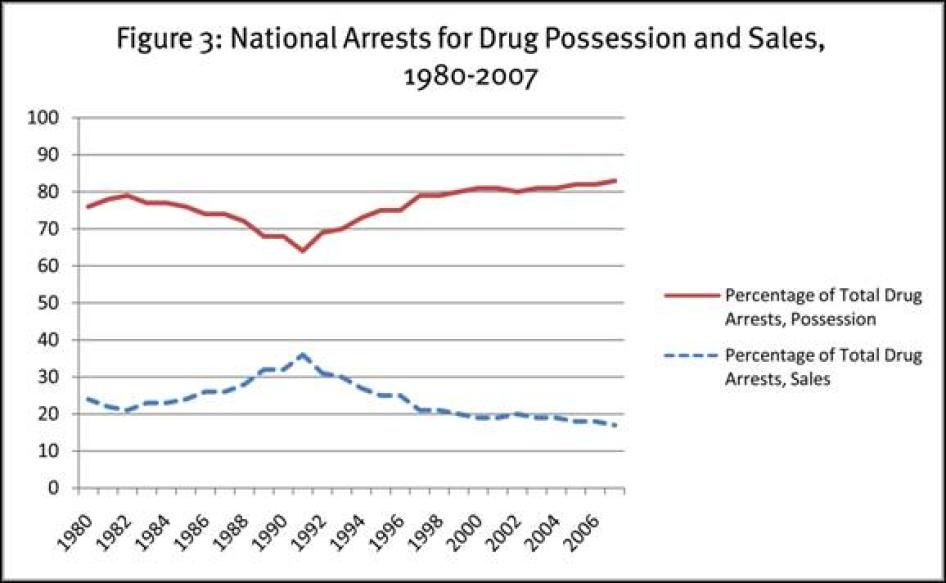
Table 5: US Arrests for Drug Possession and Sales, 1980-2007
Year |
Percent for Possession |
Percent for Sales |
1980 |
76% |
24% |
1981 |
78% |
22% |
1982 |
79% |
21% |
1983 |
77% |
23% |
1984 |
77% |
23% |
1985 |
76% |
24% |
1986 |
74% |
26% |
1987 |
74% |
26% |
1988 |
72% |
28% |
1989 |
68% |
32% |
1990 |
68% |
32% |
1991 |
64% |
36% |
1992 |
69% |
31% |
1993 |
70% |
30% |
1994 |
73% |
27% |
1995 |
75% |
25% |
1996 |
75% |
25% |
1997 |
79% |
21% |
1998 |
79% |
21% |
1999 |
80% |
20% |
2000 |
81% |
19% |
2001 |
81% |
19% |
2002 |
80% |
20% |
2003 |
81% |
19% |
2004 |
81% |
19% |
2005 |
82% |
18% |
2006 |
82% |
18% |
2007 |
83% |
17% |
Table 6: State Adult Drug Arrests by Offense and Race, 2006*
State |
Sales as Percent of White Drug Arrests |
Possession as Percent of White Drug Arrests |
Sales as Percent of Black Drug Arrests |
Possession as Percent of Black Drug Arrests |
Alabama |
7% |
93% |
6% |
94% |
Alaska |
30% |
70% |
44% |
56% |
Arizona |
13% |
87% |
16% |
84% |
Arkansas |
16% |
84% |
19% |
81% |
California |
13% |
87% |
25% |
75% |
Colorado |
11% |
89% |
56% |
44% |
Connecticut |
14% |
86% |
55% |
45% |
Delaware |
28% |
72% |
45% |
55% |
District of Columbia |
n/a |
n/a |
n/a |
n/a |
Florida |
n/a |
n/a |
n/a |
n/a |
Georgia |
23% |
77% |
22% |
78% |
Hawaii |
22% |
78% |
20% |
80% |
Idaho |
12% |
88% |
55% |
45% |
Illinois |
n/a |
n/a |
n/a |
n/a |
Indiana |
19% |
81% |
26% |
74% |
Iowa |
10% |
90% |
11% |
90% |
Kansas |
17% |
83% |
18% |
82% |
Kentucky |
11% |
89% |
20% |
80% |
Louisiana |
15% |
85% |
22% |
78% |
Maine |
21% |
79% |
42% |
58% |
Maryland |
15% |
85% |
27% |
73% |
Massachusetts |
25% |
75% |
44% |
56% |
Michigan |
18% |
82% |
29% |
71% |
Minnesota |
37% |
63% |
14% |
86% |
Mississippi |
9% |
91% |
14% |
86% |
Missouri |
12% |
88% |
17% |
83% |
Montana |
9% |
91% |
4% |
96% |
Nebraska |
10% |
90% |
14% |
86% |
Nevada |
20% |
80% |
25% |
75% |
New Hampshire |
22% |
78% |
34% |
66% |
New Jersey |
16% |
84% |
31% |
69% |
New Mexico |
50% |
50% |
67% |
33% |
New York |
8% |
92% |
15% |
85% |
North Carolina |
10% |
90% |
21% |
79% |
North Dakota |
19% |
81% |
34% |
66% |
Ohio |
10% |
90% |
15% |
85% |
Oklahoma |
14% |
86% |
19% |
81% |
Oregon |
8% |
92% |
12% |
88% |
Pennsylvania |
28% |
72% |
47% |
53% |
Rhode Island |
16% |
84% |
31% |
69% |
South Carolina |
14% |
86% |
27% |
74% |
South Dakota |
7% |
93% |
14% |
86% |
Tennessee |
23% |
78% |
32% |
68% |
Texas |
13% |
87% |
12% |
88% |
Utah |
12% |
88% |
13% |
87% |
Vermont |
15% |
85% |
32% |
68% |
Virginia |
17% |
83% |
26% |
74% |
Washington |
14% |
86% |
8% |
92% |
West Virginia |
18% |
82% |
32% |
68% |
Wisconsin |
16% |
84% |
33% |
68% |
Wyoming |
10% |
90% |
10% |
90% |
National |
15% |
85% |
25% |
76% |
*Due to rounding, some totals may not equal 100 percent.
Conclusion
The racial disparities in the rates of drug arrests culminate in dramatic racial disproportions among incarcerated drug offenders. At least two-thirds of drug arrests result in a criminal conviction.[18] Many convicted drug offenders are sentenced to incarceration: an estimated 67 percent of convicted felony drug defendants are sentenced to jail or prison.[19] The likelihood of incarceration increases if the defendant has a prior conviction.[20] Since blacks are more likely to be arrested than whites on drug charges, they are more likely to acquire the convictions that ultimately lead to higher rates of incarceration. Although the data in this backgrounder indicate that blacks represent about one-third of drug arrests, they constitute 46 percent of persons convicted of drug felonies in state courts.[21] Among black defendants convicted of drug offenses, 71 percent received sentences to incarceration in contrast to 63 percent of convicted white drug offenders.[22] Human Rights Watch's analysis of prison admission data for 2003 revealed that relative to population, blacks are 10.1 times more likely than whites to be sent to prison for drug offenses.[23]
Acknowledgments
This backgrounder was written by Jamie Fellner, senior counsel of the US Program at Human Rights Watch. Rachel Manning, an intern at Human Rights Watch, and Ashoka Mukpo, associate for the US Program, prepared the statistical tables and figures presented here based on data provided by the FBI's UCR Program and provided additional research support. Abigail Marshak, associate for the US Program assisted with the review of the data. Brian Root, consultant to Human Rights Watch, helped review the methodology and presentation of statistical information. Clive Baldwin, senior legal advisor, undertook the legal review. David Fathi, director of the US Program, and Joseph Saunders, deputy program director, provided additional editing. Grace Choi and Fitzroy Hepkins prepared the report for publication.
[1] See Table 2.
[2] See Table 4.
[3] See Table 5.
[4] Drug arrests are arrests for the unlawful cultivation, manufacture, distribution, sale, purchase, use, possession, transportation or importation of any controlled drug or narcotic substance. Federal Bureau of Investigation (FBI), "Uniform Crime Reporting Handbook," 2004, p. 142, http://www.fbi.gov/ucr/handbook/ucrhandbook04.pdf (accessed February 11, 2009). Arrest figures reflect each separate instance in which a person is arrested, cited, or summoned for an offense, rather than the number of individuals arrested.
[5] The FBI's Uniform Crime Reporting (UCR) Program receives, compiles and publishes crime and arrest data obtained from more than 17,000 voluntarily participating local, state and federal law enforcement agencies. In 2007, law enforcement agencies active in the UCR Program represented more than 285 million United States inhabitants-94.6 percent of the total population. FBI, "Crime in the United States, 2007: About the UCR Program," September 2008, ; FBI, "Uniform Crime Reporting Handbook." While the UCR Program data are the most comprehensive available, they do not capture all arrests in the United States each year. The number of participating agencies varies somewhat annually, and some agencies do not provide 12 months worth of arrest data. See footnote 9 for further description of specific limitations on the 2006 data for certain states. It is more than likely that limitations similar to those described in footnote 9 are reflected in the data for other years as well. Data from Florida are not included in the UCR Program data provided to us because Florida does not provide the UCR Program with information on arrests that identify, for each arrest, the age and race of the personarrested, the nature of the drug offense and the drug involved.
[6] UCR Program drug arrest data are included in the annual FBI publication, "Crime in the United States." See the FBI's website for the UCR Program, at http://www.fbi.gov/ucr/ucr.htm (accessed February 11, 2009). "Crime in the United States" does not include a breakdown for drug arrests by race according to the nature of offense (sales/manufacturing versus possession).
[7] The UCR Program gathers information on the race of arrestees, using four racial categories (white, black, American Indian or Alaskan Native, and Asian or Pacific Islander). It does not gather data on the ethnicity or national origin of arrestees, such as whether they are Hispanic. See information on racial designations in FBI, "Uniform Crime Reporting Handbook," p. 97. Hispanics/Latinos are included in the figures provided for white and black drug arrestees in this report, but their number or percentage cannot be determined.
[8] FBI, "Crime in the United States, 2007," September 2008, http://www.fbi.gov/ucr/cius2007/arrests/index.html (accessed February 11, 2009). "Crime in the United States" is available online for each year beginning in 1995. The online drug arrest data do not include a breakdown of kind of offense or narcotic involved.
[9] The state by state data provided for 2006 contain certain limitations which are reflected in the tables and figures presented in this report. Data for the District of Columbia for 2006 are not included in our charts and tables because the UCR Program received information on only a tiny fraction of DC drug arrests that year. The figures for arrests in Illinois in 2006 reflect arrests in Chicago and Rockford only; other law enforcement agencies did not provide arrest data to the UCR Program that year. The Illinois drug arrest data provided to us also did not include a breakdown by nature of offense. In addition, we discovered that the total number of drug arrests reported by the UCR Program for Colorado, Connecticut, and Idaho in 2006 was less than the combined number of possession and sales arrests reported for each of those states (in all other states, the total number of drug arrests equaled thecombined number of possession and sales arrests). We combined possession and sales offenses for the arrest totals for those three states in Tables 3 and 4 and in Chart 2. Colorado reported 3,000 white drug arrests in 2006 to the UCR Program that were not classified by the nature of the offense (possession or sales). The percentages reflected in Table 6 were calculated on the basis of the 13,638 white arrests for which the nature of the offense was reported.
[10] The total number of arrests, 25,426,250 reported by the UCR Program, is less than the actual number of adult arrests. As noted above in footnote 5, the UCR Program's arrest data reflect only arrests reported to it by participating law enforcement agencies. Some agencies do not participate and some do not provide complete arrest data.
[11] Rates of arrest calculated using US Census Bureau estimated population data for each year.
[12] See explanation on limitations of data in footnotes 5 and 9.
[13] The very small numbers of arrests of other races are not included.
[14] Rates of arrest calculated using estimated state population data published by the US Census Bureau.
[15] Sales arrests refer to arrests for manufacturing, sales, importation and other drug distribution activities. Possession of drugs with intent to sell is usually considered a trafficking or sales offense as it is closely involved with distribution. The UCR Program does notspecify, however, and therefore we do not know, whether some agencies counted possession with intent arrests as possession arrests.
[16] The growing proportion of possession arrests in great part reflects the growing proportion of marijuana possession arrests. Ryan S. King and Marc Mauer, The Sentencing Project, "The War on Marijuana: The Transformation of the War on Drugs in the 1990s," May 2005, http://www.drugpolicy.org/docUploads/nymmj_waronmj.pdf (accessed January 12, 2009).
[17] See the arrest tables for drug violations included in the annual FBI "Crime in the United States" reports. The tables include statistics by region, which can vary considerably. For example, while marijuana possession arrests accounted for 42.1 percent of all drug arrests in 2007, in the Midwest, they accounted for 53.1 percent and in the West, they accounted for 29.6 percent. FBI, "Crime in the United States, 2007."
[18] Bureau of Justice Statistics (BJS), "Felony Defendants in Large Urban Counties, 2004," Statistical Tables, Table 19, http://www.ojp.usdoj.gov/bjs/pub/html/fdluc/2004/tables/fdluc04st19.htm (accessed December 2, 2008) (67 percent of drug arrests result in conviction); BJS, "Felony Sentences in State Courts, 2004," Statistical Tables, Table 1.8, http://www.ojp.gov/bjs/pub/html/scscf04/tables/scs04108tab.htm (accessed December 2, 2008) (71 felony convictions per 100 drug arrests).
[19] BJS, "Felony Defendents," Statistical Tables, Table 25, http://www.ojp.gov/bjs/pub/html/fdluc/2004/tables/fdluc04st25.htm (accessed December 2, 2008). Even absent a sentence to incarceration, felony convictions carry a host of adverse collateral consequences, including reduced access to housing, public assistance, and loans for higher education, as well as adverse impacts on employment since criminal records are easily obtained during background checks. Human Rights Watch, United States -No Second Chance: People with Criminal Records Denied Access to Public Housing, November 17, 2004, http://www.hrw.org/en/reports/2004/11/17/no-second-chance; Legal Action Center, "After Prison: Roadblocks to Re-entry," 2004, http://lac.org/roadblocks-to-reentry/upload/lacreport/LAC_PrintReport.pdf (accessed December 2, 2008). Felony drug convictions for non-citizens frequently lead to deportation. Human Rights Watch, Forced Apart: Families Separated and Immigrants Harmed by United States Deportation Policy, July 2007, http://www.hrw.org/en/reports/2007/07/16/forced-apart-0.
[20] For example, 42 percent of convicted drug offenders who had more than one prior felony conviction were sentenced to prison compared to 16 percent of those with no prior conviction. BJS, "Felony Defendants," Statistical Tables, Table 30, http://www.ojp.usdoj.gov/bjs/pub/html/fdluc/2004/tables/fdluc04st30.htm (accessed December 2, 2008).
[21] BJS, "Felony Sentences in State Courts, 2004," Statistical Tables, Table 2.1, http://www.ojp.gov/bjs/pub/html/scscf04/tables/scs04201tab.htm (accessed December 2, 2008).
[22] BJS, "Felony Sentences," Table 2.5, http://www.ojp.gov/bjs/pub/html/scscf04/tables/scs04205tab.htm (accessed December 2, 2008).
[23] In 2003, in the 34 states under analysis, the rate of prison admission on drug charges for blacks was 256.2 per 100,000 black adult residents. For whites, the rate was 25.3 per 100,000 white adults. Between 1986 and 2003, the rate of prison admission for blacks on drug charges quintupled; the white rate did not quite triple. Human Rights Watch, Targeting Blacks: Drug Law Enforcement and Race in the United States, May 2008, p. 16, http://www.hrw.org/en/reports/2008/05/04/targeting-blacks-0.