Summary
New York City police arrest more people for possessing small amounts of marijuana in public view than for any other offense. Between 1996 and 2011, police made more than half-a-million (586,320) arrests for this misdemeanor, including a total of around 100,000 in just the 2 years of 2010 and 2011. Most arrests for plain-view marijuana possession occur in poor, predominantly minority neighborhoods. Arrestees are overwhelmingly black and Hispanic.
Neither New York City police nor Mayor Michael Bloomberg has ever provided a detailed justification for the high numbers of marijuana arrests, suggesting only that the arrests improve public safety. While the public safety benefits of many kinds of arrests are readily apparent, e.g. arrests of homicide suspects, the gains from arrests for possession of small amounts of marijuana are less easy to discern. A more complete justification is warranted not only because the arrests disproportionately affect black and Hispanic city residents, but also because the sheer number of marijuana possession arrests consumes many scarce and expensive law enforcement and judicial resources.
When the police arrest someone for misdemeanor marijuana possession, they enter fingerprints and other identifying information into criminal databases. Capturing this information might help police solve future serious crimes committed by the arrestees. Our data, however, indicates the police sweep large numbers of people into New York City’s criminal justice system—particularly young people of color—who do not subsequently engage in violent crime.
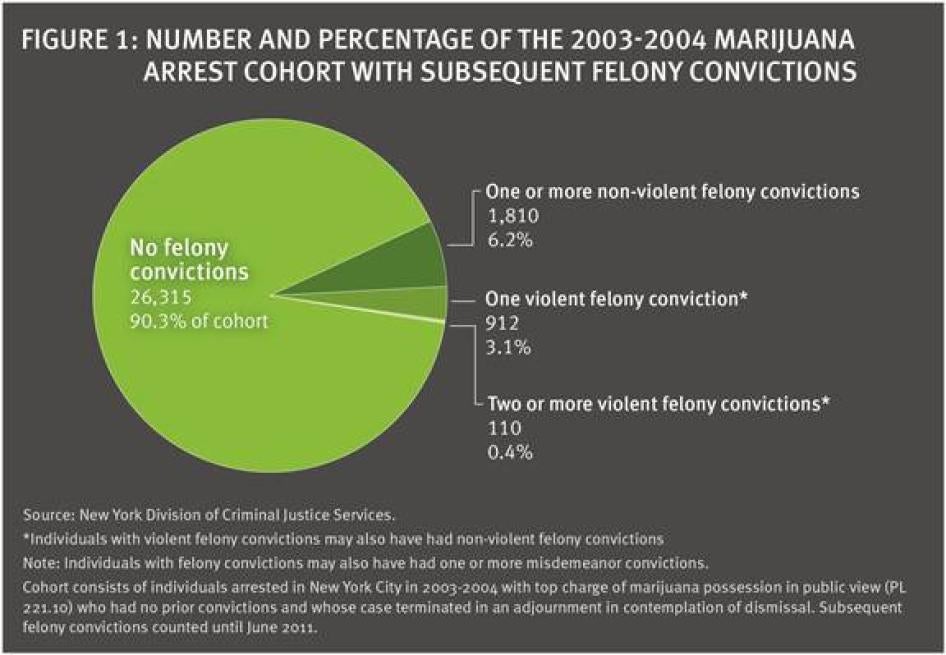
We tracked through mid-2011 the criminal records of nearly 30,000 people without prior criminal convictions who were arrested in 2003 and 2004 for marijuana possession. As shown in the figure below, we found that 3.1 percent of them were subsequently convicted of one violent felony offense during the six-and-a-half to eight-and-a-half years that our research covers; 0.4 percent had two or more violent felony convictions.[1] That is, 1,022 persons out of the nearly 30,000 we tracked had subsequent violent felony convictions. Ninety percent (26,315) had no subsequent felony convictions of any kind.
Curtailing crime—particularly violent or dangerous crime—is a legitimate and important public goal. But law enforcement efforts to enhance public safety by identifying those who engage in crime and holding them accountable through criminal prosecution, must be pursued through tactics that comply with human rights requirements. Respect for human rights requires that policing policy be grounded on objective evidence and criteria that are neither discriminatory nor arbitrary, and should not be unjustifiably restrictive or negatively impact rights in comparison to other policy options.
Allegations that police conduct marijuana possession arrests in an unlawful and arbitrary manner—without reasonable grounds to stop and frisk those they later arrest, and that they disproportionately arrest blacks and Hispanics for marijuana possession and other low-level crimes — are not only the subject of much controversy and litigation, but they also raise serious human rights concerns. Racial disparities in marijuana arrests do not automatically mean the police have engaged in racial discrimination that is prohibited under international human rights law. Unwarranted racial disparities, however, may constitute such discrimination even in the absence of racist intent. Human rights based concerns are thus heightened by the failure of the police to offer a detailed rationale for the marijuana policing policy, the objective criteria on which the arrests are based, and empirical evidence that they contribute to public safety.
An explanation is also warranted because the costs—both financial and social—of the marijuana arrests are substantial. Precious law enforcement resources are expended making, processing, and booking tens of thousands of marijuana possession arrests each year. Goodwill toward law enforcement may be eroded when substantial numbers of community residents are arrested or witness friends and relatives arrested for marijuana possession, especially when they believe the police had no basis for approaching them in the first place. This goodwill is especially important in high crime neighborhoods where relationships with community members are often vital for solving or preventing serious crimes and for gathering information to deal with persistent crime.[2]
Overworked prosecutors with more serious offenses in their caseloads demanding attention, equally overburdened public defenders charged with providing adequate defense to every accused person, and criminal court personnel (including judges, clerks, and court officers), all suffer under dockets swollen from the marijuana arrests along with the more than 200,000 other misdemeanor cases that flow through the city’s courts each year.[3]
Marijuana arrests also have significant implications for the tens of thousands of New York City residents who endure the discomfort and humiliation of being handcuffed, booked and searched, spending one or two days in police holding cells and central bookings, going through arraignment, and perhaps even being required to endure pretrial detention.[4] As Manhattan District Attorney Cyrus Vance has stated, referring to people arrested for criminal possession of marijuana in public view, “The human cost to each one of these people and their families is serious and it is real.”[5]
Those who are convicted of marijuana possession also face the prospect of limited opportunities for employment, access to public housing, and other benefits, in addition to threatened child custody and immigration status. Indeed, people arrested for marijuana possession may suffer even if they are never convicted or if they have their cases dismissed because prospective employers, schools, and housing authorities often ask individuals about arrests. [6] As Assemblymember Hakeem Jeffries has said, “For years, thousands of New Yorkers, who are disproportionately Black and Latino youth, have been charged with unnecessary misdemeanors, thereby creating barriers for future employment … [and] permanent damage on their records.” [7]
In June 2012, New York Governor Andrew Cuomo introduced legislation to make possession of marijuana in public view a non-arrestable, non-criminal violation, like a parking ticket (smoking marijuana in public would remain a misdemeanor).[8] Although there was considerable support for the legislative effort, conservative opposition killed it. Significantly, however, Mayor Michael Bloomberg, the five district attorneys for New York City, and even the New York City police commissioner all supported the legislation.[9]Manhattan District Attorney Cyrus Vance said the “new law will allow us to redirect resources away from processing people charged with simple low-level possession of marijuana, and use those valuable resources to fight violent crime to make all our communities safer, and thereby enhance public safety.”[10] Brooklyn District Attorney Charles Hynes said that the Cuomo proposal would “lead to a more efficient use of law enforcement resources.”[11] This support for classifying possession of marijuana in public view as a non-criminal violation heightens the need for an explanation from New York City officials for how ongoing marijuana possession misdemeanor arrests contribute to public safety.
Recommendations
To New York City Elected and Law Enforcement Officials
- Provide publicly the explanation for and
supporting factual evidence establishing the oft-asserted causal connection
between large numbers of arrests for marijuana possession and increased public
safety and crime control.
- If the goal of the arrests is to reduce violent crime, explain how marijuana possession arrests are tailored to do so and provide empirical evidence that massive marijuana arrests do, in fact, promote this goal.
- If the arrests are to further other public safety objectives, identify the objectives, explain how marijuana possession arrests are tailored to serve them, and provide empirical evidence that they in fact do so.
- Ensure that marijuana arrest policies and practices conform to basic human rights and constitutional law requirements regarding the right to liberty—which is violated by unlawful or arbitrary arrests—and the right to be free of racial discrimination which, under international human rights law, can be violated even without racist intent on the part of police or public officials.
Research Design
Our study utilized micro-level criminal record data obtained from the New York State Division of Criminal Justice Services (DCJS).[12] We sought to identify individuals whose initial contact with the criminal justice system (as best as can be determined reliably from state administrative data, see Methodological Appendix) was for possessing marijuana in a public place and the marijuana was being smoked or was open to public view, a misdemeanor under New York penal law.[13]
To ensure a sufficient number of years to track any subsequent criminal history, we gathered information on people who were arrested in New York City for marijuana possession anytime during 2003 or 2004. The research period continued through mid-2011. A 6.5 to 8.5-year period of study greatly exceeds the 3-year period used for most recidivism studies.
In order to be able to limit the study to persons who were not already “in the system” for prior criminal convictions at the time of the marijuana arrest, we focused on those whose marijuana arrest terminated in “adjournment in contemplation of dismissal in cases involving marihuana,” a type of conditional dismissal established under New York law (hereafter referred to in this paper as MJACD).[14]
The MJACD is typically given to persons new to the criminal justice system.[15] Individuals charged with marijuana crimes are eligible for a MJACD if they have not previously been granted one, if they have not previously been convicted of any controlled substance offenses, or upon the district attorney’s consent if they have previously been convicted of a crime.[16] Most people who receive a MJACD for marijuana possession have thus not shown a prior willingness or propensity to engage in crime. Tracking their later criminal justice involvement allowed us to see if marijuana arrests allowed police to identify people likely to engage in more serious offenses down the road.
The MJACD was also appropriate for our research because it is the most common disposition from a marijuana arrest. In 2003 and 2004, 59 and 60 percent, respectively, of all arrests where the top charge was misdemeanor marijuana possession (New York Penal Law § 221.10) terminated in a marijuana adjournment in contemplation of dismissal.[17] This disposition group therefore not only gave us a sizable number of individuals to track, but also represents a substantial portion of people arrested in a given year for misdemeanor marijuana possession.
People who receive a MJACD have their cases dismissed and sealed if they stay out of trouble for a year; after the adjournment period, the marijuana arrest and conditional disposition will no longer print on the “rap” sheet.[18] However, the New York State Division of Criminal Justice Services retains the fingerprints of and an identification number associated with each person who has received an MJACD.[19] We were therefore able to reliably track all later New York State arrests and convictions for the group under study.[20]
We ended up with 29,147 individuals arrested solely for marijuana possession in public view in 2003 and 2004, who had no prior criminal convictions at the time of arrest, and whose cases terminated in marijuana adjournments in contemplation of dismissal. (In this report we will refer to these individuals collectively as the MJACD cohort or the group under study.) We then constructed the criminal justice trajectories of each individual in this cohort until June 2011 (the most recent administrative records from the date when the DCJS provided data). [21]
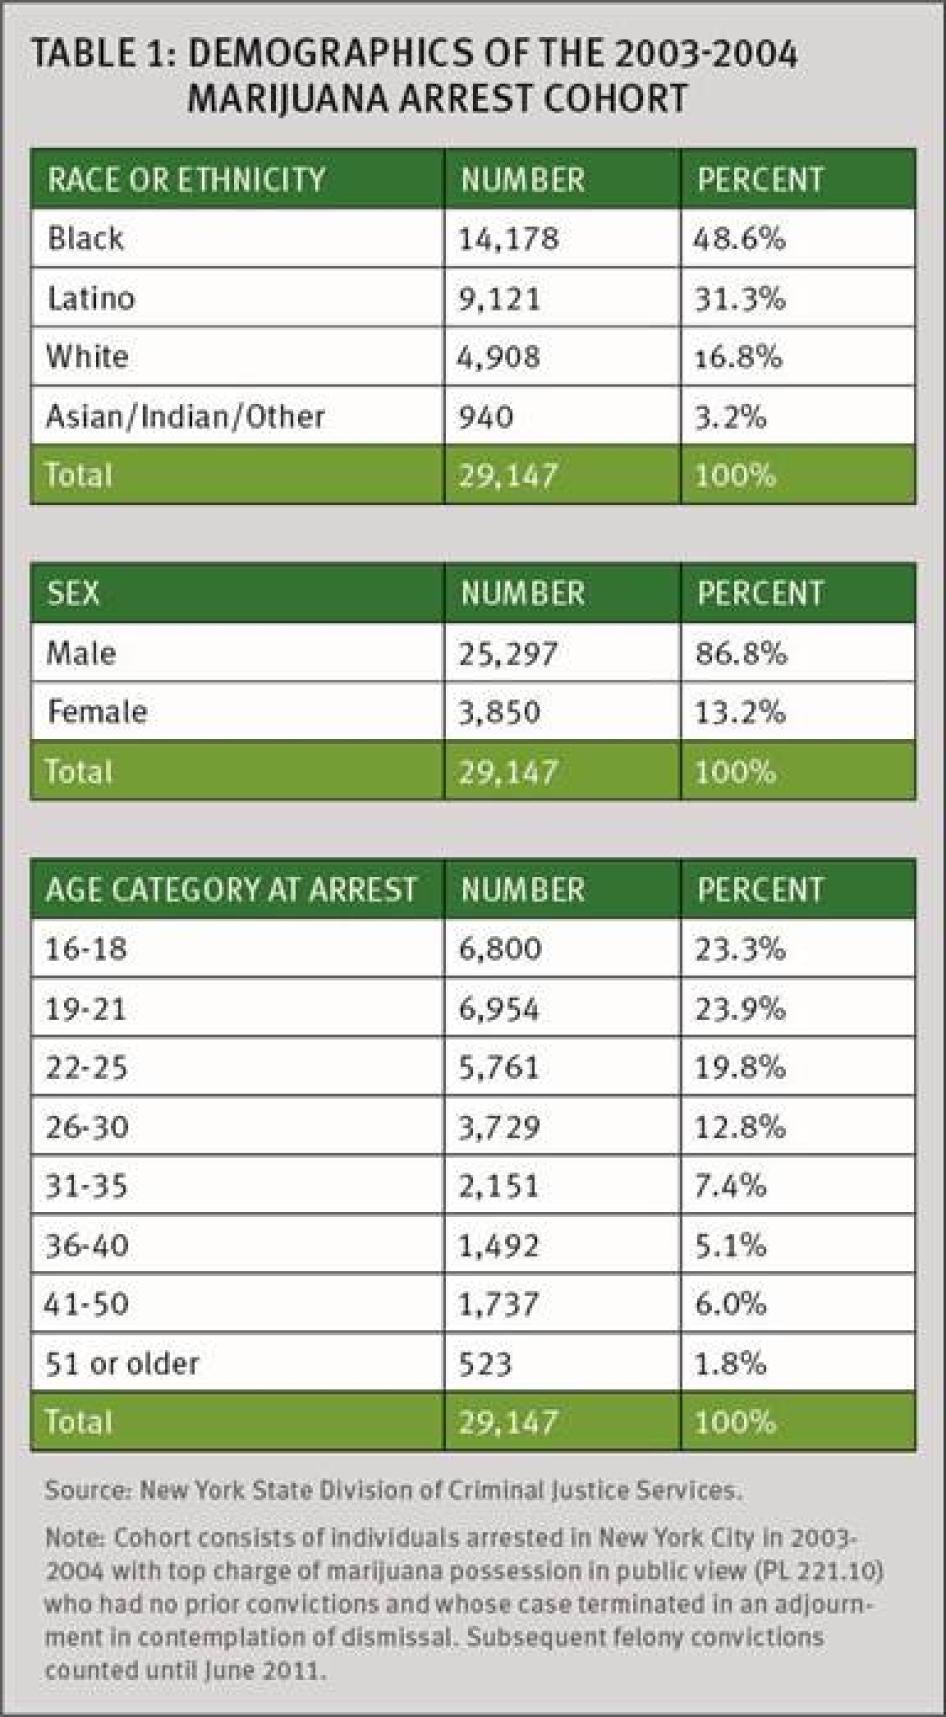
Demographics of the Group under Study
As shown in Table One, most (86.8 percent) of the individuals in the group under study were male. Two-thirds were aged 25 or younger at the time of the arrest; indeed, almost one-quarter (23.3 percent) were between 16 and 18 years of age.
Nearly eight out of ten members of the cohort were either black or Hispanic. Blacks constituted almost one-half (48.6 percent) of the cohort, and Hispanics nearly one-third (31.3 percent).
I. New York State Marijuana Laws
In 1977, the New York State legislature reclassified the private possession of small amounts of marijuana, making it a non-criminal violation.[22] The Marihuana Reform Act of 1977 expressed the rationale for the statutory change in the following terms: “The legislature finds that arrests, criminal prosecutions and criminal penalties are inappropriate for people who possess small quantities of marihuana for personal use. Every year, this process needlessly scars thousands of lives and wastes millions of dollars in law enforcement resources, while detracting from the prosecution of serious crime.”[23]
Smoking or possessing marijuana openly in public remains a misdemeanor, albeit the lowest degree misdemeanor.[24] The police may arrest and book the alleged offenders, take their fingerprints and other information, and hold them until arraignment. In addition to possessing marijuana in public view, the law criminalizes, as a misdemeanor, possessing 25 grams to 8 ounces of marijuana and the sale of any amount up to 25 grams.[25]
Marijuana Arrests and Use in New York City
Between 1996 and 2011, city police made 586,320 arrests for possession of marijuana in public view in violation of New York Penal Law § 221.10.[26] Despite the decades-old legislative directive to avoid squandering precious policing and court resources on minor marijuana possession offenses, these cases represent the largest component of citywide arrests and criminal court dockets.[27]
In some of these cases, the defendants were smoking or passing a joint in public. But residents of minority communities, people who have been arrested, and advocates for them claim that a far more typical scenario is that marijuana is recovered from inside a pocket or backpack and thus becomes “open to public view” only after the police stop individuals and either ask them to empty their pockets or conduct a frisk.[28]
Responding to widespread criticism of the circumstances surrounding many marijuana arrests, Police Commissioner Raymond W. Kelly issued Operations Order #49 on September 19, 2011.[29] Under the order, police,
… lawfully exercising their police powers during a stop may not [italics in original] charge the individual with PL 221.10(1) … if the marihuana recovered was disclosed to public view at an officer’s direction. In such situations, uniformed members of the service must charge the violation, Unlawful Possession of Marijuana (UPM), Penal Law section 221.05.[30]
Numerous reports and official state data reveal that police officers have nevertheless continued to charge New Yorkers with misdemeanors for possession of marijuana that had been hidden until the police intervened.[31]
Data gathered by the New York City Department of Health and Mental Hygiene indicates that the rates of marijuana use among the city’s youth do not differ significantly by race and ethnicity, although non-Hispanic whites have slightly higher rates than non-Hispanic blacks.[32] Nevertheless, marijuana arrests predominate in precincts with high minority populations; conversely, the lowest rates of arrest are found in the precincts with the highest proportions of white residents.[33] As a result, blacks and Hispanics are more frequently arrested for marijuana possession than whites.
Between 1996 and 2010, blacks and Hispanics constituted 87 percent of marijuana possession arrests, even though they accounted for only 52 percent of the city’s population.[34] Non-Hispanic whites were only 12 percent of arrests, but constituted 35 percent of the population.[35] Between 1997 and 2006, blacks were arrested for misdemeanor marijuana possession at five times the rate of whites; in 2008, blacks were arrested at seven times the rate of whites.[36]
A recent analysis of marijuana arrests in the period 2004-2008 revealed 48 blacks arrested for marijuana possession for every 1,000 in the population, 24 Hispanics arrested per 1,000, and 6 whites arrested per 1,000. That is, blacks were arrested for marijuana possession at eight times the rate of whites.[37]
Human Rights Watch has previously reported on racial discrimination in the context of US drug law enforcement. [38] Under international human rights law, prohibited racial discrimination occurs where there is an unjustifiable disparate impact on a racial or ethnic group, regardless of whether there is any intent to discriminate against that group.[39] This report does not seek to determine whether New York City’s marijuana possession arrests are racially discriminatory under international law. Nevertheless, we note the results of sophisticated and comprehensive research indicating marked racial disparities in marijuana arrests that cannot be justified by disparities in use or fully explained by relevant neighborhood characteristics such as crime patterns.[40]
Marijuana Arrests and Public Safety
New York City officials have suggested that marijuana possession arrests promote public safety. They have never, however, articulated the precise way they do so. Some officials point to New York City’s declining rate of violent crime and the increased number of marijuana arrests as though this constitutes an ipso facto causal connection between the two.
Thus, for example, Paul Browne, spokesman for the New York Police Department, has said, “Attention to marijuana and lower level crime in general has helped drive crime down.”[41] Jim Dwyer, a columnist for The New York times, recently wrote,
For the last four years, I have asked the mayor’s office and the police commissioner why there has been an explosion of marijuana arrests among black and Latinos. Officials in those offices consistently, and ardently, defended the arrests as vital to public safety. In 2008, a police spokesman, Paul J. Browne, said “Taking care of little crimes, including pot possession … helped drive crime down.” In 2009, John Feinblatt, a mayoral aide, said, “This continued focus on low-level offending has been part of the city’s effective crime-reduction strategy, which has resulted in a 35 percent decrease in crime since 2001.” Last year, another aide, Frank Barry, said, “Marijuana arrests can be an effective tool for suppressing the expansion of street-level drug markets and the corresponding violence.”[42]
Heather McDonald, a fellow at the Manhattan Institute, also asserts a causal link between marijuana arrests and public safety. She has said, for example, “the over 10,000 minority lives that have been saved since the onset of New York’s policing revolution are unequivocally more important than an elevated risk of getting stopped, including for marijuana violations, in a high-crime neighborhood.” [43] Social science research has cast serious doubt on the claim that marijuana arrests cause a decline in street crime. A study using longitudinal data on marijuana arrests and street crime rates from 1989-2000 in precincts across New York City concluded that increases in marijuana possession arrests were not associated with decreases in violent crime. [44]
Marijuana arrests are deeply connected to New York City’s policing policy of intensive stop, question, and frisk, as well as arrests and summonses for low-level offenses in higher crime neighborhoods. These tactics are sometimes collectively called “broken windows,” “order maintenance,” or “quality of life” policing.[45]
Broken windows policing is predicated on the theory that uncontrolled physical and social disorder foments the conditions for more serious crimes to occur. Social science scholars and policy analysts have long debated whether aggressive stop and frisks and arrests for low-level offenses do, in fact, reduce violent crime, either by enhancing the community’s sense of order and control, or perhaps simply by asserting a crime-preventing law enforcement presence in high crime areas.[46]
Jack Maple—former deputy police commissioner and one of the principle innovators of both the New York Police Department’s (NYPD) Compstat program and its dramatic expansion of stops and arrests for low-level offenses—had a different rationale. He said the goal of quality of life policing is to identify serious criminals, i.e., “to catch the sharks, not the dolphins.”[47] Franklin Zimring, a criminologist who has studied New York City policing, explains the strategy as follows: “When serious bad guys get nabbed for a minor crime, it provides an opportunity to check for outstanding warrants on them and get them off the streets.” [48]
Arrests for marijuana possession and other low-level offenses enable the police to obtain identification, fingerprints, and other information that may prove useful in solving future, as well as past crime.[49] Zimring suggests that the persons selected for marijuana arrests “are in neighborhoods and fit the profiles in the police view of potential robbers and burglars. Managing street risks rather than combating the evils of marijuana is the patrol agenda."[50] Harry Levine, a sociologist at Queens College, City University of New York who has extensively studied New York City marijuana arrests, has stated the arrests provide,
an easy way to target and acquire information—to institutionalize and routinize surveillance—on young people, particularly people of color…. Marijuana arrests are the best and easiest way currently available to acquire actual fingerprints, photos, and other data on young people, especially black and Latino youth, who have not previously been entered into the criminal justice databases.[51]
Police officers have claimed that collecting identifying information on people in high crime neighborhoods through stop, question, and frisk activities is an effective crime-solving tool.[52]
Information about marijuana arrestees would be useful to the police to solve past or future crimes if the arrestees had engaged or subsequently did engage in such crimes. Levine has previously shown that the preponderance of arrestees for marijuana possession in New York City do not have criminal records.[53] Human Rights Watch has supplemented this research by developing data that indicates people whose initial contact with the criminal justice system is for marijuana possession in public view rarely become dangerous felons in the future.
There are other possible mechanisms through which extensive marijuana arrests could reduce future crime, such as incapacitation[54] and deterrence.[55] The descriptive data we have developed cannot answer such causal questions. We believe, nonetheless, that our findings— that marijuana arrestees do not have high rates of subsequent felony crime convictions—contribute an important piece of the puzzle regarding the putative public safety benefit of marijuana arrests.
II. Findings
The following tables and figures report the arrest and conviction trajectories of members of the marijuana 2003-2004 cohort from their arrest in 2003 or 2004 until June 2011. The unit of analysis is the individual, unless otherwise specified.
Arrests
Arrests are not a valid measure of criminal conduct. In the aggregate, arrest data may say as much or more about law enforcement practices, including where and when the police work, as they do about the actions of people who are arrested.[56] Nevertheless, because arrest records are so commonly cited in criminal analyses, we have included a brief overview of the arrests of cohort members during the study period. Table Two displays the number and type (misdemeanor or felony) of arrests occurring after the marijuana arrest terminating in the initiating MJACD.
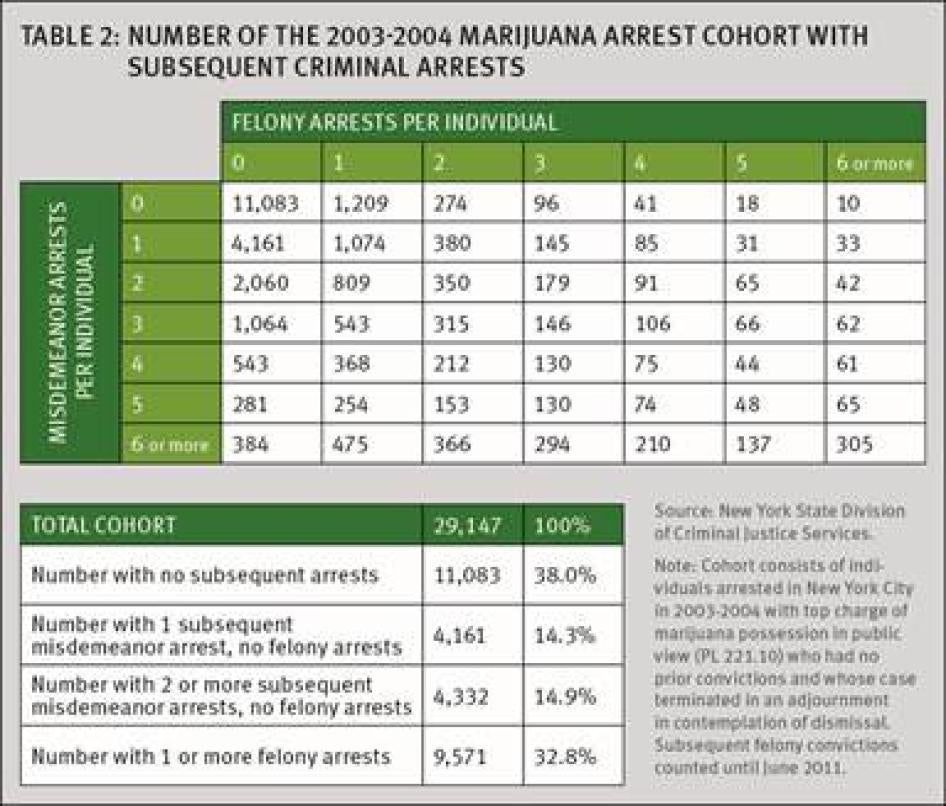
As shown in Table Two, nearly 4 in 10 (38.0 percent) of the MJACD cohort had no subsequent arrests as of mid-2011. Another 29.1 percent (8,493 individuals) had only misdemeanor and no felony arrests, including 4,161 who had only 1 subsequent misdemeanor arrest. Of the total 9,571 individuals who had 1 or more felony arrests (32.8 percent of the cohort), approximately half (4,742 individuals) had a single felony arrest.
Subsequent Convictions
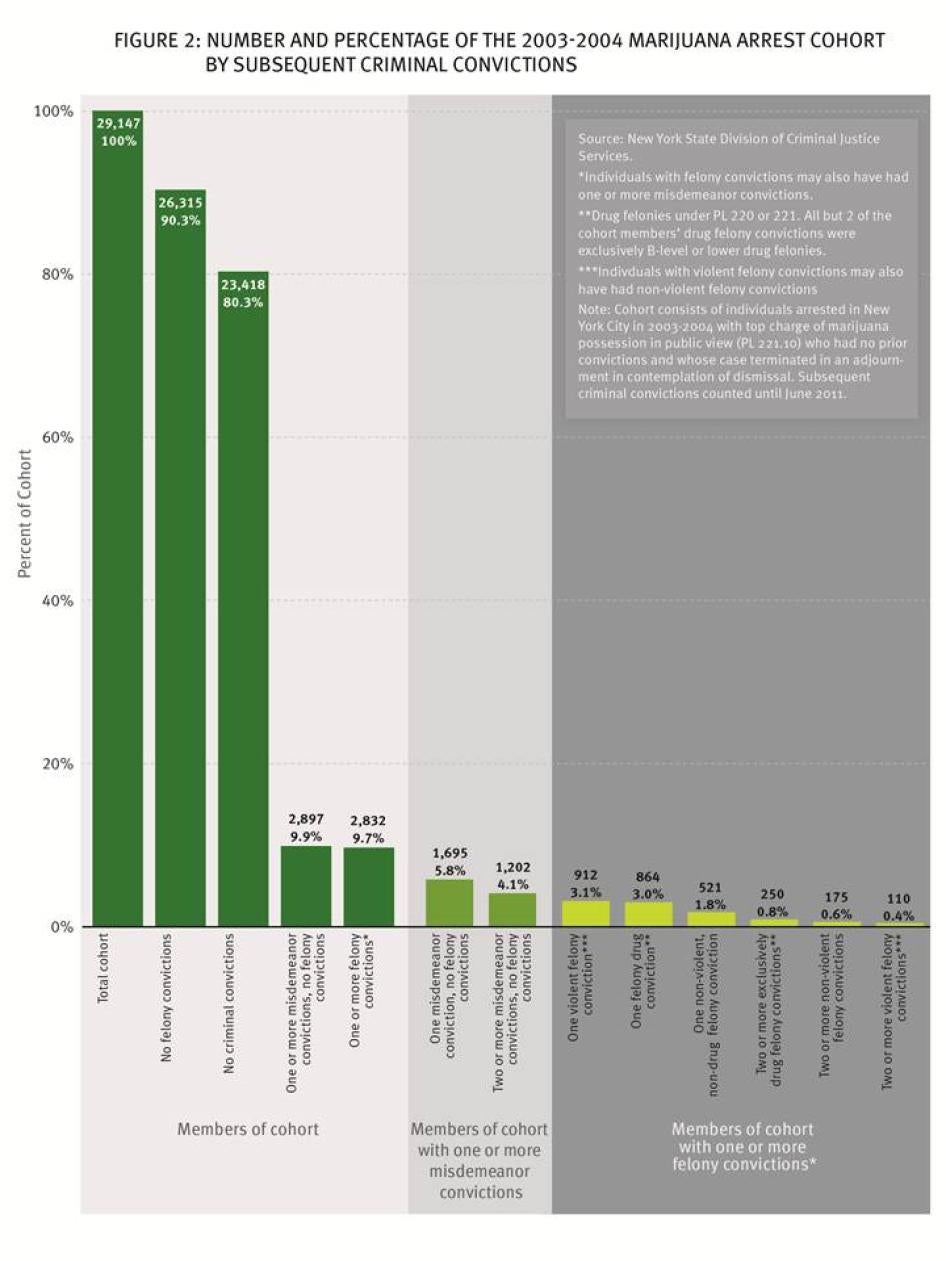
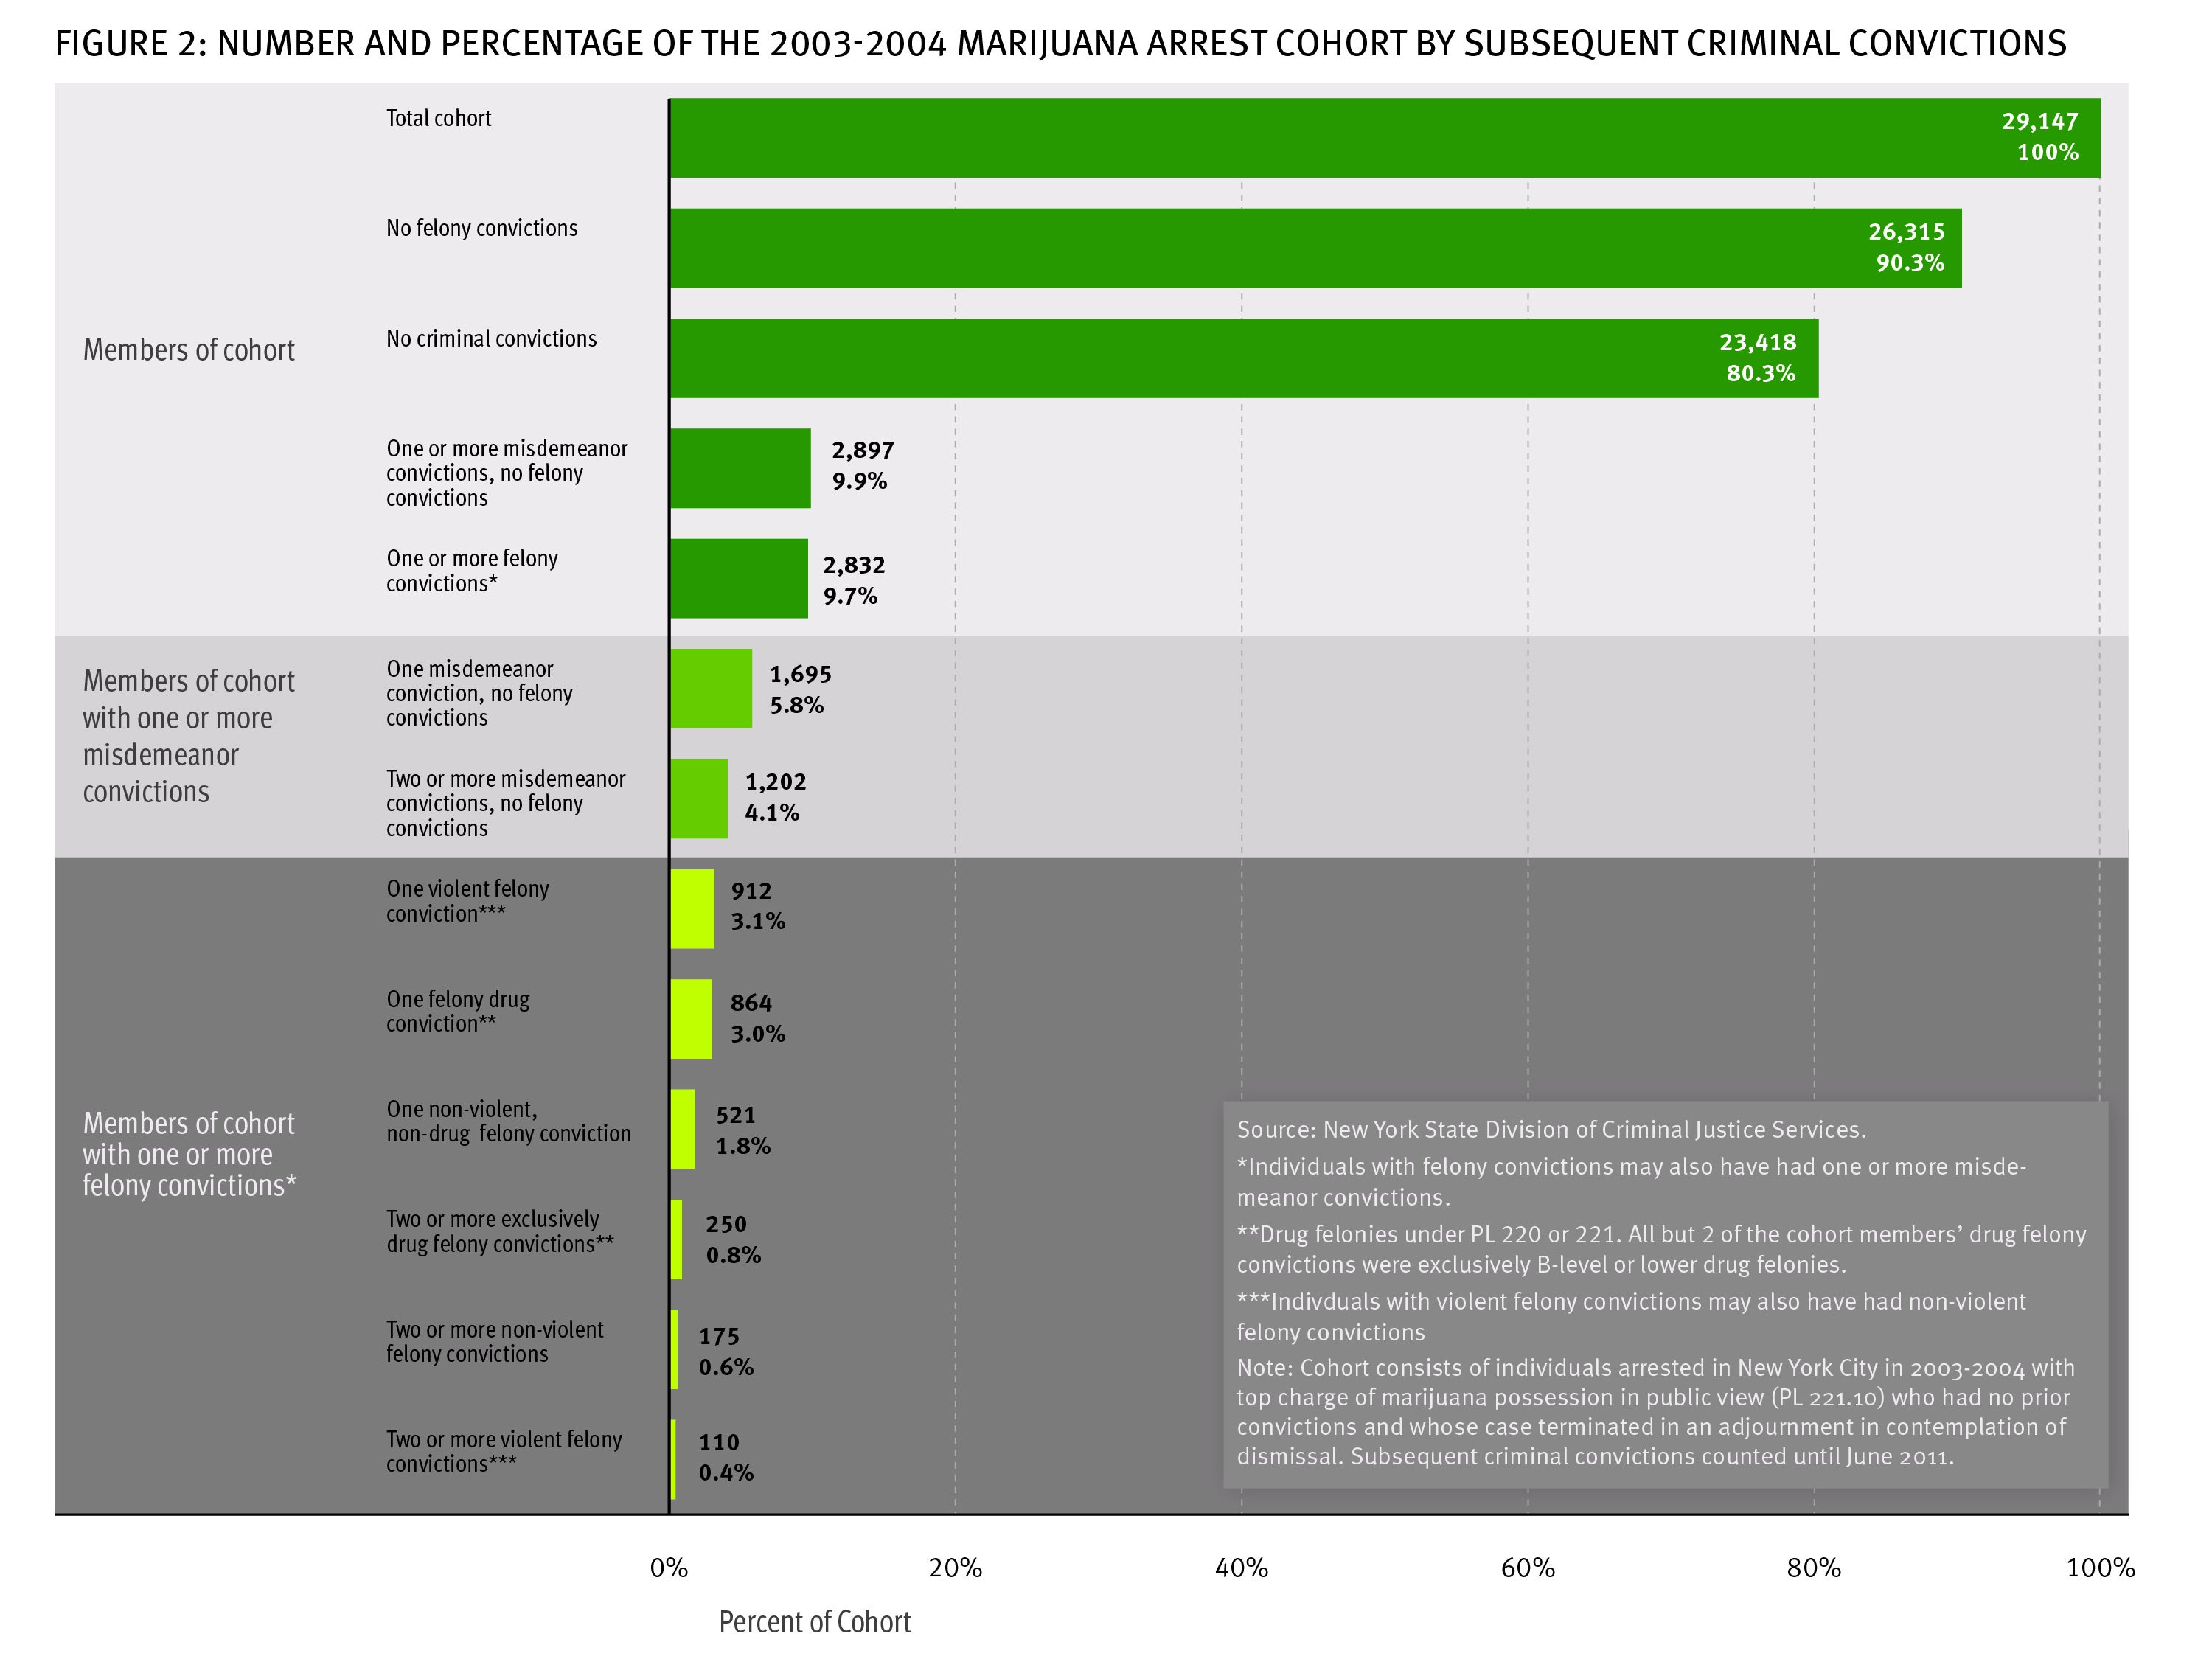
Figure 2 presents a graphic overview of the number and nature of the subsequent misdemeanor and felony convictions of members of the cohort from the time of their marijuana possession arrest in 2003 or 2004 through June 2011. In the tables and figures that follow, we drill down into these numbers to better understand their significance.
Click image to enlarge.
As shown graphically in Figure 3, four out of five (80.3 percent) of the members of the marijuana 2003-2004 cohort, or 23,418 out of the total 29,147 individuals, had no misdemeanor or felony convictions over the 6.5 to 8.5-year period they were tracked, and 9 out of 10 (90.3 percent) had no felony convictions.[57]
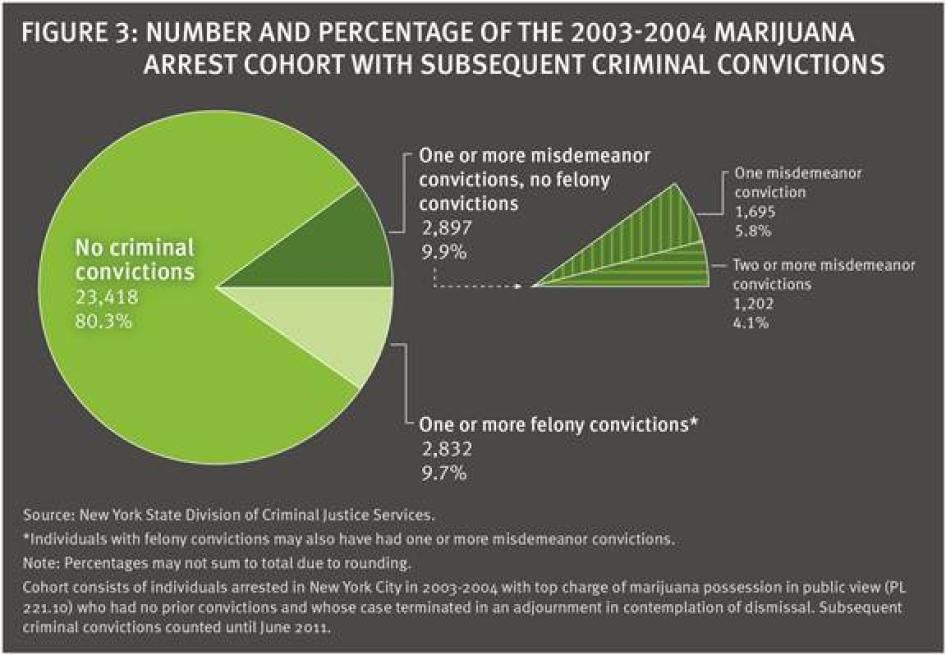
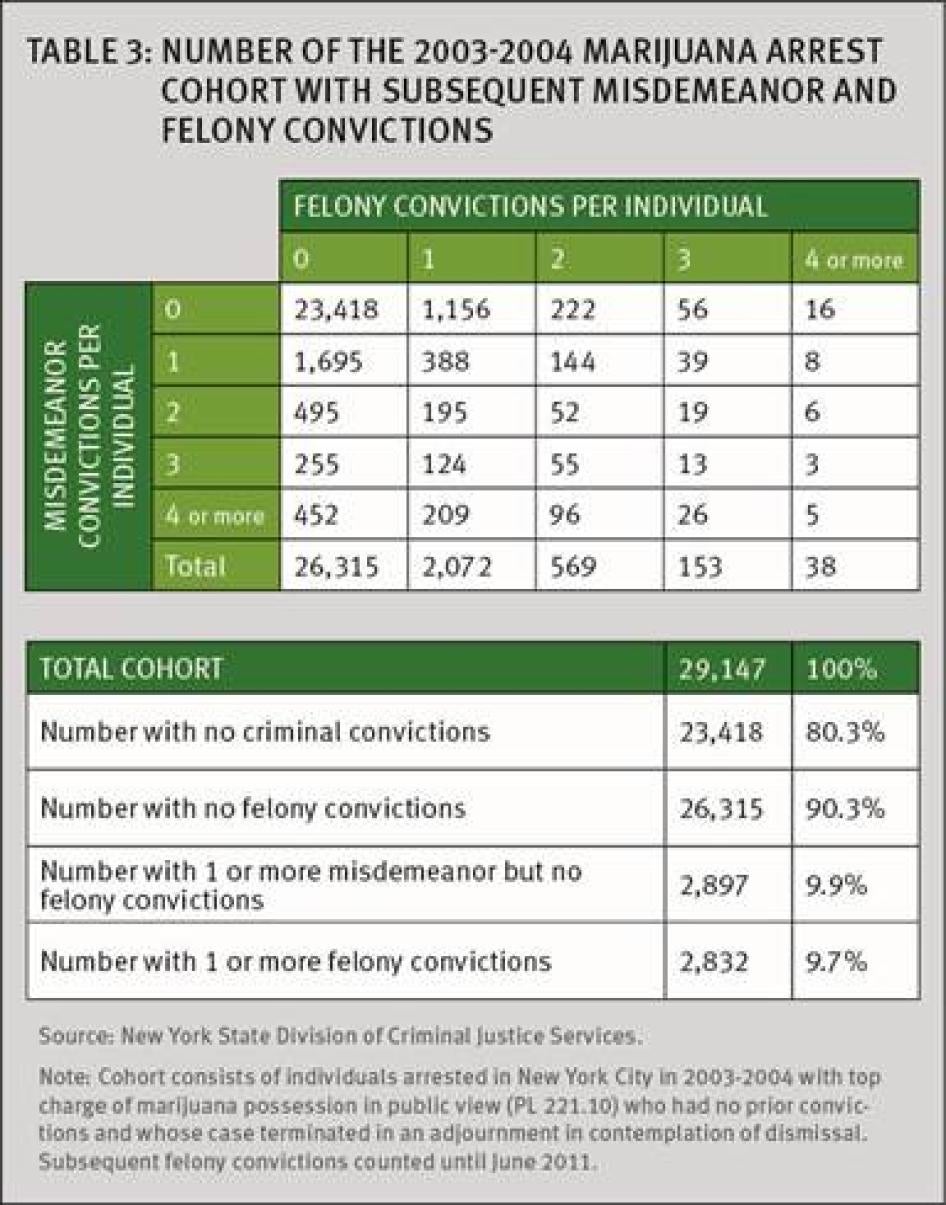
Table 3 shows that most cohort members with subsequent convictions did not have extensive criminal records. [58] For example, 1,695 individuals had a single misdemeanor conviction and no felony convictions. Another 1,202 were convicted of 2 or more misdemeanors and no felony convictions. That is, 2,897 individuals—9.9 percent of the entire cohort—had subsequent criminal records limited to misdemeanor convictions. Almost three-quarters (73.2 percent) of those who had felony convictions—2,072 out of 2,832 individuals— had a single felony conviction (not including any misdemeanor convictions). However, 760 individuals—2.6 percent of the cohort—accumulated more extensive records consisting of 2 or more felonies, including 38 who had 4 or more felony convictions. Half (51.2 percent) of all cohort members with felony convictions had no misdemeanor convictions.
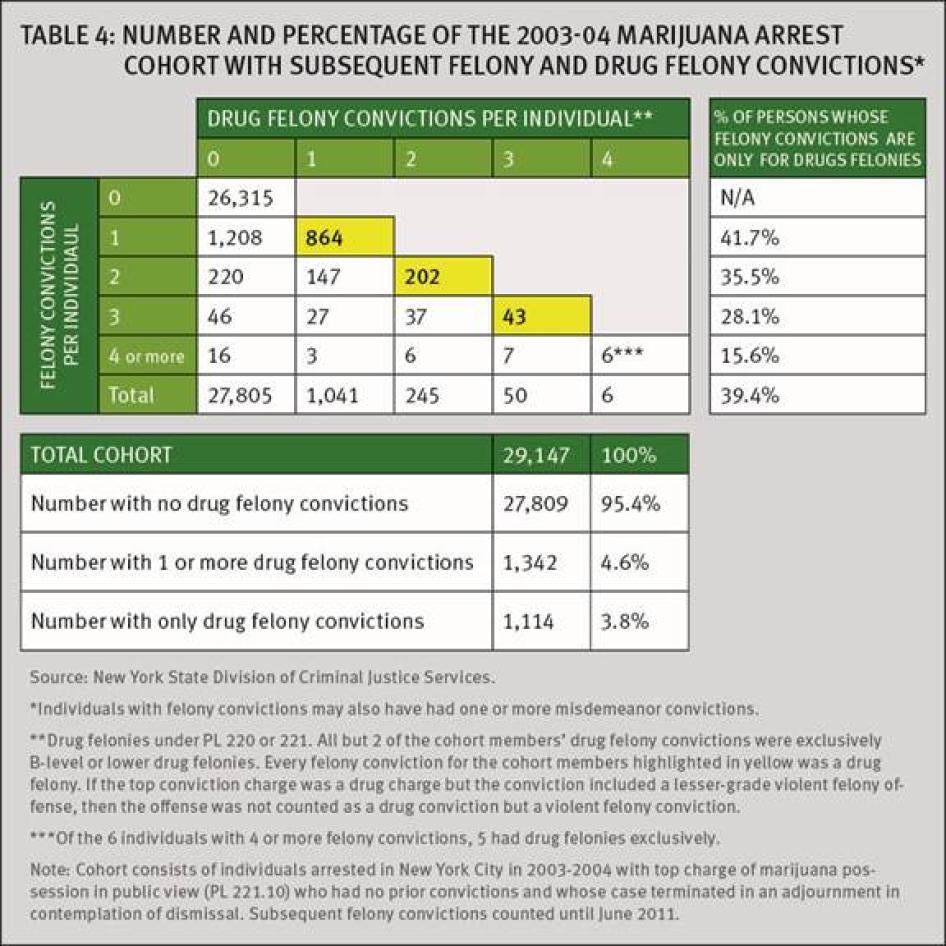
In addition to tracking the number of subsequent criminal convictions, we also sought to determine the nature of the felony crimes for which cohort members were convicted. A substantial portion of the individuals with later felony convictions were convicted exclusively for drug felonies. Among the 2,832 cohort members convicted of one or more felonies, 1,114 (39.3 percent) were only convicted of drug felonies. Among those whose felony convictions were limited to drug offenses, 77.5 percent (864 individuals) had only a single drug felony conviction. Among those convicted of drug felonies, all but two were convicted of drug crimes below class A felony offenses.[59]
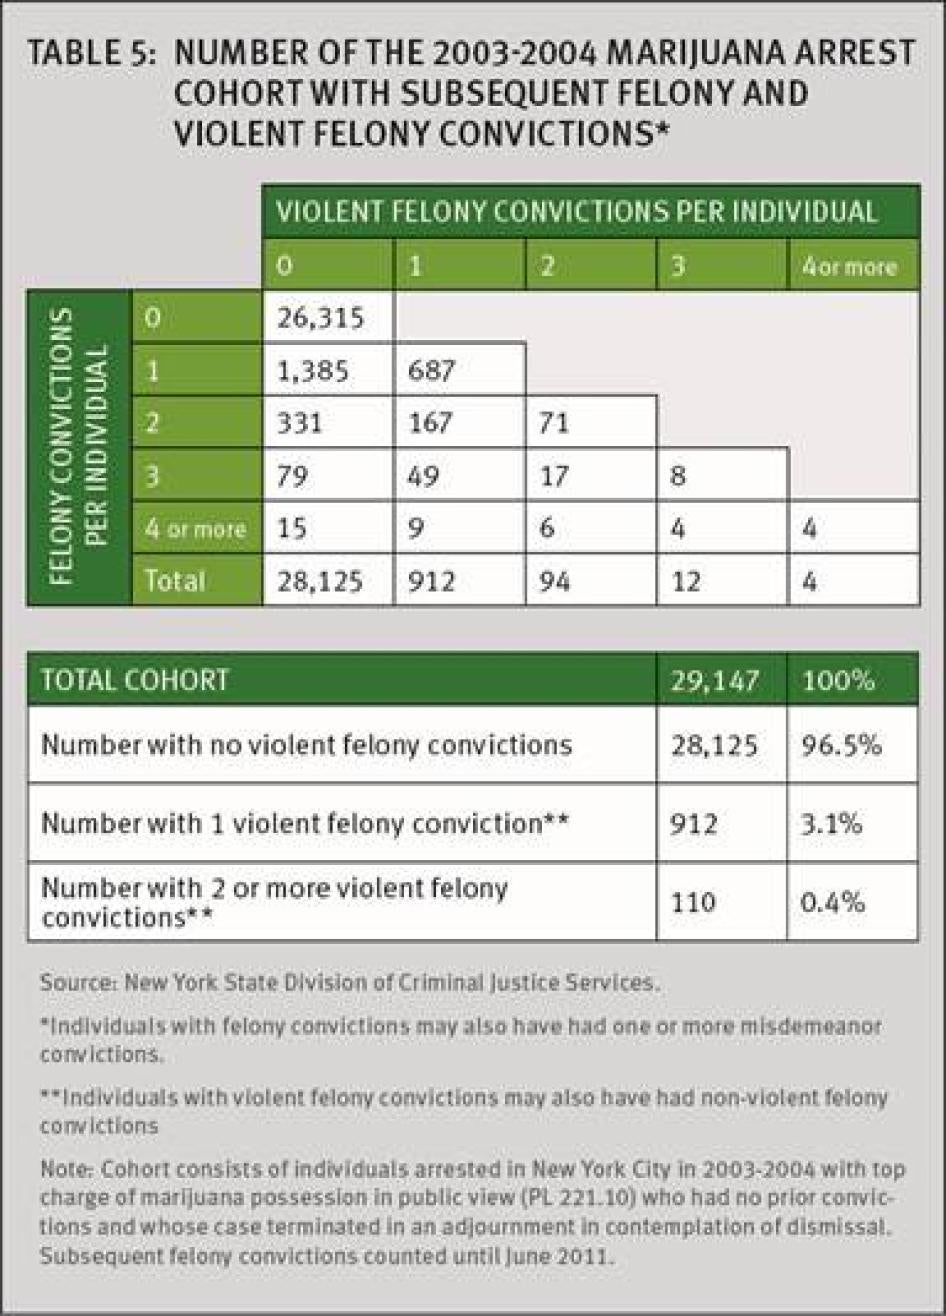
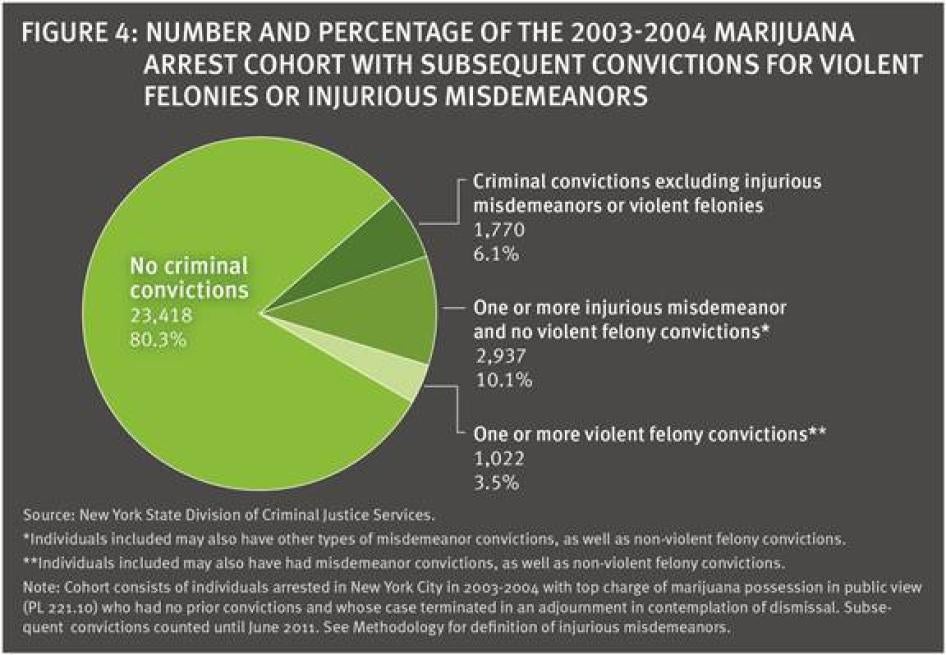
Convictions for violent felonies were relatively uncommon. [60] As shown in Table Five, only 3.5 percent of the entire cohort (1,022 individuals) had one or more violent felony convictions over the 6.5 to 8.5-year period they were tracked. Among them, 912 individuals (3.1 percent of the total cohort) had a single violent felony conviction. (Looked at differently, among all cohort members who had violent felony convictions, 82.9 percent had only one such conviction.) Only 110 individuals—0.4 percent of the cohort—had more than one violent felony conviction. Some individuals convicted of violent felonies were also convicted of nonviolent felonies. For example, of the 912 persons with a single violent felony conviction, 225 had nonviolent felony convictions as well. [61]
We constructed the category of “injurious misdemeanors” to capture convictions for lower level crimes that involved or risked physically harmful or offensive conduct. The category includes offenses such as misdemeanor assault (e.g. intentionally causing physical harm to another that does not reach the felony threshold of “serious physical harm,” e.g. a slap in a bar), weapons possession (e.g. possession of a gravity knife), or misdemeanor sexual offenses (e.g. unwanted touching of a stranger’s buttocks on the subway) (see Methodological Appendix for full list of offenses included in this category).
As shown in Figure 4, in addition to the 80.3 percent of the group (23,418 individuals) who had no subsequent criminal convictions at all, 6.1 percent (1,770 individuals) had criminal convictions that did not include injurious misdemeanors or violent felonies. Another 10.1 percent (2,937 individuals) had one or more injurious misdemeanors, but no violent felony convictions. [62]
Among the members of the cohort who were subsequently convicted of an injurious misdemeanor, the most common convictions were, in order of frequency:
- Criminal trespass in the second degree
- Driving while intoxicated
- Assault in the third degree
- Criminal possession of a weapon in the fourth degree
- Criminal contempt in the second degree or bail jumping
- Unauthorized use of a vehicle in the third degree [63]
Our aim in this study was to ascertain whether a significant percentage of people who enter the criminal justice system for misdemeanor marijuana possession go on to be convicted of serious felony offenses. We found that within 6.5 to 8.5 years after the initial marijuana possession arrest, 3.5 percent had one or more violent felony convictions, and another 6.5 percent had felony convictions for nonviolent offenses.
Assessing the significance of 3.5 percent as the proportion of the cohort who have subsequent violent felony convictions is necessarily a value judgment. Some people might think it an extremely large number, others might think it extremely small. Interpretation of any statistic always involves substantive and subjective policy and value judgments.
There is no readily available data on the rates of felony or violent felony conviction for comparable demographic groups in New York City who do not enter the criminal justice system on marijuana charges.[64] But the rate of felony and violent felony conviction among this group of first-time marijuana arrestees appears to be lower than the rate of felony conviction for the national population, taking into account age, gender, and race.[65]
One major national study, for example, estimated that the
cumulative risk of imprisonment by the age of 33 (that is, being sentenced to a
prison term for any felony conviction) for the cohort of men born between
1965-1969 was 5.3 percent for white men with no college education and 30
percent for black men with the same age and education profile.[66]
Using a cross-sectional approach, another study estimated that over 6 percent
of the adult non-black population had a felony conviction in 2010, whereas 25
percent of the black adult male population had a felony conviction in 2010.[67]
Conclusion
Many critics of New York City’s marijuana possession arrests insist they are skewed racially and by class, have little public safety payoff, cost the city hundreds of millions of dollars, and unnecessarily subject marijuana users to the harshness of the criminal justice system. As one academic article recently summarized, “Nonwhite New Yorkers bear a racial tax from contemporary policing strategy, a social cost not offset by any substantial observed benefits to public safety.”[68]
If the point of making massive marijuana arrests is to cast a wide net where potential sharks might be lurking—to use Jack Maple’s phrase—the police seem to be pulling in far more dolphins than sharks. Neither our findings nor those of other researchers indicate the arrests are an efficient or fair means for identifying future dangerous felons.
Whether or not marijuana arrests should nonetheless continue to be the number one police arrest activity and the number one penal law charge adjudicated in New York City’s criminal courts is a matter outside the scope of this report. But litigation, extensive research by others, and our data all suggest New York City officials should provide long overdue answers to such important questions as: How exactly do marijuana arrests contribute to public safety and crime control? Are the stops that result in marijuana arrests made lawfully? Do the arrests produce unwarranted racial disparities? Do public benefits resulting from the arrests outweigh the costs, including the very real impact they have on the lives and rights of those arrested?
Acknowledgements
This report was co-authored by Issa Kohler-Hausmann, a research fellow at Georgetown Law Center and PhD candidate at New York University and consultant to Human Rights Watch for this project, and Jamie Fellner, senior advisor in the US Program at Human Rights Watch. It is based primarily on analyses conducted by Ms. Kohler-Hausmann of data provided to her by the New York State Division of Criminal Justice Services. Brian Root, quantitative analyst in the US Program, reviewed the statistics and, along with Grace Choi, publications director, helped develop their graphic presentation.
This paper was edited by Maria McFarland, acting director of the US Program and Danielle Haas, senior editor in the Program Department. Aisling Reidy provided legal review. Production assistance was provided by Samantha Reiser, associate in the US Program. Layout, graphics, and production were undertaken by Anna Lopriore, creative outreach manager, Ivy Shen, multimedia production associate, Grace Choi, publications director, and Fitzroy Hepkins, mail manager for Human Rights Watch.
We are grateful to the New York State Division of Criminal Justice Services for their assistance in providing aggregate data for 2003-04 marijuana possession arrests and other assistance. The analysis, opinions, findings, and conclusions expressed in this publication are those of the authors and not those of DCJS. We are indebted to Harry Levine, Department of Sociology, Queens College, City University of New York for his pioneering analysis of NYC marijuana arrests and his encouragement of this project. We also thank Amanda Geller, associate research scientist at Columbia University School of Social Work, Scott Levy, Bronx Defenders, David Greenberg, Department of Sociology, New York University, David Cole, Georgetown University Law Center, Christopher Weiss, Department of Sociology, New York University, and Andrew Golub, National Development and Research Institute for their helpful comments on earlier drafts of this report.
Methodological Appendix
Study Summary & New York State Sealing Laws
This study was designed to track the criminal justice trajectories of individuals who entered the low end of the criminal justice system for marijuana possession. However, the state’s sealing laws (namely Criminal Procedure Law §§ 160.50 and 160.55) limit our ability to reliably track the later criminal justice trajectories of individuals who enter the criminal justice system with an arrest that terminates in a dismissal or conviction for a non-criminal violation.
When a person is arrested with no prior New York State criminal justice contacts, a unique criminal justice identifying number, called a New York State Identification (NYSID), is generated and matched to the defendant’s fingerprints. If the person is convicted of a criminal offense (that is, the case is not dismissed and the defendant is not convicted of a non-criminal violation or infraction), then the New York State Division of Criminal Justice Services (NYDCJS) maintains a digital image of the fingerprint linked to the offender’s name, NYSID, and other identifying information. From that point forward, if the person is arrested, his or her prints are taken and matched to the NYSID and the criminal record is generated based on this match. All later records of this individual’s arrest events are linked together by the same NYSID in the DCJS database.
If a defendant’s case is dismissed in any fashion, all records of the proceedings must be sealed and—provided the state does not already have the defendant’s fingerprints on file from a prior criminal conviction—the fingerprints must be destroyed and de-linked from the NYSID.[69] If that same person is arrested after the sealing date he or she would be issued a new NYSID. This means that an individual could have a later arrest that would not be connected to the prior arrest by a common NYSID.
However, if the defendant’s case terminates in a marijuana Adjournment in Contemplation of Dismissal (ACD), as defined by Criminal Procedure Law § 170.56, then the fingerprints are not destroyed and de-linked from the NYSID. Because the statute forbids a defendant from being granted more than one marijuana ACD in his or her lifetime, New York Criminal Procedure Law § 160.50(1)(a) explicitly excludes the MJACD from the provisions of the sealing law requiring DCJS to destroy the fingerprints of defendants in these cases.[70]
If the defendant is convicted, either through a plea or trial, of a non-criminal violation—and provided the state does not already have the defendant’s fingerprints on file from a prior criminal conviction—then his or her fingerprints will also eventually be destroyed and de-linked from the arrest NYSID unless the court has issued a do not seal order.[71] If the defendant was convicted of a violation or infraction and sentenced to a conditional discharge, then the case remains on the person’s rap sheet for a year, after which (provided there is no other criminal conviction) the case is sealed, and the DCJS is directed to destroy the fingerprints and de-link the NYSID.[72] If the defendant was convicted of a violation or infraction and sentenced to time served, or a fine, or other sentence short of a conditional discharge, then the arrest may be sealed as soon as the defendant completes the term of the sentence and pays the fine and court-imposed surcharge if the court transmits the seal order. In sum there is no way to reliably track the subsequent criminal records of individuals whose first arrest terminates in a dismissal (except MJACD) or a non-criminal violation or infraction conviction.
This study therefore concentrates on those whose arrest terminated in a “marijuana adjournment in contemplation of dismissal” (MJACD), as defined in Criminal Procedure Law § 170.56 or Criminal Procedure Law § 210.46, because those individuals who enter the criminal justice system for low-level marijuana possession can be reliably tracked over time.
Data
The quantitative data comes from New York State Division of Criminal Justice Services (DCJS), which collects data from the courts and maintains it for the state. Some of the arrest and disposition aggregate statistics were provided in the aggregate form by DCJS. The remaining quantitative data was provided as micro-level criminal history records of a specific cohort of misdemeanor arrestees.[73] The micro-level data contains a de-identified identification number linking unique individuals to arrest and disposition events. Because DCJS provided de-identified records (that is, not identified by the official New York State Identification Number (NYSID) used in all court and corrections administration record-keeping and readily traceable to specific individuals), we were able to obtain sealed records of arrest incidents that did not terminate in a criminal conviction.
The file provided for each arrest event is called the “top charge” file, which means it lists only the highest-level criminal offense charged at the time of arrest and the highest-level criminal offense at the disposition and does not contain information on any other charges that may have also been included on the docket for a given case.[74] Data reporting the arrest or conviction charged therefore represents the highest arrest or disposition charge on the docket, and each case may have had other lower-level charges attached to that docket. DCJS, and not the authors, coded the cases for “top charge” and information about their ranking algorithm is available upon request.
Definition of the MJACD 03-04 Cohort
We included in our cohort, anyone who:
- Received a MJACD from an arrest in the years 2003 and 2004
- (Arrest year, not disposition year, qualified a person for the cohort)
- Had no prior criminal convictions
- Had a top arrest charge of marijuana possession in the fifth degree (New York Penal Law § 221.10)
We counted subsequent arrests and convictions if they occurred after the date of the arrest that led to the first MJACD disposition. If a person had more than one MJACD, the date of first arrest was selected as the beginning date, after which all arrests and convictions were tabulated.[75] We excluded subsequent arrest incidents that lacked arrest charge and disposition data.
The most recent date included in the DCJS data set was June 19, 2011. Since individuals entered the cohort at different times they were “at risk” of offending for different lengths of time. The earliest MJACD date was January 1, 2003 and the latest was December 31, 2004. Therefore the longest period of observation would be eight years, five months, ten days and the shortest would be six years, five months, eleven days.
Criminal Convictions
Convictions include non-youthful offender adjudications to criminal offenses obtained via plea, verdict, or type unknown. Criminal offenses include only convictions for penal law-defined printable misdemeanor or felony offenses. Counts of convictions for criminal offenses do not include convictions for non-criminal violations or infractions.
New York State data does not contain information on out-of-state arrests or federal arrests, so later arrests for conviction count will not reflect criminal justice encounters in other jurisdictions.
Violent Felony Definition
Our definition of violent felonies tracks that used by DCJS as defined in NY Penal Law §§70.02 and 70.04, which sets forth the offenses defined as violent felony offenses for purposes of sentencing and statutorily required record-keeping by the DCJS. We also include in our definition of violent felonies offenses that the DCJS codes as “VFO-like class A-1 offenses not in VFO,” as well as felony convictions where there was an underlying violent felony offense, even if that offense was not the top conviction charge.
Injurious Misdemeanor Definition
Injurious Misdemeanors include all misdemeanor convictions for crimes in the following penal law sections:
120 Assault
130 Sex offenses
135 Kidnapping, Coercion
140 Burglary and Trespass only for the following subsections:
140.15 - Criminal trespass in the second degree
140.35 - Possession of burglar’s tools
150 Arson
165 Theft only for the following subsections:
165.05 - Unauthorized use of a vehicle in the second degree
165.09 - Auto stripping in the third degree
165.40 - Criminal possession of stolen property in the fifth degree
205 Escape
215 Contempt and tampering
260 Child or Elderly Endangerment
265 Weapons
1192 VTL Driving Intox
[1]Individuals convicted of violent felonies may also have had nonviolent felony and/or misdemeanor convictions.
[2] In their statements supporting Governor Andrew M. Cuomo’s June 2012 proposal to make marijuana possession in public view a non-criminal violation instead of a misdemeanor, Assemblymember Hakeem Jeffries, Bronx District Attorney Robert T. Johnson, and Nassau County District Attorney Kathleen Rice all noted that the marijuana possession arrests have intensified tensions between law enforcement and community residents of high crime neighborhoods. “Governor Cuomo Announces Legislation to Bring Consistency and Fairness to the State’s Penal Law and Save Thousands of New Yorkers from Unnecessary Misdemeanor Charges,” Office of Governor Cuomo press release, June 4, 2012, http://www.governor.ny.gov/press/060412legislation (accessed October 29, 2012). See also, Jeffrey Fagan and Garth Davies, “Street Stops and Broken Windows: Terry, Race and Disorder in New York City,” Fordham Urban Law Journal, vol. 28(2000), p. 457; Eliot Spitzer, Civil Rights Bureau, “The New York City Police Department’s ‘Stop & Frisk’ Practices: A Report to the People of the State of New York From the Office of the Attorney General,” December 1, 1999, pp. 74-87; Tom Tyler and Jeffrey Fagan, “Legitimacy and Cooperation: Why Do People Help the Police Fight Crime in Their Communities?,” Ohio State Journal of Criminal Law, vol. 6(2008), http://moritzlaw.osu.edu/osjcl/Articles/Volume6_1/Tyler-Fagan-PDF.pdf (accessed October 16, 2012), p. 231.
[3] Criminal Court City of the City of New York, “Annual Report 2011,” http://www.courts.state.ny.us/courts/nyc/criminal/AnnualReport2011.pdf (accessed October 15, 2012), p. 26. Of the total of 354,797 arraignments in 2011, 50,458 were for felonies, 258,466 were for misdemeanors, and 45,873 were for violations or other offenses.
[4] Human Rights Watch, The Price of Freedom: Bail and Pretrial Detention of Low Income Nonfelony Defendants in New York City, December 3, 2010, http://www.hrw.org/sites/default/files/reports/us1210webwcover_0.pdf; Gomez-Garcia et al. v. The New York City Police Department et al., New York State Supreme Court, Verified Complaint, filed June 21, 2012, http://www.legal-aid.org/media/157211/06222012_marijuana_complaint.pdf (accessed October 19, 2012).
[5] District Attorney Cyrus Vance, “DA Vance Testimony on Marijuana Law Reform,” hearing before the New York City Council Public Safety Committee, June 12, 2012, http://manhattanda.org/popup/speeches/node/2798 (accessed October 19, 2012).
[6] K. Babe Howell, "Broken Lives from Broken Windows: The Hidden Costs of Aggressive Order-Maintenance Policing," NYU Review of Law & Social Change, vol. 33(2009), p. 371 ; Testimony of The Legal Aid Society, “In Support of: Res. 986-A - Resolution Supporting the Governor’s Proposal to Amend the Penal Law to Make Possession of a Small Quantity of Marijuana in Public View a Violation, Applauding the Speaker of the Assembly for His Support of the Proposal, and Calling Upon the Senate to Pass Legislation enacting the Same,” public hearing before the New York City Council Public Safety Committee, http://www.legal-aid.org/media/157208/testimony_061212.pdf (accessed October 19, 2012); Human Rights Watch, No Second Chance: People with Criminal Records Denied Access to Public Housing, November 18, 2004, http://www.hrw.org/reports/2004/11/17/no-second-chance ; Mosi Secret, “No Cause for Marijuana Case, But Enough for Child Neglect,” The New York Times, August 17, 2011, http://www.nytimes.com/2011/08/18/nyregion/parents-minor-marijuana-arrests-lead-to-child-neglect-cases.html?pagewanted=all (accessed October 17, 2012). In New York State and New York City various provisions forbid private and public employers from discrimination against an individual on the basis of an arrest that did not terminate in a conviction, or on the basis of a criminal conviction unless there is a direct relationship between the conviction and the employment being sought or if the employment would pose an unreasonable risk (New York Executive Law § 296(16); New York City Administrative Code § 8-107(11); New York Corrections Law Article 23-A, § 752). Clearly as a practical matter it is difficult to prove such discrimination if employers nonetheless ask about prior arrests, even if such arrests do not show up on an official criminal justice history report. Many other states do not offer such statutory protection.
[7] Assemblymember Hakeem Jeffries, in “Governor Cuomo Announces Legislation to Bring Consistency and Fairness to the State’s Penal Law and Save Thousands of New Yorkers from Unnecessary Misdemeanor Charges,” Office of Governor Cuomo press release, June 4, 2012, http://www.governor.ny.gov/press/060412legislation.
[8] An overview of reactions to the proposed legislation by New York City legislation is available at David King, “Reactions to Cuomo’s Marijuana Bill,” Gotham Gazette, June 4, 2012, http://www.gothamgazette.com/blogs/wonkster/2012/06/04/reaction-to-cuomos-marijuana-bill (accessed October 29, 2012).
[9]“Governor Cuomo Announces Legislation to Bring Consistency and Fairness to the State’s Penal Law and Save Thousands of New Yorkers from Unnecessary Misdemeanor Charges,” Office of Governor Cuomo press release, June 4, 2012, http://www.governor.ny.gov/press/060412legislation.
[10] Ibid.
[11] Ibid.
[12] DCJS provided the criminal history data to Issa Kohler-Hausmann for an ongoing research project on New York City misdemeanors; Ms. Kohler-Hausmann worked as a Human Rights Watch consultant for this project to track the subsequent criminal trajectories of marijuana arrestees. The data was provided by DCJS in the interest of information exchange. The opinions, findings, and conclusions expressed in this publication are those of the authors and not those of DCJS. Neither New York State nor DCJS assumes liability for its contents or use thereof. The data was in the form of micro-level arrest incidents grouped by de-identified identification number. DCJS was not involved in the analysis of the data and bears no responsibility for our methods of statistical analysis or for the conclusions derived therefrom.
[13] Criminal possession of marihuana in the fifth degree, New York Penal Law § 221.10. “A person is guilty of criminal possession of marihuana in the fifth degree when he knowingly and unlawfully possesses: 1.marihuana in a public place, as defined in section 240.00 of this chapter, and such marihuana is burning or open to public view; or 2.one or more preparations, compounds, mixtures or substances containing marihuana and the preparations, compounds, mixtures or substances are of an aggregate weight of more than twenty-five grams. Criminal possession of marihuana in the fifth degree is a class B misdemeanor.”
                [14]


          Adjournment in Contemplation of Dismissal in Cases Involving Marihuana, New York Criminal Procedure Law § 170.56.
[15] It is not possible from this DCJS data to determine reliably how many of the members of the MJACD cohort had prior non-criminal violation convictions. See Methodological Appendix.
[16]New York Criminal Procedure Law § 170.56.
[17] Unpublished DCJS data on file with Human Rights Watch. Note, these numbers reflect dispositions as a percent of arrest incidents, not individuals.
[18] The rap sheet is the criminal history record maintained in New York State by the New York Division of Criminal Justice Services.
[19]New York Criminal Procedure Law § 170.56(1); New York Criminal Procedure Law § 160.50(1)(a), Order Upon Termination of Criminal Action in Favor of the Accused, explicitly exempts the MJACD from various provisions of the sealing law. See Methodological Appendix.
[20] See the Methodological Appendix for further explanation as to why this group of individuals who entered the criminal justice system for a marijuana arrest, as opposed to those whose cases are dismissed under other provisions or who are convicted of a non-criminal violation, can be reliably tracked over time.
[21] See Methodological Appendix for details.
[22] Unlawful Possession of Marihuana, New York Penal Law § 221.05. “A person is guilty of unlawful possession of marihuana when he knowingly and unlawfully possesses marihuana. Unlawful possession of marihuana is a violation punishable only by a fine of not more than one hundred dollars. However, where the defendant has previously been convicted of an offense defined in this article or article 220 of this chapter, committed within the three years immediately preceding such violation, it shall be punishable (a) only by a fine of not more than two hundred dollars, if the defendant was previously convicted of one such offense committed during such period, and (b) by a fine of not more than two hundred fifty dollars or a term of imprisonment not in excess of fifteen days or both, if the defendant was previously convicted of two such offenses committed during such period.”
[23] New York Penal Law Article 221 Legislative Note.
[24] Criminal Possession of Marihuana in the Fifth Degree, New York Penal Law § 221.10. Criminal possession of marihuana in the fifth degree is a B misdemeanor. The amount possessed must be less than 25 grams.
[25]Offenses Involving Marihuana, New York Penal Law Article 221. Sale or possession of large quantities is classified as a felony crime.
[26]Harry G. Levine, Sociologist at Queens College and the Graduate Center of the City University of New York, “Memo (in Lieu of Testimony) Regarding State Senate Bill 5187, Marijuana Possession Arrests in New York, 1977-2010,” June 15, 2011, http://dragon.soc.qc.cuny.edu/Staff/levine/Testimony-Memo-NYS-Senate-Marijuana-Arrests-June-2011.pdf (accessed September 26, 2012).
[27]Top Ten Misdemeanor Arrests Charges, Division of Criminal Justice Services (DCJS) data provided to author Kohler-Hausmann, on file with Human Rights Watch; Criminal Court of the City of New York, “Annual Report 2011,” May 2012, http://www.courts.state.ny.us/courts/nyc/criminal/AnnualReport2011.pdf. The most common arraignment charge for the past five years has been Criminal Possession of Marihuana in the Fifth Degree, New York Penal Law § 221.10.See Criminal Court of the City of New York, “Annual Report 2007,” July 2008, http://www.nycourts.gov/courts/nyc/criminal/NYCCC%20Annual%20Report%20Final%20072508.pdf; Criminal Court of the City of New York, “Annual Report 2008,” August 2009, http://www.nycourts.gov/courts/nyc/criminal/AnnualReport2008.pdf; Criminal Court of the City of New York “Annual Report 2009,” July 2010, http://www.nycourts.gov/courts/nyc/criminal/AnnualReport2009.pdf; Criminal Court of the City of New York, “Annual Report 2010,” August 2011, http://www.nycourts.gov/courts/nyc/criminal/AnnualReport2010.pdf; Criminal Court of the City of New York, “Annual Report 2011,” May 2012, http://www.nycourts.gov/courts/nyc/criminal/AnnualReport2011.pdf (all accessed October 15, 2012).
[28] See, e.g., “Preliminary Data Review Fact Sheet,” The Bronx Defenders Marijuana Arrest Project, April 2, 2002, http://www.bronxdefenders.org/press/bronx-defenders-marijuana-arrest-project-announces-preliminary-review-data-reflecting-ongoing- (accessed October 15, 2012); Harry G. Levine and Deborah Peterson Small, New York Civil Liberties Union, “Marijuana Arrest Crusade: Racial Bias and Police Policy In New York City 1997-2007,” April 2008, http://www.nyclu.org/files/MARIJUANA-ARREST-CRUSADE_Final.pdf (accessed October 15, 2012), p. 60; Drug Policy Alliance, “$75 Million a Year: The Cost of New York City's Marijuana Possession Arrests,” March 2011, http://www.drugpolicy.org/docUploads/_75_Million_A_Year.pdf (accessed October 15, 2012), p. 11; Alisa Chang, “Alleged Illegal Searches by NYPD May Be Increasing Marijuana Arrests,” WNYC News, April 26, 2011, http://www.wnyc.org/articles/wnyc-news/2011/apr/26/marijuana-arrests/ (accessed October 15, 2012).
[29]Operations Order Number 49, Police Department, City of New York, “Charging Standards for Possession of Marihuana in a Public Place Open to Public View,” September 19, 2011, http://www.nyc.gov/html/om/pdf/2012/nypd-marijuana-order.pdf (accessed September 16, 2012).
[30] Ibid. In July 2012, the NYPD also issued a “Finest Message, General Administrative Information” memo to all commands stating that the presiding desk officer will be reviewing all arrests for misdemeanor marijuana possession in the fifth degree to assure the arrest was made in accordance with Operations Order Number 49. The unpublished order is on file with Human Rights Watch.
[31]Gomez-Garcia et al. v. The New York City Police Department et al., New York State Supreme Court, Verified Complaint, filed June 21, 2012, http://www.legal-aid.org/media/157211/06222012_marijuana_complaint.pdf; Alice Brennan and Ryan Devereaux, “New York Police Officers Defy Order to Cut Marijuana Arrests,” The Raw Story, March 30, 2012, http://www.rawstory.com/rs/2012/03/30/new-york-police-officers-defy-order-to-cut-marijuana-arrests/ (accessed October 15, 2012); Testimony of The Legal Aid Society, “In Support of: Res. 986-A - Resolution Supporting the Governor’s Proposal to Amend the Penal Law to Make Possession of a Small Quantity of Marijuana in Public View a Violation, Applauding the Speaker of the Assembly for His Support of the Proposal, and Calling Upon the Senate to Pass Legislation enacting the Same,” public hearing before the New York City Council Public Safety Committee, June 12, 2012, http://www.legal-aid.org/media/157208/testimony_061212.pdf.
[32] NYC Youth Risk Behavior Survey 2011, New York City Department of Health and Mental Hygiene, “Marijuana (30 days) by Race/Ethnicity, 2011,” https://a816-healthpsi.nyc.gov/SASStoredProcess/guest?_PROGRAM=%2FEpiQuery%2Fyrbs%2Fyrbs&year=2011&var=mariju2&qtype=strat&strat1=rraces5&strat2=none&bivar=sadsad2&year2=trend (accessed October 19, 2012). National data gathered by the Centers for Disease Control and Prevention indicate slightly higher rates (by about 1 percent) of marijuana use among African Americans than among whites, and both are slightly higher than Hispanics (The NSDUH Report, National Survey on Drug Use and Health, “Illicit Drug Use, by Race/Ethnicity, in Metropolitan and Non-Metropolitan Counties: 2004 and 2005,” June 21, 2007).
[33] Harry G. Levine, “Memo (in Lieu of Testimony) Regarding State Senate Bill 5187, Marijuana Possession Arrests in New York, 1977-2010,” http://dragon.soc.qc.cuny.edu/Staff/levine/Testimony-Memo-NYS-Senate-Marijuana-Arrests-June-2011.pdf. For example, Levine found that in the wealthy and overwhelmingly white 19th precinct on the upper-east side of Manhattan, the rate of marijuana possession arrests was 16 per 100,000. In Ocean-Hill Brownsville, a predominantly African American and Latino community, the rate is 155 times that.
[34] Ibid.
[35] Ibid., p. 2.
[36] Levine and Small, “Marijuana Arrest Crusade: Racial Bias and Police Policy in New York City, 1997-2007,” http://www.nyclu.org/files/MARIJUANA-ARREST-CRUSADE_Final.pdf; Harry G. Levine and Deborah Peterson Small, “New York City’s Marijuana Arrest Crusade Continues,” September 2009, http://www.drugpolicy.org/resource/new-york-citys-marijuana-arrest-crusadecontinues (accessed October 15, 2012).
[37] Amanda Geller and Jeffrey Fagan, “Pot as Pretext: Marijuana, Race, and the New Disorder in New York City Street Policing.” Journal of Empirical Legal Studies, vol. 7, no. 4(2010), p. 606.
[38]Human Rights Watch, Decades of Disparity: Drug Arrests and Race in the United States, March 2009, http://www.hrw.org/sites/default/files/reports/us0309web_1.pdf; Human Rights Watch, Targeting Blacks: Drug Law Enforcement and Race in the United States, May 2008, http://www.hrw.org/sites/default/files/reports/us0508_1.pdf;Human Rights Watch, Punishment and Prejudice: Racial Disparities in the War on Drugs, vol. 12, no. 2(G), May 2000, http://www.hrw.org/legacy/reports/2000/usa/.
[39] See generally, Jamie Fellner, “Race, Drugs, and Law Enforcement in the United States,” Stanford Law and Policy Review, vol. 20, no. 2(2009).
[40] See Geller and Fagan, “Pot as Pretext: Marijuana, Race, and the New Disorder in New York City Street Policing,” Journal of Empirical Legal Studies; Andrew Golub, Bruce D. Johnson and Eloise Dunlap, "The Race/Ethnicity Disparity in Misdemeanor Marijuana Arrests in New York City," Criminology & Public Policy, vol. 6, no. 1(2007), pp. 131-164; Bernard E. Harcourt and Jens Ludwig, "Reefer Madness: Broken Windows Policing and Misdemeanor Marijuana Arrests in New York City, 1989-2000," Criminology & Public Policy, vol. 6, no. 1(2007), pp. 165–181.
[41] Sean Gardiner, “Buy and Bust: New York City’s War on Drugs at 40,” City Limits, vol. 33, no. 2(2009), p.30. For other officials claiming marijuana arrests reduce violent crime, see, e.g., Elizabeth A. Harris, “Minor Marijuana-Possession Charges Require Public View,” The New York Times, September 23, 2011, http://www.nytimes.com/2011/09/24/nyregion/minor-marijuana-possession-charges-require-public-view.html?_r=1&emc=eta1 (accessed Sep 26, 2011)("Under Mayor Michael R. Bloomberg, the number of low-level marijuana arrests has increased significantly…. [I]n the past, mayoral aides have said such arrests helped fight more serious crime, like the violence that tends to trail drugs…. In a March appearance before the City Council, Mr. Kelly reiterated the Bloomberg administration's position that arrests for having marijuana in public view have helped keep crime low.”); Kate Taylor, “Advocates Plan to Press 2013 Candidates on Police Practices,” The New York Times, February 21, 2012, http://www.nytimes.com/2012/02/22/nyregion/advocates-plan-to-press-2013-candidates-on-police-practices.html (accessed October 24, 2012)(“Mr. Bloomberg has defended the practice [of stop and frisks], calling it an effective crime-fighting tool and rejecting assertions that police officers target minorities. In an e-mail, Paul J. Browne, a spokesman for the Police Department, said that curtailing what he called effective police practices like stop-and-frisk ‘could have unintended consequences, since they now save lives, particularly among young men of color, who are disproportionately the victims of gun violence.’”); "Pot arrests in New York City at a 10-year high," AM NewYork, February 1, 2012,
http://www.amny.com/urbanite-1.812039/pot-arrests-in-new-york-city-at-a-10-year-high-1.3496797 (accessed October 24, 2012)(Responding to reports that Mayor Michael Bloomberg has made more arrests than any mayor in the history of New York City or in the history of America, “A spokesman for Bloomberg said critics of the Mayor and NYPD ‘seem to omit the fact that the last decade was also the safest in city history.’”).
[42] Jim Dwyer, “Altering a Law the Police Use Prolifically,” The New York Times, June 5, 2012, http://www.nytimes.com/2012/06/06/nyregion/altering-a-law-the-police-use-prolifically.html (accessed October 29, 212).
[43] Heather Mac Donald, “Pot Possession and the Police: Reforming marijuana laws is one thing; demonizing the NYPD is another,” City Journal, June 7, 2012, http://www.city-journal.org/2012/eon0607hm.html (accessed October 29, 2012). See also Heather Mac Donald, “It’s the Cops, Stupid!,” The New Republic, February 2, 2012, http://www.tnr.com/book/review/franklin-zimring-new-york-urban-crime-control-city-safe (accessed October 22, 2012).
[44] Harcourt and Ludwig, supra note___. The authors concluded, “As Golub et al. document well, the focus on MPV has had a significant disparate impact on African-American and Hispanic residents. Our study further shows that there is no good evidence that it contributed to combating serious crime in the city. If anything, it has had the reverse effect. As a result, the NYPD policy of misdemeanor MPV arrests represents an extremely poor trade-off of scarce law enforcement resources…”
[45] Broken windows policing is named after the seminal article of that name in which the authors argued that unchecked physical and social disorder give rise to pervasive fear and foment the conditions of serious crime. George L. Kelling and James Q. Wilson, “Broken Windows: The Police and Neighborhood Safety,” The Atlantic, March 1982, http://www.theatlantic.com/magazine/archive/1982/03/broken-windows/4465/ (accessed July 11, 2012). There is debate about whether the policing tactics adopted in New York City over the past 15 years are properly termed “quality of life” (see, e.g., Franklin E. Zimring, The City that Became Safe: New York’s Lessons for Urban Crime and Its Control (New York: Oxford University Press, 2011); Mac Donald, "It’s the Cops, Stupid!," The New Republic , http://www.tnr.com/book/review/franklin-zimring-new-york-urban-crime-control-city-safe). In any case, the Broken Windows thesis has been cited by the police department in formulating its tactics (see, e.g., New York City Police Department, “Police Strategy No. 5: Reclaiming the Public Spaces of New York,” BM 693-5 (8-94), 1994.).
[46] See, e.g., Heather Mac Donald, “New York’s Indispensable Institution: The NYPD’s Crime-Fighting Sparked the City’s Economic Revival and is Essential to its Future,” City Journal, July 7, 2009, http://www.city-journal.org/2009/nytom_nypd.html (accessed October 15, 2012)(“smoking marijuana in public does contribute to a sense of a neighborhood being out of control, where you have public disregard for the law. There is an argument for being concerned about open marijuana use.”). But see, Bernard E. Harcourt, Illusion of Order: The False Promise of Broken Windows Policing (Cambridge and London: Harvard University Press, 2001); Geller and Fagan, “Pot as Pretext: Marijuana, Race, and the New Disorder in New York City Street Policing,” Journal of Empirical Legal Studies.
[47] Jack Maple and Christopher Mitchell, The Crime Fighter: Putting the Bad Guys Out of Business (New York: Broadway Books, 1999), pp. 155-56, “[W]e need to be more selective about who we were arresting on quality-of-life infractions. When a team of cops fills up a van with arrestees, the booking process can take those cops out of service for a whole day in some cities. The public can’t afford to lose that much police protection for a bunch of first-time offenders, so the units enforcing quality-of-life laws much be sent where the maps show concentrations of crime or criminals, and the rules governing the stops have to be designed to catch the sharks, not the dolphins.”
[48] Franklin E. Zimring, “How To Stop Urban Crime Without Jail Time,” The Wall Street Journal, January 28, 2012, http://online.wsj.com/article/SB10001424052970203806504577181291838644350.html (accessed October 29, 2012).
[49] See, e.g., Ray Rivera, Al Baker and Janet Roberts, “A Few Blocks, 4 Years, 52,000 Police Stops,” The New York Times, July 11, 2010, http://www.nytimes.com/2010/07/12/nyregion/12frisk.html?_r=0&adxnnl=1&pagewanted=2&adxnnlx=1350658938-LUAFl2b2e5bME50Nrsh/vgBy (accessed October 19, 2012).Arrests for a marijuana violation are not as useful from this perspective as arrests on misdemeanor charges. The marijuana violation, PL 221.05, is not a printable offense, which means fingerprints can only be taken for purposes of identification if the arrestee’s identity is in question. Charging for a misdemeanor also avoids the provision in the Marihuana Reform Act of 1977, which explicitly directed officers to issue appearance tickets, as opposed to effectuating full arrests, when the sole charge is a marijuana violation (New York Penal Law § 221.05). Appearance ticket; certain cases, New York Criminal Procedure Law § 150.75.
[50]See Zimring, The City that Became Safe: New York’s Lessons for Urban Crime and Its Control, p. 122(discussing the patterns of arrest for marijuana in New York City relative to underlying patterns of marijuana use).
[51]Levine does not believe the desire to obtain the identifying information is a major motivation for the arrests, but it is one of the motivations, along with, for example, showing high productivity and performance through high arrest numbers. Levine and Small, “Marijuana Arrest Crusade: Racial Bias and Police Policy in New York City, 1997-2007,” http://www.nyclu.org/files/MARIJUANA-ARREST-CRUSADE_Final.pdf. Levine and Small also suggest that massive marijuana possession arrests “produce arrest numbers that show productivity.” Ibid., p. 5. See also, Chris Smith, “What’s Eating the NYPD,” New York Magazine, April 8, 2012, http://nymag.com/news/features/nypd-2012-4/index1.html (accessed September 11, 2012).
[52] See, e.g., Rivera, Baker, and Roberts, “A Few Blocks, 4 Years, 52,000 Police Stops,” The New York Times, http://www.nytimes.com/2010/07/12/nyregion/12frisk.html?_r=0&adxnnl=1&pagewanted=2&adxnnlx=1350658938-LUAFl2b2e5bME50Nrsh/vg. “In each of those [SQF] encounters, officers logged the names of those stopped — whether they were arrested or not — into a police database that the police say is valuable in helping solve future crimes.” See also, Bob Herbert, “Watching Certain People,” The New York Times, March 2, 2010, http://www.nytimes.com/2010/03/02/opinion/02herbert.html (accessed Oct 29, 2012), in which Commissioner Kelly asserted the value of this massive database: “Information contained in the stop, question and frisk database remains there indefinitely, for use in future investigations.” In 2010 New York State’s Criminal Procedure Law was amended to prohibit this practice of electronic recording of identifying information of a person subjected to temporary questioning or search in a public place (see Temporary questioning of persons in public places; search for weapons, New York Criminal Procedure Law § 140.50(4)). The marijuana violation, Penal Law 221.05, is not a printable offense, which means fingerprints can only be taken for purposes of identification if the arrestee’s identity is in question. Charging for a misdemeanor also avoids the provision in the Marihuana Reform Act of 1977, which explicitly directed officers to issue appearance tickets, as opposed to effectuating full arrests, when the sole charge is a marijuana violation (New York Penal Law 221.05). New York Criminal Procedure Law § 150.75.
[53] Harry G. Levine, “Memo (in Lieu of Testimony) Regarding State Senate Bill 5187, Marijuana Possession Arrests in New York, 1977-2010,” http://dragon.soc.qc.cuny.edu/Staff/levine/Testimony-Memo-NYS-Senate-Marijuana-Arrests-June-2011.pdf.
[54] Heather McDonald has suggested low-level arrests forestall future crime that is relatively imminent: “The police are interacting with potential felony offenders before they actually commit a felony, by accosting and sometimes arresting people for low-level quality-of-life offenses or questioning them for suspicious behavior. If someone is drinking in public, an officer may simply warn him regarding his violation and pour out his whiskey, or the officer may issue a summons. In either case, an interaction at 11 a.m. may avert a stabbing at 11 p.m., when the whiskey drinker is good and drunk.” Mac Donald, “It’s the Cops, Stupid!,” The New Republic, http://www.tnr.com/book/review/franklin-zimring-new-york-urban-crime-control-city-safe. See also, Hope Corman and Naci Mocan, “Carrots, Sticks, and Broken Windows,” The Journal of Law and Economics, vol. 48(2005), pp. 235-266, arguing that incapacitation is a highly unlikely mechanism through which misdemeanor arrests generally could reduce serious crime because on average the arrestees spend little time in custody.
[55] The theory of deterrence is that criminal sanctions – if they are swift, sure, and severe enough —can cause individuals to refrain from committing crimes in the future that they otherwise had a propensity and willingness to commit. We are not aware of any research that has proved – or disproved – the possibility that low-level marijuana arrests and the sanctions that typically follow such arrests (e.g., dismissals, adjournments in contemplation of dismissal, or convictions with little or no jail time) deter people from committing marijuana offenses or more serious crimes in the future.
[56] K. Babe Howell, "Broken Lives from Broken Windows: The Hidden Costs of Aggressive Order-Maintenance Policing," NYU Review of Law & Social Change.
[57] However, there were also four individuals who had zero felony convictions, but a single “Youthful Offender Adjudication” where the top charge was a felony crime (see Youthful Offender Procedure, New York Criminal Procedure Law Article 720).
[58]See Methodological Appendix. Among those with no criminal convictions, there were 7,719 individuals who had convictions of non-criminal violations or infractions.
[59] Of the two cohort members who were convicted of Class A drug felonies, one had a single felony conviction for a class A drug offense and no other felony convictions and the other had two felony convictions, one of which was a class A drug felony; neither individual had violent felony convictions.
[60] Violent felony offenses include the major street crimes such as most charges of robbery, burglary, murder, rape, serious assault, and also many sex offenses and weapons possession charges. See Methodological Appendix for definition of violent felony offense.
[61] Individuals convicted of felonies may also have been convicted of misdemeanors.
[62]Individuals convicted of non-injurious misdemeanors but no violent felonies may also have had other non-injurious or nonviolent criminal convictions.
[63] Using the unit of analysis of conviction, and not the individual, over 90 percent of all the convictions for injurious misdemeanors among the cohort were for these offenses.
[64] Nor do we have detailed data on these arrestee’s educational background or socioeconomic status; our descriptive data is limited to the age, sex, and race or ethnic indicators at the time of arrest.
[65] See Table One for the demographic profile of the MJACD cohort.
[66] Bruce Western, Punishment and Inequality in America (New York: Russell Sage Foundation, 2006), pp. 26-27. Of course these numbers underestimate the cumulative risk of a felony conviction for this age cohort since not all felony convictions result in a prison sentence.
[67] Sarah Shannon et al., Population Association of America, "Growth in the U.S. Ex-Felon and Ex-Prisoner Population, 1948 to 2010," April 2011, http://paa2011.princeton.edu/papers/111687 (accessed October 16, 2012); Christopher Uggen, Jeff Manza and Melissa Thompson, "Citizenship, Democracy, and the Civic Reintegration of Criminal Offenders," Annals of the American Academy of Political and Social Science, vol. 65, no. 1(2006), pp. 281-310. The cross-sectional estimates are approximating the number of people in the entire adult population of each demographic group that has a felony conviction in a given year.
[68] Geller and Fagan, “Pot as Pretext: Marijuana, Race, and the New Disorder in New York City Street Policing,” Journal of Empirical Legal Studies, p. 591.
[69] The district attorney may make a motion to block sealing in “the interests of justice” to the court upon notice to the defendant and his or her attorney within a specified time period after disposition; the court may also make its own motion to the same end upon notice to the defendant and his or her attorney. New York Criminal Procedure Law § 160.50(1).
[70] Thus, unlike prints taken from an arrest that terminated in other forms of dismissal, fingerprints taken from an arrest that terminated in a MJACD are maintained in the state’s comprehensive biometric database, called Statewide Automated Biometric Identification System (SABIS) and transferred to and maintained in the FBI fingerprint database.
[71] Prosecutors can, and in some boroughs often do, demand a permanent waiver of sealing as a condition of violation pleas. New York Criminal Procedure Law § 160.55(1) provides that the district attorney or the judge can make a motion to not seal the conviction, and if the judge enters a do not seal order then DCJS will not seal the case or destroy the fingerprints (Order Upon Termination of Criminal Action by Conviction for Noncriminal Offense; Entry of Waiver; Administrative Findings, New York Criminal Procedure Law § 160.55). In addition, Criminal Procedure Law § 160.55 exempts certain violation and infraction convictions from eventual sealing, such as certain loitering charges for the purpose of engaging in a prostitution offense, (New York Penal Law § 240.37), operating a motor vehicle while under the influence of alcohol or drugs (New York Vehicle and Traffic Law § 1192), or harassment in the second degree (New York Penal Law § 240.26) committed against a family or household member.
[72] The case does not print on the rap sheet after the conditional discharge period, but court records are not sealed, whereas court records are sealed in Adjournment in Contemplation of Dismissal (ACD) dispositions (Adjournment in Contemplation of Dismissal, New York Criminal Procedure Law § 170.55). The judge also has the authority under 106.55 DNS.
[73] This data was provided by the New York State Division of Criminal Justice Services (DCJS) to Issa Kohler-Hausmann for an ongoing research project, in the interest of information exchange. The data was in the form of micro-level arrest incidents grouped by de-identified identification number. The analysis, opinions, findings, and conclusions expressed in this publication are those of the authors and not those of DCJS. Neither New York State nor DCJS assumes liability for its contents or use thereof.
[74] The only exception is for VFO convictions, where the file contained a variable for “underlying” VFO conviction so we could count as a violent felony conviction a conviction where the violent felony offense was technically a lower-grade offense than the top conviction charge.
[75] This does sometimes happen despite statutory bar.