
V. Changes between 1996 and 2003
We have compared data from 1996, covered in our earlier report Punishment and Prejudice, with the results from our analysis here of the 2003 data.51 Although racial disparities in rates of incarceration for drug offenders diminished to some extent in most of the reporting states, a comparison of the total rates for 1996 and 2003 indicates a slight worsening of the disparity nationwide.
Racial Disparities 1996-2003
As shown in Table 6, both black and white rates of prison admissions for drug offenses dropped during this period, although that of whites dropped by a bigger percentage. The black rate of prison admissions for drug offenses decreased 11.4 percent from 1996 to 2003, from 289.4 to 256.2 per 100,000 black adults. The white rate of prison admissions for drug offenses decreased by 13.2 percent, from 29.1 to 25.3 per 100,000 white adults. The white rate of prison admissions for drug offenses increased in 31 states between 1996 and 2003, and the black rate of admission increased in 18.
The racial disparity reflected in the ratio of black-to-white drug offender prison admission rates decreased in 30 of the 34 states, but it increased in states with large populations such as New York and California. (Table 7). The net result is that the racial disparity among the rates of drug offender prison admissions across the 34 states in 2003 appears to have increased slightly. In 1996 the black drug offender prison admission rate was 9.9 times greater than that of whites. In 2003 it was 10.1 times greater. (Table 7). This slight increase in the ratio of black and white rates may, however, reflect changes or errors in data reporting by the states, rather than a real increase in the disparity.
There was little change in the racial composition of drug offender prison admissions between 1996 and 2003. (Table 8). Taking the 34 reporting states together, the black proportion of drug admissions to prison remained at 53.5 percent. The white proportion of drug admissions decreased from 35.8 percent to 33.3 percent, while the proportion of drug offenders characterized as “other” increased from 10.6 percent to 13.2 percent.
The role of drug offenses in sending blacks and whites to prison did not change markedly between 1996 and 2003. As shown in Table 9, drug offenses accounted for 25 percent of all whites sent to prison in 1996, and 25.4 percent in 2003. For blacks the increase was slightly greater: drug offenses accounted for 36.8 percent of all blacks sent to prison in 1996 and 38.2 percent in 2003. The proportion of drug offenders among all whites sent to prison increased in 29 states, whereas it increased among black offenders in only 20 states.
Among the individual states, there were some notable changes in rates of prison admission for white and black drug offenders during this period:
- The white rate of drug offender prison admissions increased by more than 100 percent in 13 states. (Table 6).
- The three states with the largest increases in prison admission rates for white drug offenders were Minnesota (271.7 percent), Mississippi (275.4 percent), and Tennessee (604.5 percent). (Table 6).
- The rate of prison admissions for black drug offenders increased by more than 100 percent in three states (North Dakota, South Dakota, and Tennessee), and decreased by more than 50 percent in three states (California, New Hampshire, and Oregon). (Table 6).
- Two states had significant increases in the black-to-white ratio of drug offender prison admissions rates: California (ratio worsened by 61.5 percent) and New York (ratio worsened by 41.6 percent). In both states, the black and white rates of admission to prison for drug offenders decreased between 1996 and 2003, but the white rate decreased more than the black rate. (Tables 6, 7).
Table 6: Rates of Prison Admissions for Drug Offenses, by Race, 1996 and 2003
(Rates calculated per 100,000 residents of each race)
|
State |
|
White |
|
|
Black |
|
|
|
1996 |
2003 |
% Change |
1996 |
2003 |
% Change |
|
Alabama |
19.5 |
50.6 |
160.0% |
171.3 |
177.2 |
3.5% |
|
California |
121.7 |
26.5 |
-78.3% |
799.7 |
280.8 |
-64.9% |
|
Colorado |
11.4 |
20.4 |
79.5% |
287.4 |
294.8 |
2.6% |
|
Florida |
14.5 |
27.5 |
89.5% |
257.7 |
321.5 |
24.7% |
|
Georgia |
13.9 |
33.9 |
143.3% |
133.2 |
169.9 |
27.5% |
|
Hawaii |
10.8 |
14.2 |
31.8% |
52.1 |
82.5 |
58.3% |
|
Illinois |
10.9 |
26.0 |
137.9% |
569.5 |
613.8 |
7.8% |
|
Iowa |
12.9 |
29.3 |
126.8% |
377.6 |
224.3 |
-40.6% |
|
Kentucky |
27.4 |
63.1 |
130.4% |
450.2 |
392.3 |
-12.9% |
|
Louisiana |
19.2 |
27.8 |
45.0% |
218.3 |
202.9 |
-7.1% |
|
Maryland |
10.9 |
21.3 |
95.9% |
265.3 |
370.5 |
39.6% |
|
Michigan |
6.9 |
9.0 |
31.8% |
133.7 |
106.3 |
-20.5% |
|
Minnesota |
6.2 |
23.1 |
271.7% |
266.1 |
233.6 |
-12.2% |
|
Mississippi |
21.1 |
79.2 |
275.4% |
154.4 |
239.4 |
55.0% |
|
Missouri |
13.4 |
35.4 |
164.6% |
82.8 |
95.4 |
15.3% |
|
Nebraska |
19.7 |
35.9 |
82.1% |
283.3 |
166.2 |
-41.3% |
|
Nevada |
19.1 |
17.6 |
-8.1% |
170.0 |
115.5 |
-32.1% |
|
New Hampshire |
11.5 |
13.3 |
15.7% |
238.7 |
95.2 |
-60.1% |
|
New Jersey |
15.4 |
19.9 |
29.2% |
410.1 |
409.4 |
-0.2% |
|
New York |
22.2 |
11.3 |
-49.1% |
224.6 |
161.8 |
-28.0% |
|
North Carolina |
14.0 |
24.2 |
72.1% |
308.2 |
264.2 |
-14.3% |
|
North Dakota |
15.4 |
54.4 |
253.1% |
78.9 |
209.2 |
165.3% |
|
Oklahoma |
33.9 |
88.3 |
160.3% |
252.0 |
392.4 |
55.7% |
|
Oregon |
9.9 |
11.4 |
15.2% |
112.5 |
47.5 |
-57.8% |
|
Pennsylvania |
9.2 |
14.8 |
60.4% |
134.1 |
193.7 |
44.5% |
|
South Carolina |
14.4 |
28.0 |
95.2% |
223.2 |
260.0 |
16.5% |
|
South Dakota |
28.0 |
58.8 |
110.0% |
225.4 |
526.3 |
133.5% |
|
Tennessee |
3.1 |
22.0 |
604.5% |
26.3 |
184.7 |
601.6% |
|
Texas |
13.0 |
19.7 |
51.5% |
222.2 |
230.2 |
3.6% |
|
Utah |
20.9 |
42.8 |
104.9% |
196.5 |
322.4 |
64.1% |
|
Virginia |
14.6 |
17.4 |
19.6% |
276.0 |
229.4 |
-16.9% |
|
Washington |
33.7 |
44.7 |
32.7% |
520.5 |
449.7 |
-13.6% |
|
West Virginia |
5.0 |
8.6 |
69.9% |
129.0 |
140.0 |
8.5% |
|
Wisconsin |
6.8 |
8.0 |
17.6% |
340.2 |
340.3 |
0.0% |
|
Total* |
29.1 |
25.3 |
-13.2% |
289.4 |
256.2 |
-11.4% |
Source: National Corrections Reporting Program, 2003.
* Total calculated on basis of 34 reporting states.
Table 7: Ratio of Black:White Rates of Prison Admissions for Drug Offenses, 1996 and 2003
(Rates calculated per 100,000 residents)
|
State |
Black/White |
Black/White |
% Change |
|
|
1996 |
2003 |
1996-2003 |
|
Alabama |
8.8 |
3.5 |
-60.2% |
|
California |
6.6 |
10.6 |
61.5% |
|
Colorado |
25.3 |
14.4 |
-42.9% |
|
Florida |
17.8 |
11.7 |
-34.2% |
|
Georgia |
9.6 |
5.0 |
-47.6% |
|
Hawaii |
4.8 |
5.8 |
20.1% |
|
Illinois |
52.1 |
23.6 |
-54.7% |
|
Iowa |
29.2 |
7.7 |
-73.8% |
|
Kentucky |
16.4 |
6.2 |
-62.2% |
|
Louisiana |
11.4 |
7.3 |
-35.9% |
|
Maryland |
24.4 |
17.4 |
-28.7% |
|
Michigan |
19.5 |
11.8 |
-39.7% |
|
Minnesota |
42.8 |
10.1 |
-76.4% |
|
Mississippi |
7.3 |
3.0 |
-58.7% |
|
Missouri |
6.2 |
2.7 |
-56.4% |
|
Nebraska |
14.4 |
4.6 |
-67.8% |
|
Nevada |
8.9 |
6.6 |
-26.1% |
|
New Hampshire |
20.7 |
7.1 |
-65.5% |
|
New Jersey |
26.6 |
20.6 |
-22.8% |
|
New York |
10.1 |
14.3 |
41.6% |
|
North Carolina |
22.0 |
10.9 |
-50.2% |
|
North Dakota |
5.1 |
3.8 |
-24.9% |
|
Oklahoma |
7.4 |
4.4 |
-40.2% |
|
Oregon |
11.3 |
4.1 |
-63.4% |
|
Pennsylvania |
14.5 |
13.1 |
-9.9% |
|
South Carolina |
15.5 |
9.3 |
-40.3% |
|
South Dakota |
8.1 |
9.0 |
11.2% |
|
Tennessee |
8.4 |
8.4 |
-0.4% |
|
Texas |
17.0 |
11.7 |
-31.6% |
|
Utah |
9.4 |
7.5 |
-19.9% |
|
Virginia |
19.0 |
13.2 |
-30.5% |
|
Washington |
15.5 |
10.1 |
-34.9% |
|
West Virginia |
25.6 |
16.3 |
-36.2% |
|
Wisconsin |
49.8 |
42.4 |
-14.9% |
|
Total* |
9.9 |
10.1 |
2.0% |
Source: National Corrections Reporting Program, 2003.
* Total calculated on basis of 34 reporting states.
Table 8: Racial Composition of Prison Admissions for Drug Offenses, 1996 and 2003
|
State |
|
1996 |
|
|
2003 |
|
|
|
White |
Black |
Other |
White |
Black |
Other |
|
Alabama |
26.6% |
73.1% |
0.3% |
46.2% |
53.6% |
0.2% |
|
California |
55.3% |
33.3% |
11.5% |
30.3% |
27.1% |
42.6% |
|
Colorado |
28.4% |
30.5% |
41.1% |
42.2% |
25.3% |
32.6% |
|
Florida |
27.2% |
71.3% |
1.5% |
33.6% |
64.0% |
2.4% |
|
Georgia |
22.4% |
77.1% |
0.4% |
33.1% |
66.2% |
0.7% |
|
Hawaii |
24.8% |
9.8% |
65.4% |
16.8% |
6.9% |
76.3% |
|
Illinois |
9.5% |
82.4% |
8.1% |
18.4% |
74.9% |
6.7% |
|
Iowa |
60.7% |
31.1% |
8.2% |
85.3% |
13.4% |
1.4% |
|
Kentucky |
45.7% |
54.1% |
0.2% |
67.8% |
31.9% |
0.3% |
|
Louisiana |
17.2% |
82.2% |
0.6% |
23.3% |
76.3% |
0.5% |
|
Maryland |
9.8% |
87.6% |
2.5% |
12.1% |
87.0% |
0.9% |
|
Michigan |
24.8% |
75.1% |
0.1% |
34.6% |
64.6% |
0.7% |
|
Minnesota |
48.2% |
50.1% |
1.7% |
68.9% |
26.1% |
5.0% |
|
Mississippi |
21.6% |
78.3% |
0.1% |
38.6% |
61.0% |
0.3% |
|
Missouri |
58.6% |
40.9% |
0.5% |
62.5% |
37.1% |
0.4% |
|
Nebraska |
64.8% |
34.0% |
1.2% |
81.2% |
15.0% |
3.8% |
|
Nevada |
43.4% |
29.5% |
27.1% |
45.1% |
23.9% |
31.0% |
|
New Hampshire |
86.7% |
12.4% |
0.9% |
88.7% |
5.6% |
5.6% |
|
New Jersey |
16.5% |
72.3% |
11.1% |
19.7% |
69.8% |
10.5% |
|
New York |
24.5% |
52.1% |
23.4% |
19.1% |
59.5% |
21.4% |
|
North Carolina |
14.4% |
83.2% |
2.4% |
23.8% |
69.7% |
6.5% |
|
North Dakota |
83.3% |
2.4% |
14.3% |
83.2% |
2.0% |
14.8% |
|
Oklahoma |
53.7% |
32.3% |
14.0% |
63.3% |
24.6% |
12.2% |
|
Oregon |
46.9% |
9.2% |
43.9% |
84.3% |
6.2% |
9.5% |
|
Pennsylvania |
41.4% |
58.5% |
0.1% |
41.4% |
58.2% |
0.4% |
|
South Carolina |
14.2% |
85.5% |
0.2% |
21.4% |
76.9% |
1.8% |
|
South Dakota |
90.2% |
4.6% |
5.2% |
83.3% |
5.5% |
11.2% |
|
Tennessee |
40.1% |
59.2% |
0.8% |
38.0% |
58.6% |
3.4% |
|
Texas |
21.4% |
50.3% |
28.4% |
29.8% |
46.6% |
23.6% |
|
Utah |
89.9% |
7.4% |
2.7% |
90.8% |
6.4% |
2.8% |
|
Virginia |
18.0% |
81.3% |
0.8% |
23.1% |
75.5% |
1.4% |
|
Washington |
60.3% |
32.4% |
7.2% |
68.8% |
25.6% |
5.5% |
|
West Virginia |
55.3% |
43.9% |
0.8% |
65.2% |
34.3% |
0.6% |
|
Wisconsin |
28.7% |
69.4% |
2.0% |
29.9% |
68.7% |
1.4% |
|
Total* |
35.8% |
53.5% |
10.6% |
33.3% |
53.5% |
13.2% |
Source: National Corrections Reporting Program, 1996 and 2003.
* Total calculated on basis of 34 reporting states.
Table 9: Prison Admissions for Drug Offenses as a Percentage of All Admissions, by Race, 1996 and 2003
|
State |
|
White |
|
|
Black |
|
|
|
1996 |
2003 |
% Change |
1996 |
2003 |
% Change |
|
Alabama |
20.1% |
31.2% |
55.7% |
31.9% |
32.4% |
1.6% |
|
California |
33.6% |
29.2% |
-13.2% |
36.9% |
32.8% |
-11.1% |
|
Colorado |
15.3% |
23.3% |
52.4% |
32.1% |
37.3% |
16.4% |
|
Florida |
14.0% |
20.5% |
47.1% |
34.0% |
38.8% |
14.3% |
|
Georgia |
17.3% |
29.5% |
70.5% |
31.8% |
34.0% |
7.0% |
|
Hawaii |
10.9% |
13.6% |
25.2% |
23.6% |
31.4% |
32.7% |
|
Illinois |
15.3% |
25.3% |
65.5% |
47.1% |
47.5% |
0.9% |
|
Iowa |
11.9% |
32.9% |
176.8% |
22.1% |
21.4% |
-3.4% |
|
Kentucky |
19.3% |
30.8% |
59.8% |
44.6% |
39.2% |
-12.0% |
|
Louisiana |
20.3% |
28.1% |
38.6% |
33.8% |
43.9% |
29.8% |
|
Maryland |
11.3% |
22.8% |
102.1% |
26.1% |
50.9% |
94.6% |
|
Michigan |
10.1% |
11.2% |
11.1% |
28.5% |
22.5% |
-21.3% |
|
Minnesota |
13.5% |
35.3% |
162.1% |
22.6% |
28.3% |
25.5% |
|
Mississippi |
21.7% |
35.3% |
62.9% |
33.1% |
36.3% |
9.7% |
|
Missouri |
17.0% |
31.1% |
82.7% |
20.2% |
37.5% |
85.9% |
|
Nebraska |
22.0% |
31.1% |
41.9% |
29.4% |
18.9% |
-35.6% |
|
Nevada |
15.3% |
16.2% |
6.0% |
23.6% |
18.8% |
-20.2% |
|
New Hampshire |
18.4% |
19.9% |
8.1% |
60.9% |
21.1% |
-65.4% |
|
New Jersey |
29.5% |
32.2% |
9.3% |
50.0% |
55.0% |
10.0% |
|
New York |
39.9% |
25.9% |
-35.2% |
48.8% |
44.6% |
-8.6% |
|
North Carolina |
10.4% |
14.4% |
38.3% |
33.2% |
27.6% |
-16.9% |
|
North Dakota |
21.1% |
42.3% |
100.0% |
20.0% |
16.2% |
-18.9% |
|
Oklahoma |
25.0% |
44.5% |
78.4% |
31.8% |
43.6% |
37.1% |
|
Oregon |
10.9% |
14.8% |
36.1% |
11.7% |
13.4% |
14.0% |
|
Pennsylvania |
26.1% |
25.2% |
-3.2% |
33.8% |
43.1% |
27.5% |
|
South Carolina |
10.7% |
16.7% |
55.4% |
30.1% |
31.8% |
5.6% |
|
South Dakota |
22.4% |
30.6% |
36.9% |
25.0% |
35.1% |
40.4% |
|
Tennessee |
12.6% |
18.8% |
48.9% |
36.3% |
30.5% |
-16.0% |
|
Texas |
18.4% |
25.7% |
39.5% |
37.6% |
38.8% |
3.1% |
|
Utah |
27.9% |
38.9% |
39.4% |
28.2% |
38.0% |
34.8% |
|
Virginia |
15.9% |
14.9% |
-6.5% |
38.2% |
32.2% |
-15.7% |
|
Washington |
32.6% |
31.9% |
-2.4% |
51.0% |
44.5% |
-12.9% |
|
West Virginia |
9.0% |
10.1% |
11.9% |
42.5% |
31.8% |
-25.3% |
|
Wisconsin |
17.2% |
19.7% |
14.9% |
37.8% |
44.9% |
19.0% |
|
Total* |
25.0% |
25.4% |
1.9% |
36.8% |
38.2% |
3.7% |
Source: National Corrections Reporting Program, 1996 and 2003.
*Total calculated on basis of 34 reporting states.
The increase in the rate of white drug offender admissions in 31 states between 1996 and 2003 may partially reflect the impact of the increased manufacturing and use of methamphetamine in the past decade.52For example, in 1994, an estimated 3,825,000 people age 12 and older had used methamphetamine for nonmedical purposes in their lifetime, and 760,000 had used it in the past year.53 By 2006, the estimated number of people who had used methamphetamine for nonmedical purposes in their lifetime had soared to 14,206,000, including 1,889,000 who had used it in the past year.54 The available data also suggests whites use methamphetamine far more than blacks. For example, in 2006, 6.9 percent of whites surveyed reported use of methamphetamine during their lifetime, compared to 1.9 percent of blacks. Translating these rates into numbers yields an estimate of 11,540,000 whites who have used methamphetamine, and 546,000 blacks.55 According to a study on racial disparities in Minnesota’s imprisonment rates, the disparity had indeed lessened recently due to the “imprisonment of Methamphetamine offenders who are predominately white.”56
Race and Gender 1996-2003
Tables 10 and 11 show the rates of drug offender prison admissions for men and for women, disaggregated by race, along with the percentage of change in those rates between 1996 and 2003. The rate for white men increased in 31 states, including in 13 states where the increase was over 100 percent. Nevertheless, the total white male rate declined over the period by 18.4 percent because of the marked decline in such large states as California and New York. The rate for black men decreased in 17 states, including in California and New York, and in only two states (Tennessee and North Dakota) did the growth exceed 100 percent. The net result was a decrease of 11.2 percent for the total black rate between 1996 and 2003. Because the rate for black men declined less than the rate of white men, the disparity between the two grew worse: as shown in Table 12, black men were sent to prison on drug charges at 10.8 times the rate of white men in 1996. In 2003, black men were sent to prison on drug charges at 11.8 times the rate of white men.
The pattern was different for women. Between 1996 and 2003, the rate for white women increased in 30 states. (Table 11). Although the increases in many states were significant—in 19 states the rate increased by more than 100 percent—the declines in California and New York kept the total increase to only 14 percent. The rate at which black women were sent to prison for drug offenses decreased in 21 states during this period—and where the rate increased, the growth was relatively small compared to the increases in white women’s rates. The result was a significant total decrease of 28.9 percent among black women entering prison for drug offenses. As a result of these changes, the ratio of rates at which black and white women were sent to prison for drug offenses decreased, dropping from 7.7 to 4.8. (Table 12). That is, the racial disparity in the women’s rates was reduced.
Because women are only a small percentage of prison drug admissions, the changes in the male rates have a much greater impact on the overall rates.
The changes—or lack thereof—in the total as well as state-specific figures between 1996 and 2003 reflect many factors, the analysis of which is beyond the scope of this report. We want to emphasize the huge impact that a large state, such as California, can have on the total figures for the 34 states. We also want to caution that to an unknown extent, the data may reflect changes in reporting methods by the states with regard to race and ethnicities.
Table 10: Male Rates of Prison Admissions for Drug Offenses, by Race, 1996 and 2003
(Rates calculated per 100,000 male residents)
|
State |
|
White |
|
|
Black |
|
|
|
1996 |
2003 |
% Change |
1996 |
2003 |
% Change |
|
Alabama |
34.0 |
83.5 |
145.3% |
341.1 |
363.6 |
6.6% |
|
California |
214.6 |
43.8 |
-79.6% |
1414.5 |
515.1 |
-63.6% |
|
Colorado |
19.1 |
31.9 |
67.1% |
471.0 |
456.5 |
-3.1% |
|
Florida |
25.1 |
44.9 |
78.9% |
507.4 |
628.2 |
23.8% |
|
Georgia |
23.4 |
55.5 |
137.1% |
268.3 |
345.3 |
28.7% |
|
Hawaii |
14.7 |
20.0 |
35.8% |
62.4 |
122.0 |
95.6% |
|
Illinois |
19.6 |
44.2 |
125.3% |
1116.2 |
1227.6 |
10.0% |
|
Iowa |
23.6 |
53.7 |
127.3% |
672.3 |
402.7 |
-40.1% |
|
Kentucky |
44.8 |
102.6 |
129.0% |
886.3 |
725.8 |
-18.1% |
|
Louisiana |
34.1 |
47.7 |
39.8% |
442.7 |
414.0 |
-6.5% |
|
Maryland |
18.6 |
39.7 |
113.3% |
541.5 |
760.5 |
40.4% |
|
Michigan |
12.1 |
16.3 |
34.2% |
274.2 |
218.8 |
-20.2% |
|
Minnesota |
11.3 |
40.8 |
262.6% |
466.6 |
412.1 |
-11.7% |
|
Mississippi |
38.8 |
132.4 |
241.6% |
322.1 |
477.7 |
48.3% |
|
Missouri |
24.1 |
60.9 |
152.4% |
173.0 |
129.8 |
-24.9% |
|
Nebraska |
35.2 |
62.3 |
77.1% |
480.5 |
277.3 |
-42.3% |
|
Nevada |
30.6 |
26.6 |
-13.1% |
307.1 |
211.5 |
-31.1% |
|
New Hampshire |
20.2 |
24.2 |
20.0% |
363.5 |
167.0 |
-54.1% |
|
New Jersey |
28.4 |
34.7 |
22.3% |
829.0 |
822.1 |
-0.8% |
|
New York |
38.6 |
19.5 |
-49.5% |
432.9 |
333.9 |
-22.9% |
|
North Carolina |
22.8 |
36.7 |
60.7% |
606.8 |
519.5 |
-14.4% |
|
North Dakota |
27.7 |
90.1 |
225.6% |
68.4 |
281.7 |
311.5% |
|
Oklahoma |
54.1 |
143.7 |
165.6% |
433.8 |
684.0 |
57.7% |
|
Oregon |
16.4 |
19.4 |
18.0% |
205.9 |
66.8 |
-67.6% |
|
Pennsylvania |
17.8 |
27.6 |
54.7% |
277.9 |
407.7 |
46.7% |
|
South Carolina |
25.6 |
47.3 |
84.7% |
452.5 |
537.2 |
18.7% |
|
South Dakota |
47.7 |
99.5 |
108.7% |
304.9 |
597.6 |
96.0% |
|
Tennessee |
5.7 |
33.8 |
495.5% |
53.4 |
371.9 |
596.9% |
|
Texas |
20.5 |
31.1 |
51.7% |
387.5 |
430.6 |
11.1% |
|
Utah |
37.9 |
70.7 |
86.7% |
344.2 |
468.6 |
36.2% |
|
Virginia |
24.6 |
28.4 |
15.6% |
516.2 |
435.2 |
-15.7% |
|
Washington |
57.1 |
74.4 |
30.3% |
836.4 |
719.8 |
-13.9% |
|
West Virginia |
9.1 |
14.3 |
57.0% |
245.1 |
245.9 |
0.3% |
|
Wisconsin |
12.7 |
14.4 |
13.8% |
654.9 |
664.8 |
1.5% |
|
Total* |
51.6 |
42.1 |
-18.4% |
558.0 |
495.5 |
-11.2% |
Source: National Corrections Reporting Program, 1996 and 2003.
* Total calculated on basis of 34 reporting states.
Table 11: Female Rates of Prison Admissions for Drug Offenses, by Race, 1996 and 2003
(Rates calculated per 100,000 female residents)
|
State |
|
White |
|
|
Black |
|
|
|
1996 |
2003 |
% Change |
1996 |
2003 |
% Change |
|
Alabama |
6.2 |
19.9 |
223.1% |
36.7 |
26.1 |
-28.9% |
|
California |
29.5 |
9.2 |
-68.7% |
212.0 |
62.5 |
-70.5% |
|
Colorado |
4.0 |
8.9 |
124.6% |
99.6 |
117.2 |
17.6% |
|
Florida |
4.8 |
11.2 |
131.0% |
41.7 |
50.7 |
21.7% |
|
Georgia |
4.9 |
12.7 |
157.6% |
23.5 |
21.8 |
-7.4% |
|
Hawaii |
6.3 |
7.7 |
22.8% |
38.1 |
25.3 |
-33.6% |
|
Illinois |
2.8 |
8.5 |
203.5% |
120.5 |
109.4 |
-9.2% |
|
Iowa |
3.2 |
6.4 |
101.7% |
73.4 |
28.8 |
-60.8% |
|
Kentucky |
11.6 |
26.4 |
128.5% |
83.5 |
88.5 |
6.1% |
|
Louisiana |
5.4 |
9.1 |
68.1% |
37.8 |
27.4 |
-27.5% |
|
Maryland |
3.6 |
4.1 |
14.4% |
34.0 |
50.1 |
47.7% |
|
Michigan |
2.0 |
2.1 |
8.7% |
18.8 |
11.0 |
-41.5% |
|
Minnesota |
1.5 |
6.1 |
309.2% |
52.6 |
38.5 |
-26.9% |
|
Mississippi |
4.9 |
29.0 |
494.1% |
20.5 |
41.1 |
100.7% |
|
Missouri |
3.6 |
11.6 |
223.7% |
10.0 |
14.3 |
43.2% |
|
Nebraska |
5.4 |
10.6 |
96.0% |
105.1 |
60.7 |
-42.2% |
|
Nevada |
7.2 |
8.2 |
14.2% |
35.2 |
19.4 |
-44.9% |
|
New Hampshire |
3.4 |
3.1 |
-9.7% |
78.0 |
0.0 |
-100.0% |
|
New Jersey |
3.5 |
6.2 |
74.3% |
53.5 |
59.5 |
11.2% |
|
New York |
7.3 |
3.7 |
-49.4% |
55.7 |
24.1 |
-56.8% |
|
North Carolina |
5.8 |
12.2 |
108.5% |
63.0 |
50.7 |
-19.5% |
|
North Dakota |
3.5 |
19.2 |
453.9% |
93.0 |
91.5 |
-1.6% |
|
Oklahoma |
15.3 |
35.9 |
135.1% |
90.0 |
119.5 |
32.7% |
|
Oregon |
3.8 |
3.8 |
-0.2% |
10.7 |
24.7 |
130.7% |
|
Pennsylvania |
1.5 |
3.1 |
101.2% |
15.5 |
13.0 |
-16.2% |
|
South Carolina |
3.9 |
9.7 |
150.7% |
36.5 |
30.8 |
-15.7% |
|
South Dakota |
9.4 |
19.3 |
104.7% |
87.9 |
387.6 |
341.1% |
|
Tennessee |
0.8 |
10.9 |
1272.9% |
4.6 |
28.9 |
529.0% |
|
Texas |
6.0 |
8.6 |
45.1% |
73.9 |
51.4 |
-30.5% |
|
Utah |
4.6 |
15.2 |
231.5% |
0.0 |
117.7 |
-- |
|
Virginia |
5.1 |
6.9 |
36.0% |
65.2 |
49.5 |
-24.0% |
|
Washington |
10.9 |
15.6 |
42.9% |
167.4 |
133.5 |
-20.2% |
|
West Virginia |
1.4 |
3.3 |
132.7% |
30.9 |
32.4 |
4.9% |
|
Wisconsin |
1.4 |
1.9 |
38.0% |
64.6 |
51.5 |
-20.3% |
|
Total* |
8.0 |
9.1 |
14.0% |
61.9 |
44.0 |
-28.9% |
Source: National Corrections Reporting Program, 1996 and 2003.
*Total calculated on basis of 34 reporting states.
Table 12: Ratio of Black:White Rates of Prison Admissions for Drug Offenses by Gender, 1996 and 2003
(Rates calculated per 100,000 adult residents)
|
State |
|
1996 |
|
|
2003 |
|
|
|
|
Black:White |
|
|
Black:White |
|
|
|
Male |
Female |
All |
Male |
Female |
All |
|
Alabama |
10.0 |
6.0 |
8.8 |
4.4 |
1.3 |
3.5 |
|
California |
6.6 |
7.2 |
6.6 |
11.8 |
6.8 |
10.6 |
|
Colorado |
24.7 |
25.1 |
25.3 |
14.3 |
13.2 |
14.4 |
|
Florida |
20.2 |
8.6 |
17.8 |
14.0 |
4.5 |
11.7 |
|
Georgia |
11.5 |
4.8 |
9.6 |
6.2 |
1.7 |
5.0 |
|
Hawaii |
4.2 |
6.1 |
4.8 |
6.1 |
3.3 |
5.8 |
|
Illinois |
56.8 |
42.9 |
52.1 |
27.7 |
12.8 |
23.6 |
|
Iowa |
28.5 |
23.3 |
29.2 |
7.5 |
4.5 |
7.7 |
|
Kentucky |
19.8 |
7.2 |
16.4 |
7.1 |
3.4 |
6.2 |
|
Louisiana |
13.0 |
7.0 |
11.4 |
8.7 |
3.0 |
7.3 |
|
Maryland |
29.1 |
9.5 |
24.4 |
19.2 |
12.3 |
17.4 |
|
Michigan |
22.6 |
9.6 |
19.5 |
13.4 |
5.2 |
11.8 |
|
Minnesota |
41.5 |
35.0 |
42.8 |
10.1 |
6.3 |
10.1 |
|
Mississippi |
8.3 |
4.2 |
7.3 |
3.6 |
1.4 |
3.0 |
|
Missouri |
7.2 |
2.8 |
6.2 |
2.1 |
1.2 |
2.7 |
|
Nebraska |
13.7 |
19.5 |
14.4 |
4.4 |
5.8 |
4.6 |
|
Nevada |
10.0 |
4.9 |
8.9 |
8.0 |
2.4 |
6.6 |
|
New Hampshire |
18.0 |
22.8 |
20.7 |
6.9 |
0.0 |
7.1 |
|
New Jersey |
29.2 |
15.1 |
26.6 |
23.7 |
9.6 |
20.6 |
|
New York |
11.2 |
7.6 |
10.1 |
17.1 |
6.5 |
14.3 |
|
North Carolina |
26.6 |
10.8 |
22.0 |
14.2 |
4.2 |
10.9 |
|
North Dakota |
2.5 |
26.8 |
5.1 |
3.1 |
4.8 |
3.8 |
|
Oklahoma |
8.0 |
5.9 |
7.4 |
4.8 |
3.3 |
4.4 |
|
Oregon |
12.6 |
2.8 |
11.3 |
3.5 |
6.5 |
4.1 |
|
Pennsylvania |
15.6 |
10.1 |
14.5 |
14.8 |
4.2 |
13.1 |
|
South Carolina |
17.7 |
9.4 |
15.5 |
11.3 |
3.2 |
9.3 |
|
South Dakota |
6.4 |
9.3 |
8.1 |
6.0 |
20.0 |
9.0 |
|
Tennessee |
9.4 |
5.8 |
8.4 |
11.0 |
2.6 |
8.4 |
|
Texas |
18.9 |
12.4 |
17.0 |
13.9 |
5.9 |
11.7 |
|
Utah |
9.1 |
0.0 |
9.4 |
6.6 |
7.7 |
7.5 |
|
Virginia |
21.0 |
12.8 |
19.0 |
15.3 |
7.1 |
13.2 |
|
Washington |
14.6 |
15.3 |
15.5 |
9.7 |
8.5 |
10.1 |
|
West Virginia |
26.9 |
22.0 |
25.6 |
17.2 |
9.9 |
16.3 |
|
Wisconsin |
51.6 |
47.8 |
49.8 |
46.1 |
27.6 |
42.4 |
|
Total* |
10.8 |
7.7 |
9.9 |
11.8 |
4.8 |
10.1 |
Source: National Corrections Reporting Program, 1996 and 2003.
* Total calculated on basis of 34 reporting states.
VI. Origins of Racial Disparities in Prison Admissions for Drug Offenses
No doubt many Americans believe racial differences in imprisonment for drug offenses reflect racial differences in involvement with illegal drug activities—that blacks are sent to prison at higher rates on drug charges because they are more involved in drug offenses than whites. The heightened media and political attention to substance abuse and the drug trade in urban minority neighborhoods has promoted the public perception that illegal drugs are more prevalent in those neighborhoods than in more affluent white neighborhoods.57 The reality has long been the reverse. In absolute numbers, there are far more whites committing drug offenses than blacks. The disproportionate rates at which blacks are sent to prison for drug offenses compared to whites largely originate in racially disproportionate rates of arrest for drug offenses.58
Rates of Illegal Drug Activity
Use of illegal drugs, by definition, entails the drug offense of illegal possession. The best approximation of comparative rates of drug possession comes from federally-sponsored household surveys of drug use among Americans.59 Over the years, those surveys have suggested that whites and blacks use illicit drugs at roughly the same rates. For example, according to the most recent survey, an estimated 49 percent of whites and 42.9 percent of blacks age 12 or older have used illicit drugs in their lifetime; 14.5 percent of whites and 16 percent of blacks have used illicit drugs in the past year; and 8.5 percent of whites and 9.8 percent of blacks have used an illicit drug in the past month (those in this latter category are deemed to be current drug users).60
Drug Users
Because the white population in the United States is slightly more than six times larger than the black population,61 and the rate of drug use is roughly comparable between the two, the number of white drug users is significantly higher than the number who are black. For example, according to the 2006 surveys conducted by the federal Substance Abuse and Mental Health Services Administration (SAMHSA), an estimated 111,774,000 people in the United States age 12 or older have used illicit drugs during their lifetime, of whom 82,587,000 are white and 12,477,000 are black.62 There are also far more whites than blacks among people who have used cocaine in any form in their lifetime, as well as among those who have used crack cocaine. According to the 2006 SAMHSA estimates, there are 27,083,000 whites who have used cocaine during their lifetime, compared to 2,618,000 blacks, and 5,553,000 whites who have used crack cocaine, compared to 1,536,000 blacks.63 If black and white drug users are combined (and leaving aside other races), blacks account for 13 percent of the total who—according to SAMSHA surveys—have ever used an illicit drug, 8 percent of those who have ever used cocaine, and 21 percent of those who have ever used crack cocaine.
Fig.8: Lifetime Drug Use by Race, Ages 12 and Older
Estimates for drug use by persons age 12 and older from Substance Abuse and Mental Health Services Administration (SAMHSA), “Results from the 2006 National Survey on Drug Use and Health: National Findings.”
Drug Sellers
There is relatively little research on the demographics of drug sellers as such. Little is known about the racial composition of drug kingpins and major traffickers, but as discussed above, it is those at the bottom of the drug trade—for example, those engaging in direct transactions with drug users—who constitute most of the drug sellers who enter the criminal justice system and ultimately prison. Such data as is available suggests, however, that low-level drug sellers have a similar racial profile to drug users. In addition to the illegal activity of drug possession, drug users typically engage in the activities of transferring, selling, and distributing drugs to friends, acquaintances, or strangers.64 Such activities are illegal in all states even when the transferring activities are not connected to compensation—for example, when someone makes a collective purchase to divide among friends. If the preponderance of drug users are white, then a preponderance of those who transfer or sell to another user are probably also white.
There is research suggesting people typically obtain their drugs from persons of their own race.65 For example, drug users questioned in a study of patterns of drug purchase and use in six major cities consistently reported that their main drug sources were sellers of the same racial or ethnic background as themselves. As one researcher addressing racial congruity in drug activities concluded, “[D]ealers with direct contact with their customers … are likely to look like the customers, and in fact be the customers, at other points in time.”66 Recent research in Seattle’s multi-racial and multi-drug drug market indicates that the majority of those who use serious drugs in Seattle are white, as are a majority of the sellers.67
The available data, limited as it is, thus suggests that if blacks constitute around 13 percent of the total black and white drug users, they will constitute roughly that proportion of the total black and white drug offenders—those possessing, purchasing, and transferring drugs to others. All other things being equal, they should constitute a roughly similar proportion of people of both races who are arrested, convicted, and sent to prison for drug law violations.68
Rates of Arrest
But all others things are not equal. Blacks constitute 35.1 percent of all drug arrests nationwide.69 Even if we were to double the 13 percent estimate of the number of blacks who may be drug offenders, the arrest figure is still disproportionately large. Arrest data from some individual states reveal even more dramatic disparities. In Georgia, for example, although blacks constituted approximately 14 percent of all current drug users, they constituted 58 percent of persons arrested for drug possession. Among cocaine users, blacks constituted 22 percent of current users but 79 percent of arrests for cocaine possession.70 In Illinois blacks accounted for 72 percent of all persons arrested for drug offenses.71 In Minnesota “there is a 10:1 disparity in drug-related arrests between African Americans and Whites” that exists despite a study finding a similar level of drug use in Minnesota across racial and ethnic lines.72 In Wisconsin the rate of black arrests for drug offenses of 2,324 per 100,000 was six times greater than the white rate of 367.73 In West Virginia non-white males accounted for 26 percent of drug arrests by drug task forces but constituted only 2.5 percent of the state population.74
There are numerous factors that help account for drug arrests that are racially disproportionate to drug offending. Of considerable significance is the fact that blacks are more likely to live in cities than whites: according to the US Census Bureau, 51.5 percent of blacks in the US live in a metropolitan area, compared to 21.1 percent of whites.75 As a general matter, illicit drug use is higher in urban areas,76 there are more law enforcement resources per capita in urban areas,77 and there are more drug arrests in urban than in non-urban areas.78 Drug law enforcement is not, however, evenly distributed within urban areas. Instead, it has focused on low-income, predominantly minority neighborhoods. This is not a “race neutral” factor. Press attention and community concerns about crack cocaine and political imperatives to be “tough on crime” made those neighborhoods the principal “fronts” in the so-called war on drugs.79 Practical policing factors have played a role as well: drug transactions in poor minority neighborhoods are more likely to be in public spaces and between strangers, making it easier to undertake arrests, such as via “buy and bust” operations, than it is in the bars, clubs, and private homes where drug dealing by whites is more likely to occur.80
Drug arrest data reveal the greater number of black drug arrests in urban areas across the country:
Table 13: US Arrests for Drug Abuse Violations, 200681
|
Region |
Total number |
Number/ % whites |
Number/ % blacks |
|
Nonmetropolitan(rural) |
85,720 |
68,985/ 80.5% |
14,744/ 17.2% |
|
Suburban |
491,999 |
365,791/ 74.3% |
121,184/ 24.6% |
|
Metropolitan |
1,059,063 |
635,190/ 60% |
410,240 /38.7% |
As seen in Table 13, the absolute number of black drug arrests was dramatically larger in urban areas, as was the percentage of all drug arrestees who were black. There were more than three times as many arrests of blacks in urban areas as in suburban, while there were only 1.7 times as many arrests of whites. These figures also reveal the relatively few arrests that take place in rural areas—only 5 percent of the 1,636,782 drug arrests in 2006 occurred in rural areas.In the 75 largest counties in the United States, blacks in 2002 accounted for 46 percent of drug offense arrests and whites for 29 percent.82
Although it is difficult to quantify the extent, racial profiling no doubt plays some role in higher black drug arrests.83 In Minneapolis, for example, blacks constituted 18 percent of the population but experienced 37 percent of police vehicle stops; whites were 65 percent of the population, but experienced 43 percent of stops. In 1999, 77 percent of young males (ages 18-30) arrested for drug offenses in Minneapolis were black, while 13.8 percent were white.84 Even when there are dramatic racial disparities in police stops of vehicles or pedestrians, however, establishing the existence of racial profiling and quantifying its impact is extremely difficult because of the complexities inherent in determining the extent to which the disparities reflect racial bias or legitimate factors. Nevertheless, in many studies researchers conclude that race-neutral factors cannot wholly account for the disparities. Thus, for example, researchers have concluded that legitimate race-neutral reasons do not explain all of the stark racial disparities evident in New York City police “stop and frisk” decisions.85
From Arrest to Imprisonment
Racial disparities evident in drug arrests grow larger as cases wind their way through the criminal justice system. Thus, blacks constitute 43 percent and whites 55 percent of persons convicted of drug felonies in state courts,86 and then the disproportion increases slightly among people sent to prison because of drug convictions (with blacks accounting for 53.5 percent and whites 33.3 percent, as discussed above). Prosecutorial discretion may play a role in the increased disparity between arrests and prison admissions for drug offenses, as prosecutors have essentially unchecked authority to choose what charges to bring and what pleas to accept.87 Blacks arrested on drug charges may also have higher prison admission rates because they are less likely to be able to afford private attorneys88 and must rely on public defenders overwhelmed with high case loads, court-appointed attorneys who may lack the capacity and/or inclination to vigorously pursue a defense, or private attorneys who have little incentive to put anything beyond the least amount of time into a case because they have contracted at a fixed price to take on public defense cases.89 Although defendants represented by publicly financed counsel have the same conviction rates as those represented by private attorneys, those with publicly financed counsel are more likely to be sentenced to incarceration.90
Another factor to consider as an explanation for higher prison admission rates is the existence of a prior criminal record, which increases the likelihood of a prison sentence upon a subsequent conviction.91 Most states have enhanced penalties for second or subsequent drug offenses.92 Since blacks are more likely to be arrested and hence more likely to have prior convictions, they are more likely to receive prison sentences for subsequent offenses.
Case Study: New York
New York presents a clear example of racially disproportionate drug offender arrests and prison admissions, as well as the contribution urban law enforcement makes to this disparity.
Forty-two percent of New York State’s population is in New York City, but 56 percent of law enforcement officers are there.93 In New York City there is one law enforcement officer for every 224.1 persons. In upstate, less urbanized New York counties, the rate of officers per person varies widely: it is one per 537.8 in Seneca, one per 1,650.6 in Franklin, and one per 2,334 in Oswego. In New York City there are 2.6 drug arrests per officer, compared to 1.22 drug arrests per officer in the rest of the state. Perhaps not surprisingly, 80.6 percent of all drug arrests in New York are in New York City (Table 14).94
Table 14: New York Drug Arrests by Region and Race/Ethnicity: 2002
|
Region |
White |
Black |
Hispanic |
Other |
Total |
|
New York City |
15,112 |
57,280 |
35,876 |
1,237 |
109,505 |
|
Suburban NYC |
4,523 |
4,278 |
549 |
59 |
9,409 |
|
Upstate |
7,873 |
8,314 |
585 |
156 |
16,928 |
|
New York State |
27,512 |
69,878 |
37,011 |
1,452 |
135,853 |
Blacks constitute 17.4 percent of the state’s population,95 and they accounted for 51.4 percent of drug arrests in the state. Blacks constitute 25.1 percent of New York City’s population, 96 but represent 52.3 percent of all drug arrests in the city. Blacks in New York City alone represent only 10.7 percent of the state population, yet accounted for 42.1 percent of all drug arrests statewide.
Fig 9: Black Drug Arrests, New York City and New York State
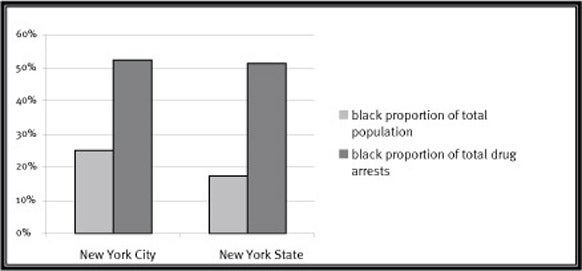
Source: Data from New York State Division of Criminal Justice Services for the year 2002, on file with Human Rights Watch.
The racial disproportions in drug arrests are followed by racial disproportions in prison admissions. Table 15 shows that blacks from New York City—who, as noted above, constitute 10.7 percent of the state population—accounted for 26 percent of state prison admissions.97 Statewide, black drug offenders accounted for 56 percent of the total number of drug offenders admitted to prison.
Table 15: Race and Ethnicity of New Prison Admissions for Drug Offenses in New York, 200698
|
Region |
White |
Black |
Hispanic |
Other |
Unknown |
Total |
|
New York City |
134 |
1,578 |
1,525 |
12 |
5 |
3,254 |
|
Suburban New York |
104 |
556 |
167 |
5 |
0 |
832 |
|
Upstate Urban |
130 |
786 |
133 |
11 |
6 |
1,066 |
|
Upstate Other |
296 |
472 |
126 |
12 |
2 |
908 |
|
Total |
664 |
3,392 |
1,951 |
40 |
13 |
6,060 |
The role of cities in sending people to prison is also readily apparent in Table 15. More than half (53.7 percent) of the people in the state entering prison in 2006 because of drug offenses were from New York City.99
Case Study: Illinois
Illinois has long had striking disproportions in the race of drug offenders sent to prison. According to our analysis, blacks accounted for 74.9 percent of prison admissions for drug offenses in 2003, and were sent to prison on drug charges at a rate relative to the population that was 23.6 times greater than that of whites. In the last few years, The Illinois Criminal Justice Information Authority (ICJIA) has supported research to explore the causes of the marked racial disparities in the sentencing and incarceration of Illinois drug offenders.100The most recent report for the ICJIA, published in 2005, found that Cook County, which includes Chicago, constituted 43 percent of the population of Illinois but accounted for nearly two-thirds of all state drug arrests.101 Ninety percent of drug arrests in Cook County occurred in Chicago, and African Americans constituted 74 percent of the people arrested for drug offenses in Chicago, and 85 percent in all of Cook County.102
The analysis concluded that “arrests and convictions of African-Americans for [drug] violations in Chicago and in Cook County are driving the state’s racial disparities in imprisonment.” It suggested several factors that help explain the racial disparities, including: 1) residents in predominately African American neighborhoods call the police, urging them to combat street-level gang and drug activities; 2) outdoor open-air drug selling typical in minority urban areas is more vulnerable to police “buy and bust” strategies to arrest sellers; and 3) sentencing enhancements that increase sentences for people selling drugs within designated boundaries—for example, within 1,000 feet of schools, public housing, and churches—typically apply to people selling drugs in poor (and African American) urban areas.
But the study also found race to be an independent factor. The report for the ICJIA cited earlier research showing that three factors predicted a sentence to prison for a drug law violation, holding all other variables constant: type of offense (possession or sales); history of imprisonment; and race. Persons of color, mostly African Americans, were three times more likely than whites to be sentenced to prison for any drug law violation.103
Case Study: Seattle
The authors of a comprehensive study of race and drug law enforcement in Seattle concluded that blatant racial prejudice may be less important in producing stark racial disparities in drug law enforcement than a more subtle form of “racism,” in which “race shapes perceptions of who and what constitutes … [the] drug problem and the organizational response to that problem.”104
Seventy percent of Seattle’s residents are white, only 8.4 percent are black, and the rest are of other races. The majority of those who delivered (shared, sold, or transferred) serious drugs105 in Seattle were white, but the large majority (64.2 percent) of drug arrestees were black. The researchers concluded the disparity was the result of the police department’s allocation of resources, the department’s emphasis on the outdoor drug market in the racially diverse downtown area, its lack of attention to other outdoor markets that are predominantly white, its relative disinterest in heroin sellers (who are predominantly white), and its emphasis on crack cocaine. As a result of these department priorities, during the two-year period in the study, 78.7 percent of the arrests for delivery of any of the five drugs studied were for crack, even though crack was only involved in an estimated 33.3 percent of Seattle drug transactions. In contrast, methamphetamine was involved in an estimated 10.7 percent of outdoor transactions, yet only 1.1 percent of the drug delivery arrests involved that drug. Powder cocaine was involved in an estimated 22.7 of outdoor transactions, but accounted for only 3.8 percent of arrests. Finally, heroin was involved in 33 percent of transactions but in only 16.4 percent of arrests. Whites constitute the majority of those who deliver methamphetamine, ecstasy, powder cocaine, and heroin in Seattle; blacks are the majority of those who deliver crack. Not surprisingly then, 79 percent of the crack arrestees were black, contributing greatly to the overall racial skewing of Seattle drug arrests.
The researchers could not find a “racially neutral” explanation for these arrest figures or the police priorities that caused them. The focus on crack offenders, for example, did not appear to be a function of the frequency of crack transactions compared to other drugs, of public safety or public health concerns, or of crime rates or citizen complaints. The researchers concluded that the Seattle police department’s drug law enforcement efforts:
[R]eflect implicit racial bias: the unconscious impact of race on official perceptions of who and what constitutes Seattle’s drug problem .... Indeed, the widespread racial typification of drug offenders as racialized “others” has deep historical roots and was intensified by the diffusion of potent cultural images of dangerous black crack offenders. These images appear to have had a powerful impact on popular perceptions of potential drug offenders, and, as a result, law enforcement practices in Seattle.106
Case Study: A Focus on Counties
The Justice Policy Institute (JPI) recently examined the relationship between county socio-demographic structures and their drug admission rates. According to JPI, “since relatively constant patterns of individual-level drug use do not appear to be driving the widely varying racial and cross-jurisdiction drug admission rates, it is necessary to examine the socio-demographic characteristics of places that may be associated with these disparities in prison admission rates.”107 Among its findings: larger proportions of African Americans in a county’s population and high poverty rates are both strongly correlated with higher county rates of sending people to prison on drug charges. According to JPI, its research suggests that the greater the proportion of disadvantaged people in a community, the more likely the community is to have “punitive practices with regard to policing, prosecuting, and ultimately imprisoning individuals who have engaged in drug behaviors,” a finding consistent with a body of research that suggests “punishment is easier to dispense upon individuals with whom one feels little commonality.”108
51 Human Rights Watch, Punishment and Prejudice. We have recomputed the 1996 data, to ensure the admissions data for both 2003 and 1996 have been analyzed using the same methodology. The 1996 data presented in this report is thus in a few places not identical to that published in Punishment and Prejudice.
52 Methamphetamine is a synthetic psychostimulant that is cheap, highly addictive, and dangerous when used for nonmedical purposes. Traditionally, it has been a drug used primarily by lower middle class white men, although this may be changing as the number of women as well as minorities using the drug is apparently increasing. Since the early 1990s, use of “meth” has spread from the west and southwest into the midwest and south. See, for example, SAMHSA, “State Estimates of Past Year Methamphetamine Use,” The National Survey on Drug Use and Health (NSDUH) Report, Issue 37, 2006, http://www.oas.samhsa.gov/2k6/stateMeth/stateMeth.htm (accessed April 16, 2008); and SAMHSA, “Methamphetamine Use,” The NSDUH Report, January 26, 2007, http://www.oas.samhsa.gov/2k7/meth/meth.pdf (accessed April 16, 2008). Persons in the west were more likely to have used methamphetamine in the past year than persons in the midwest, south, and northeast. Use of the drug is lowest in the northeast. In certain parts of the country, methamphetamine now exceeds cocaine and heroin as the drug of greatest law enforcement concern. For example, the National Association of Counties reported that 47.4 percent of surveyed county law enforcement officials said that methamphetamine was the biggest drug problem in their counties, compared to 21 percent who reported that cocaine was their biggest problem. See National Association of Counties (NACO), “The Meth Epidemic: The Changing Demographics of Methamphetamine,” August 2007, http://www.naco.org/Template.cfm?Section=Library&template=/ContentManagement/ContentDisplay.cfm&ContentID=24797 (accessed April 16, 2008).
53 SAMHSA, “National Household Survey on Drug Abuse: Advance Report # 18 on the Findings of the 1995 National Household Survey on Drug Abuse,” http://oas.samhsa.gov/nhsda/ar18t028.htm#A1 (lifetime use), and http://www.oas.samhsa.gov/treatan/treana13.htm#E10E52 (past year use) (accessed April 16, 2008).
54 SAMHSA, “Results from the 2006 National Survey,” Tables 8.43A-8.45BB.
55 The respondents were age 12 years and older. Ibid., Detailed Tables, Table 8.43B. See also, for example, Council on Crime and Justice, “Justice, Where Art Thou.”
56 Council on Crime and Justice, “Justice, Where Art Thou.”
57 Leonard Saxce, Ph.D., et al., “The Visibility of Illicit Drugs: Implications for Community-Based Drug Control Strategies,” American Journal of Public Health, vol. 91 (2001), pp. 1987-1994, http://www.pubmedcentral.nih.gov/articlerender.fcgi?artid=1446920 (accessed April 16, 2008).
58 Disparities in drug arrests account for the preponderance, but not all, of the racial disproportionality among incarcerated drug offenders. The type of drug offense (for example, possession or trafficking), the type of drug, and existence of a prior record are all “race-neutral” factors that can affect sentencing. Human Rights Watch, Punishment and Prejudice, p. 19, fn. 72.
59 The surveys conducted by SAMHSA exclude high-drug using populations such as the homeless and people who are in jail or prison, whether pending trial or serving sentences.
60 SAMHSA, “Results from the 2006 National Survey,” Appendix G: Selected Prevalence Tables, Table G.1.
61 There are 239,746,000 whites and 38,343,000 African Americans living in the United States. US Census Bureau, “Statistical Abstract of the United States: 2008,” Table 6, p. 9, http://www.census.gov/compendia/statab/ (accessed April 16, 2008).
62 SAMHSA, “Results from the 2006 National Survey,” Detailed Tables, Table 1.19A.
63 Ibid. Tables 1.33A (cocaine use) and 1.34A (crack use).
64 There is considerable research indicating that “many frequent drug users participate in some aspect of the drug distribution system in order to support their drug habit and/or generate income.” Katherine Beckett, “Race and Drug law Enforcement in Seattle,” May 3, 2004, p. 32, http://www.soc.washington.edu/users/kbeckett/Enforcement.pdf (accessed April 16, 2008). In addition, drug users engage in transferring activities not connected to compensation—for example, passing drugs between friends and making collective purchases that are divided up.
65 Human Rights Watch, Punishment and Prejudice, p. 15. As sociologist Pamela E. Oliver points out, “most users of illegal drugs meet the legal definition of delivering illegal drugs because of the way an illegal market works, where people make buys and redistribute to their friends.” Pamela E. Oliver “Racial Disparity in the Drug War and Other Crimes: Arrests, Prison Sentences, Probation and Probation Revocations as sources of Prison Admissions Disparities,” included as an Appendix in Commission on Reducing Racial Disparities in the Wisconsin Justice System, “Final Report,” February 2008, ftp://doaftp04.doa.state.wi.us/doadocs/web.pdf (accessed April 16, 2008). According to the Office of Juvenile Justice and Delinquency Prevention, the National Longitudinal Survey of Youth indicated that 3 percent of black youth reported selling drugs compared with 17 percent of white youth. In a sampling of youth ages 12-17 in 1997 and 1998, the National Longitudinal Survey of Youth found that the proportion of youth who reported selling or helping to sell drugs was the same among white, black, and Hispanic youth. Findings reported in Howard Snyder and Melissa Sickmund, Department of Justice, Office of Juvenile Justice and Delinquency Prevention, “Juvenile Offenders and Victims: 2006 National Reports,” March 2006, p. 82, http://ojjdp.ncjrs.org/ojstatbb/nr2006/downloads/NR2006.pdf (accessed April 16, 2008).
66 Dana E. Hunt, “Drugs and Consensual Crimes: Drug Dealing and Prostitution,” in Michael Tonry and James Q. Wilson, eds., Drugs and Crime (Chicago: University of Chicago Press, 1990), p. 172.
67 Beckett et al., “Race, Drugs, and Policing;” and Beckett, “Race and Drug law Enforcement in Seattle.” The report was prepared on behalf of the Defender Association’s Racial Disparity Project in Seattle, Washington.
68 See also Dorothy Lockwood, et al., “Crack Use, Crime by Crack Users, and Ethnicity,” in Darnel F. Hawkins, ed., Ethnicity, Race and Crime (New York: State University of New York Press, 1995). A study conducted in the Miami, Florida metropolitan area of 699 cocaine users (powder and crack) found over 96 percent of users in each racial/ethnic category was involved in street-level drug dealing.
69 Bureau of Justice Statistics (BJS), “Sourcebook of Criminal Justice Statistics 2006,” Table 4.10.2006, http://www.albany.edu/sourcebook/pdf/t4102006.pdf (accessed April 16, 2008).
70 Human Rights Watch, Race and Drug Law Enforcement in the State of Georgia, vol. 8, no. 4, July 1996, http://www.hrw.org/reports/1996/Us2.htm.
71 Blacks accounted for 72 percent on average of arrests for drug offenses during three years in the late 1990s. The proportion of blacks among those arrested for drug offenses increased from 46 percent in 1983 to 82 percent in 1992. Lurigio, “The Illinois Perspective,” p. 7.
72 Council on Crime and Justice, “Justice, Where Art Thou,” p. 16.
73Governor’s Commission on Reducing Racial Disparities in the Wisconsin Justice System, “Final Report,” Appendix, p. 48.
74 Dr. Stephen M. Haas, director, West Virginia Drug and Violent Crime Control Task Force, “Presentation to Senate Judiciary Subcommittee C,” October 2, 2005, http://www.google.com/search?q=cache:jAExeYczYrkJ:www.wvdcjs.com/statsanalysis/Presentations/DVCCTF%252003-04%2520Report%2520Presentation.ppt+Drug+%26+Violent+Crime+Control+Task+Force+Report,+2003-2004&hl=en&ct=clnk&cd=1&gl=us (accessed April 16, 2008).
75 US Census Bureau, “The Black Population in the United States: March 2002,” April 2003, Figure 2, p. 2, http://www.census.gov/prod/2003pubs/p20-541.pdf (accessed April 16, 2008).
76 Higher percentages of both blacks and whites use illicit drugs in metropolitan areas than in non-metropolitan areas. SAMHSA, “Illicit Drug Use, by Race/Ethnicity, in Metropolitan and Non-Metropolitan Counties: 2004 and 2005,” The NSDUH Report, June 21, 2007, http://www.oas.samhsa.gov/2k7/popDensity/popDensity.pdf (accessed March 3, 2008).
77 The expenditures per capita for police personnel are larger in central city areas than they are outside of them and also increase with the size of cities. BJS, “Sourcebook of Criminal Justice Statistics 2003,” Table 1.65.
78 For example, 76 percent of the arrests nationwide for drug abuse violations in 2002 occurred in cities. Data compiled from BJS, “Sourcebook of Criminal Justice Statistics,” Tables 4.10 and 4.12, http://www.albany.edu/sourcebook/ (accessed April 16, 2008).
79 There is an extensive body of literature on the origins and impact of “tough on crime” drug policies and the focus on crack cocaine. See, for example, Tonry, Malign Neglect; Marc Mauer, The Sentencing Project, Race to Incarcerate (New York: The New Press, 1999); Steven B. Duke and Albert C. Gross, America’s Longest War: Rethinking our Tragic Crusade against Drugs (New York: Putnam Books, 1994); Craig Reinarman and Harry G. Levine, eds., Crack in America: Demon Drugs and Social Justice (Berkeley, CA: Univ. of California Press, 1997); and Eva Bertram et al., Drug War Politics: The Price of Denial (Berkeley, CA: Univ. of California Press, 1996).
80 Human Rights Watch, Punishment and Prejudice, pp. 21-23.
81 BJS, “Sourcebook of Criminal Justice Statistics, 2006,” Table 4.12.2006 (“Arrests in Cities”), http://www.albany.edu/sourcebook/pdf/t4122006.pdf; Ibid., Table 4.16.2006 (“Arrests in Suburban Areas”), http://www.albany.edu/sourcebook/pdf/t4142006.pdf; Ibid., Table 4.16.2006 (“Arrests in Nonmetropolitan Counties”), http:www.albany.edu/sourcebook/pdf/t4162006.pdf (all accessed April 16, 2008).
82 Data is for non-Hispanic blacks and non-Hispanic whites. Thomas H. Cohen and Brian A. Reaves, BJS, “Felony Defendants in Large Urban Counties, 2002,” February 2006, Table 3, p. 4, http://www.ojp.usdoj.gov/bjs/pub/pdf/fdluc02.pdf (accessed April 16, 2008).
83 Many observers believe racial profiling remains a significant problem in the United States. See, for example, the American Civil Liberties Union (ACLU), “Race and Ethnicity in America: Turning a Blind Eye to Injustice (U.S. Violations of the Convention on the Elimination of All Forms of Racial Discrimination),” December 2007, http://www.aclu.org/pdfs/humanrights/cerd_full_report.pdf (accessed April 16, 2008).
84 Tonry, Malign Neglect, p. 65.
85 Office of the Attorney General, New York State, “The New York City Police Department’s ‘Stop & Frisk’ Practices: A Report to the People of the State of New York,” December 1, 1999, http://www.oag.state.ny.us/press/reports/stop_frisk/stop_frisk.html (accessed April 16, 2008); and Greg Ridgeway, RAND Corporation, “Analysis of Racial Disparities in the New York Police Department’s Stop, Question, and Frisk Practices,” 2007, http://www.rand.org/pubs/technical_reports/2007/RAND_TR534.sum.pdf (accessed April 16, 2008).
86 Durose and Langan, BJS, “Felony Sentences in State Courts, 2002,” Table 5, p. 6.
87 Prosecutors have wide-ranging and essentially unchecked power to determine whether to prosecute a drug offense and, if so, to determine what charges to bring or pleas to accept. Because of mandatory sentencing legislation, the decision regarding what charges to bring effectively determines the sentence. In the largest counties, 57 percent of persons charged with drug trafficking felonies plead guilty. Cohen and Reaves, “Felony Defendants in Large Urban Counties, 2002,” p. 30, Table 23. The Justice Policy Institute points out that, unlike crimes of violence, the detection—and then prosecution and sentencing—of drug offenders is a matter of considerable law enforcement as well as prosecutorial discretion. Phillip Beatty, Amanda Petteruti, and Jason Ziedenberg, Justice Policy Institute, “The Vortex: The Concentrated Racial Impact of Drug Imprisonment and the Characteristics of Punitive Counties,” December 2007, p. 16, http://www.justicepolicy.org/images/upload/07-12_REP_Vortex_AC-DP.pdf (accessed April 16, 2008).
88 For example, 25.6 percent of black persons have income below the poverty level compared to 10.4 percent of whites. US Census Bureau, “Statistical Abstract of the United States: 2008,” Table 36, p. 38, http://www.census.gov/compendia/statab/ (accessed April 16, 2008).
89 Only 15.3 percent of felony drug defendants in the 75 largest counties in the US were represented by hired attorneys. Caroline Wolf Harlow, BJS, “Defense Counsel in Criminal Cases,” November 2000, Table 7, p. 5, http://www.ojp.usdoj.gov/bjs/pub/pdf/dccc.pdf (accessed April 16, 2008). Regarding the crisis of publicly financed counsel and its impact on minorities, see also The Sentencing Project and National Association of Criminal Defense Lawyers, “Racial Disparity in Criminal Court Processing in the United States: Submitted to the United Nations Committee on the Elimination of Racial Discrimination,” December 2007, http://www.sentencingproject.org/Admin%5CDocuments%5Cpublications%5CCERD%20December%202007.pdf (accessed April 16, 2008); American Bar Association Standing Committee on Legal Aid and Indigent Defense, “Gideon’s Broken Promise: America’s Continuing Quest for Equal Justice, A Report on the American Bar Association's Hearings
on the Right to Counsel in Criminal Proceedings,” December 2004, http://www.abanet.org/legalservices/sclaid/defender/brokenpromise/fullreport.pdf (accessed April 16, 2008); and The Southern Center for Human Rights (SCHR), “‘If You Cannot Afford A Lawyer …’: A Report on Georgia’s Failed Indigent Defense System,” January 2003, http://www.schr.org/reports/docs/jan.%202003.%20report.pdf (accessed April 16, 2008).
90 Caroline Wolf Harlow, “Defense Counsel in Criminal Cases.” Defendants represented by private counsel were also more likely to be released pretrial.
91 Among defendants convicted in state court of felony drug offenses, 63 percent had prior convictions, primarily for non-violent felony offenses and misdemeanors. Cohen and Reaves, “Felony Defendants in Large Urban Counties, 2002” Table 10, p. 12.
92 ImpactTeen Illicit Drug Team, Andrews University and the RAND Corporation, “Illicit Drug Policies,” p. 36.
93 US Census Bureau, “2006 American Community Survey Data Profile Highlights: New York City, New York,” http://factfinder.census.gov/servlet/ACSSAFFFacts?_event=&geo_id=16000US3651000&_geoContext=01000US%7C04000US36%7C16000US3651000&_street=&_county=New+York+City&_cityTown=New+York+City&_state=04000US36&_zip=&_lang=en&_sse=on&ActiveGeoDiv=&_useEV=&pctxt=fph&pgsl=040&_submenuId=factsheet_1&ds_name=ACS_2006_SAFF&_ci_nbr=null&qr_name=null®=null%3Anull&_keyword=&_industry= (accessed April 16, 2008). Data on law enforcement officers calculated from data provided by New York State Division of Criminal Justice Services to Human Rights Watch.
94 All data in this report on New York arrests are for 2002, and were provided to Human Rights Watch by the New York State Division of Criminal Justice Services (DCJS). Between 2003 and 2007, New York City drug arrests varied from a high of 77 percent of all drug arrests in the state (2003, 2007) to a low of 73 percent (2006). 2002 is the last year for which DCJS has reliable data on the racial and ethnic breakdown of state drug arrests.
95 US Census Bureau, “State & County Quick Facts,” http://quickfacts.census.gov/qfd/states/36000.html (accessed April 16, 2008).
96 US Census Bureau, “2006 American Community Survey Data Profile Highlights: New York City, New York.”
97 Blacks represented about half the prison admissions from new court commitments for drug offenses throughout the period 2002-2006. State of New York Department of Correctional Services, “Statistical Overview: Year 2006 Court Commitments,” May 2007, Table 9.1, p. 19, http://www.docs.state.ny.us/Research/Reports/Court_Commitments_2006.pdf (accessed April 16, 2008).
98 Data provided by the New York State Department of Correctional Services, March 7, 2008, on file with Human Rights Watch.
99 State of New York Department of Correctional Services, “Year 2006 Court Commitments,” Table 11.3, p. 23. Forty percent of the commitments from New York City were for drug offenses.
100 The study was prompted by the results regarding Illinois reported in Human Rights Watch, Punishment and Prejudice. Lurigio, “The Disproportionate Incarceration of African Americans for Drug Crimes: The Illinois Perspective,” p. 10: “All of our analyses confirmed the HRW’s findings regarding the disproportionate incarceration of African-Americans in Illinois for drug-law violations.”
101 Ibid., p.7.
102 Ibid.
103 The other variables included in the study were age, gender, educational level, and jurisdiction type.
104 Beckett et al., “Race, Drugs, and Policing;” and Beckett, “Race and Drug Law Enforcement in Seattle.” The report was prepared on behalf of the Defender Association’s Racial Disparity Project in Seattle, Washington.
105 The drugs studied were heroin, powder cocaine, crack cocaine, methamphetamine, and ecstasy.
106 Beckett et al., “Race, Drugs, and Policing,” p. 130.
107 Phillip Beatty, Amanda Petteruti, and Jason Ziedenberg, Justice Policy Institute, “The Vortex,” p. 16. The study examined 198 large-population counties, representing 51.2 percent of the US population.
108 Ibid., p. 16.