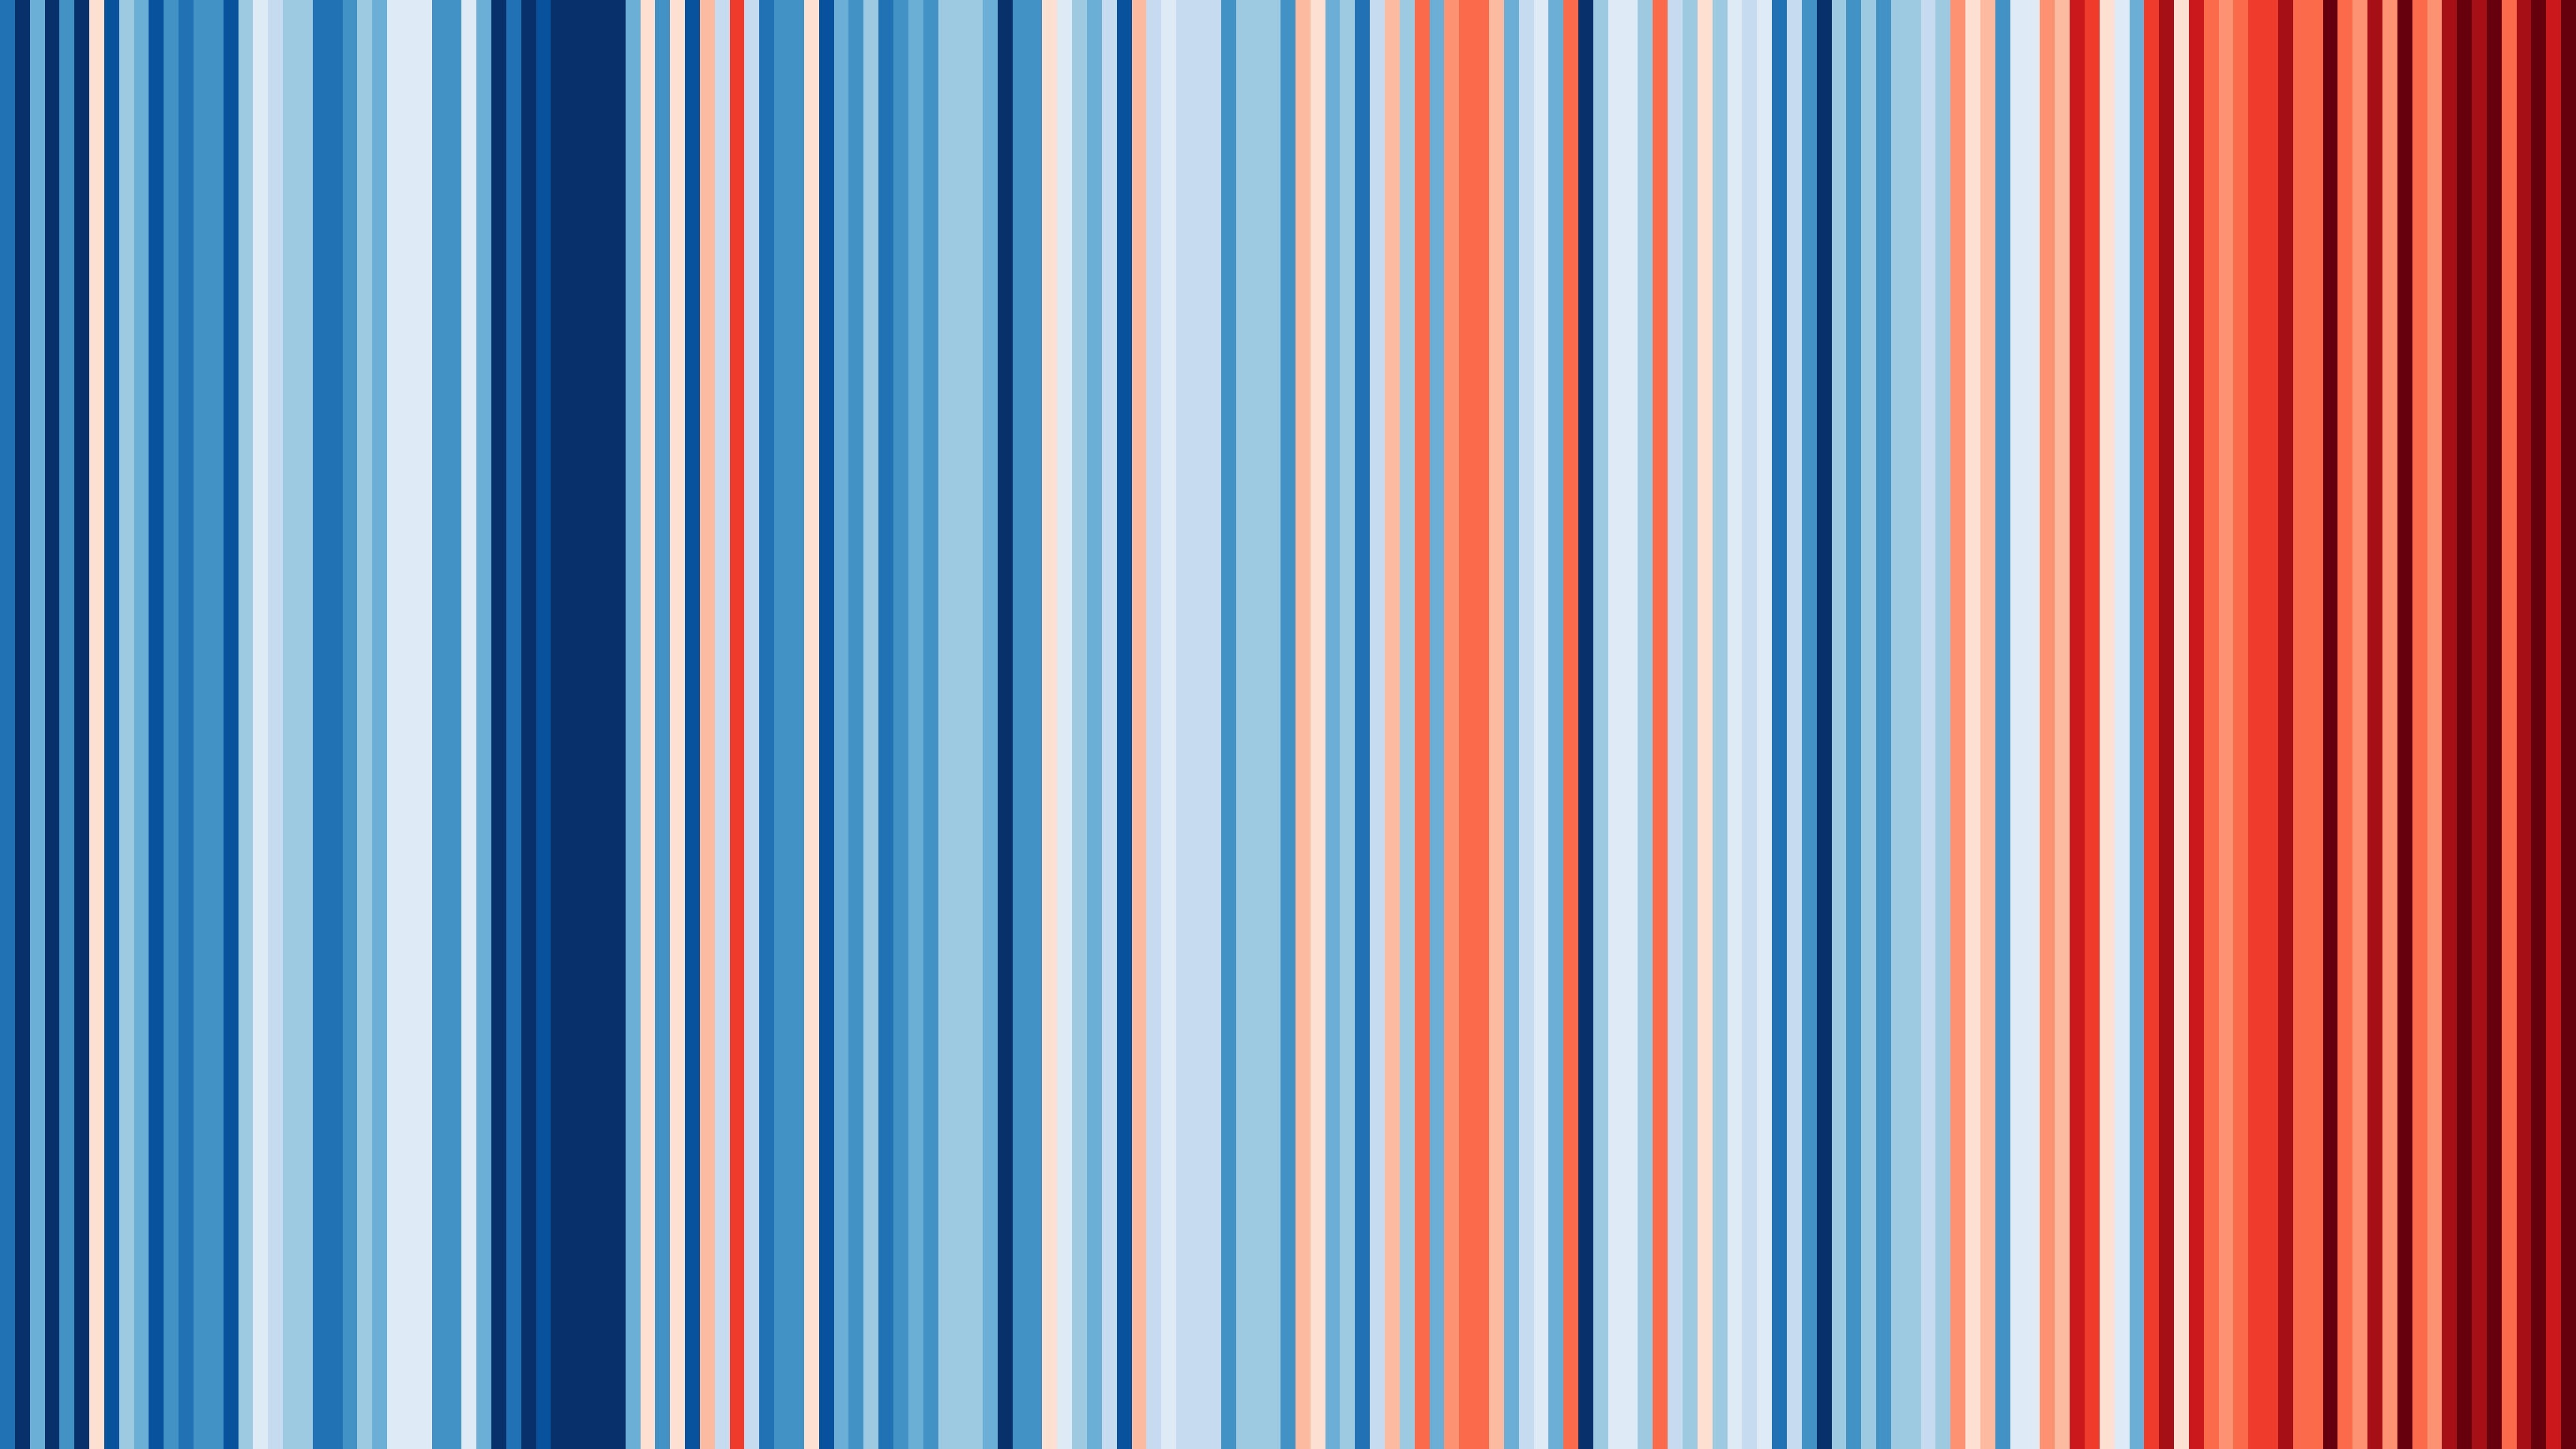
A visualization of annual mean temperatures in Spain from 1850 to 2022. The gradation from blue to red shows the temperature has increased.
© #ShowYourStripes

A visualization of annual mean temperatures in Spain from 1850 to 2022. The gradation from blue to red shows the temperature has increased.