From Horror to Hopelessness
Kenya's Forgotten Somali Refugee Crisis
|
"I fled Mogadishu in July [2008] because men wearing ski-masks were raping so many women near our home. Our family gave me money and when I reached Dadaab I paid a smuggler $500 to take us to Nairobi. A minibus drove me and 30 other refugees by night through the bush from Ifo camp towards Garissa town [100 kilometers south of Dadaab]. Near Garissa the smugglers told us to get out because they had seen a vehicle's lights. One of the smugglers walked through the bush with us. Suddenly seven people with machetes and sticks approached us, beat us on our heads and backs and stole all our money. Then the minibus came back, the men ran away and we continued our journey. The driver paid bribes to the police in Garissa to allow us to leave town. We stayed for two nights under the open sky in the bush just beyond Garissa and then continued. At the first police checkpoint we saw the driver pay police bribes. We continued to Mwingi town where police told the driver to collect $10 from everyone because "this checkpoint has not been paid for yet." After the robbery in the bush we had no money so the police arrested all of us. We were split up. One group, including me, was taken to Mwingi police station and the other to Garissa police station. In the Mwingi police station, I was held in a cell for 12 days with other women from the bus. Every morning, lunch and evening the police beat the older women on their heads and backs with plastic rods. The police shouted things like "why are you leaving Somalia and coming to Kenya?" Every day the police said they would release us if we paid KSh 20,000 each ($25o). The police said we should get our relatives in Kenya or Somalia to pay for us. In the end they said they had to deport us because Kenyan newspapers had written about us and the government did not want to appear to be soft on Somalis. The police then transferred me and others to Garissa police station for one night. When we arrived, the police made us line up facing a wall and said we should "think about never coming back to Kenya." Then police officers hit all of us three or four times on the back and head with a stick. That night the Kenyan men in a cell next to ours, which was separated only by bars, urinated in plastic bags and threw them at us and cursed at us in Swahili all night long. We complained to the police but they did nothing to stop them. In the end the police drove me and other refugees in trucks from Garissa police station to the border and told us to walk back to Doble in Somalia. Three weeks later I tried again and managed to reach Nairobi in the back of a truck with no windows. Human Rights Watch interview with 15-year-old Somali girl in Nairobi, October 23, 2008 |
I. Summary
Kenya is in the midst of a rapidly escalating refugee crisis. In 2008 alone, almost 60,000 Somali asylum seekers-165 every day-crossed Kenya's officially closed border with Somalia to escape increasingly violent conflict in Somalia and to seek shelter in three heavily overcrowded and chronically under-funded refugee camps near Dadaab town in Kenya's arid and poverty-stricken North Eastern Province. The camps now shelter over 260,000 refugees, making them the world's largest refugee settlement.
The continuous cross-border movement gives the impression that the closing of the border by the Kenyan government in January 2007 has not affected Somali asylum seekers' ability to seek refuge in Kenya. In reality, however, it has led to the Kenyan police forcibly returning asylum seekers and refugees to Somalia in violation of Kenya's fundamental obligations under international and Kenyan refugee law, and to serious abuses of Somali asylum seekers and refugees. Emboldened by the power over refugees that the border closure has given them, Kenyan police detain the new arrivals, seek bribes-sometimes using threats and violence including sexual violence-and deport back to Somalia those unable to pay. By forcing the closure of a UNHCR-run registration center close to the border, the Kenyan authorities have also seriously aggravated the humanitarian assistance needs among Somalis arriving in the three camps near Dadaab town.
The influx of tens of thousands of new arrivals into the already severely overcrowded and under-resourced camps has exacerbated shortages of shelter, water, food, and healthcare for all refugees-new and old. An unknown further number of Somalis, possibly in the tens of thousands, have travelled directly to Nairobi where most disappear into the city, receiving no support and remaining invisible to the outside world.
Kenya officially closed its border with Somalia days after the Ethiopian military intervened to oust the Union of Islamic Courts (UIC) from south-central Somalia. Apparently aimed at preventing the entry of fleeing supporters of the UIC into Kenya, the border closure has had an extremely negative impact on Somali civilians trying to flee the violence.
The border closure has allowed Kenyan police to forcibly deport Somali asylum seekers and refugees in flagrant violation of international law and has caused Kenyan political authorities to turn a blind eye to police corruption and abuses in the border areas and the camps. The authorities have also forced the United Nations High Commissioner for Refugees (UNHCR) to close its refugee transit center near the border, and for well over a year Kenyan authorities have failed to respond to calls for new land to decongest the camps. To their credit, however, in an unspoken compromise, the Kenyan authorities allowed UNHCR to register almost 80,000 Somali refugees in the camps in 2007 and 2008, and, in February 2009, granted a limited amount of land to help begin decongesting the camps.
Under its Immigration law, Kenya has the right to regulate the presence of non-nationals in its territory and may, therefore, prevent certain people from entering or remaining in Kenya, including those deemed a threat to its national interests. However, international and Kenyan law obliges Kenya to allow all people claiming to be refugees ("asylum seekers") access to Kenyan territory to seek asylum with the Kenyan authorities or with UNHCR, and every asylum seeker has a right to have his or her case considered.
Since the border closure, the Kenyan authorities have deported hundreds, possibly thousands, of Somali refugees and asylum seekers, thereby violating the most fundamental part of refugee law, the right not to be refouled-forcible return to a place where a person faces a threat to life or freedom on account of race, religion, nationality, membership of a particular social group, or political opinion. Under its obligations in the 1969 OAU Convention Governing the Specific Aspects of the Refugee Problems in Africa (1969 OAU Convention), Kenya is also bound not to send refugees or asylum seekers back to situations of generalized violence, such as in Somalia.
The Dadaab refugee camps were originally designed for 90,000 refugees, but by the end of February 2009 held 255,000, a 48 percent increase since January 2008. Because of the lack of new land to expand the camps, UNHCR declared the camps full in late August 2008. Between then and the end of February 2009, just over 35,000 new arrivals received no shelter and have been forced to sleep under open skies in makeshift shelters that provide little protection from the harsh weather, or in cramped confines with relatives or strangers who were already living in conditions well below minimum humanitarian standards. By the end of 2009, the camps are likely to hold at least 300,000 refugees and UNHCR estimates it could be as many as 360,000.
Aid agencies who already had limited resources are working overtime, struggling to meet basic minimum standards in food, water, shelter, sanitation, and healthcare assistance for the mushrooming camp population. Malnutrition rates have reached at least 13 percent since mid 2008 and children under the age of five suffer from high malnutrition rates below international standards. Tens of thousands of refugees almost certainly receive well below the required daily amount of water. Basic minimum sanitation standards are not being met. Healthcare agencies are understaffed, lack sufficient drugs, and cannot adequately meet refugees' healthcare needs: mortality rates for women, infants, and under-fives are all under minimum international standards. A recent international NGO assessment concluded that the camps face a situation that is conducive to a public health emergency.
For at least one year, UNHCR unsuccessfully tried to negotiate with Dadaab's local authorities for land for additional camps. The Kenyan negotiators demanded development aid and environmental protection measures in return for hosting the increasing refugee population. In the second half of 2008 a serious registration crisis-caused by a combination of the high number of monthly arrivals, UNHCR's decision to register new arrivals in only one camp after May, and limited UNHCR registration resources-left thousands of refugees, including the sick, women, and children, waiting weeks and even months to receive food.
As a result of mounting criticism from nongovernmental organizations, in December 2008 UNHCR changed its registration system to streamline registration of new refugees and issued a donor appeal for US$92 million. In early February 2009 the Kenyan Prime Minister promised the Deputy High Commissioner for Refugees new land for up to 50,000 refugees, one-third of the land required to adequately decongest the camps and to shelter the minimum number of expected new arrivals in 2009. However, UNHCR has not yet agreed with the local community living near the camps on numerous issues concerning how the camp is to be set-up and managed, leading to a delay in building it.
Kenya has never officially adopted a policy requiring Somali (or other) refugees to stay in camps. However, in practice Kenya and UNHCR have used a number of disincentives to limit the number of refugees choosing to live or move outside of camps. The first disincentive is the shared policy of the Kenyan government and UNHCR that refugees cannot receive humanitarian assistance outside of camps.
The second disincentive-which violates refugees' right to freedom of movement in Kenya- is the government's policy restricting officially sanctioned movement between the camps and other parts of Kenya. Once registered in Dadaab's camps, refugees are not permitted to travel unless they fulfil one or more unpublished criteria for obtaining a "movement pass" co-signed by the Kenyan authorities and UNHCR. If the police stop a refugee registered in the camps travelling without a movement pass, the refugee risks being arrested and fined, and, in practice, even worse (detention and refoulement).
The third disincentive for Somalis to live outside the camps has been UNHCR's lengthy refugee status determination procedures in Nairobi, compared to swift procedures in Dadaab's camps. In early 2009, Somalis still waited up to nine months to have their status determined, leaving them vulnerable to police abuses in the interim. In March 2009, UNHCR said it was seeking to cut the average time to two months.
Kenya has legitimate security concerns and a right to control its border, but closing the border to asylum seekers and the refoulement (unlawful forced return) of Somali asylum seekers and refugees violates Kenya's fundamental obligations under international and national refugee law. Kenya should immediately cease refoulement and take steps to ensure that refugees have access to assistance and protection in Kenya. To this end, Kenyan authorities should invite UNHCR to re-open its refugee transit center in Liboi and ensure that its police guarantee all Somali asylum seekers free movement to Dadaab's camps or to Nairobi-where UNHCR or the Kenyan authorities can register them as refugees.
Kenya should urgently take steps to end the impunity with which abusive police officers operate in the border areas, in and near Dadaab's camps, and between Dadaab and Nairobi.
Finally, Kenya should build on its recent commitment to provide new land for 50,000 refugees by cooperating fully with the United Nations Country Team in its efforts to secure land capable of accommodating a further 100,000 refugees to help decongest Dadaab's existing camps and to accommodate new arrivals in 2009.
To ensure that further land is rapidly made available, UNHCR should relinquish its control over negotiations with the local Kenyan authorities in Fafi and Lagdera Districts, which house Dadaab's camps, and help organize joint negotiations between development and environmental agencies in the United Nations Country Team and five Kenyan Ministries with refugee and development mandates relevant to Kenya's North Eastern Province.
Despite competing demands from other agencies struggling with other crises in Kenya, including chronic food shortages, donors should respond generously to UNHCR's supplementary appeal for funds to address the appalling situation in Dadaab's camps. Donor governments should also intervene with the Kenyan government to stop the refoulement of Somali refugees and asylum seekers.
With regard to Kenya's de facto encampment policy, the Government of Kenya should guarantee Somali asylum seekers' right to travel from Somalia directly to Nairobi, to apply for refugee status, if they so choose. The Kenyan authorities should grant full freedom of movement to all asylum seekers recognized as refugees in Dadaab's camps in accordance with Kenya's international and constitutional legal obligations, and UNHCR should advocate for full freedom of movement for all recognized refugees in Kenya. UNHCR should publish the criteria asylum seekers need to meet to justify applying for refugee status with UNHCR in Nairobi. UNHCR should also reduce to a minimum the average waiting time for Somali asylum seekers to be recognized as refugees to ensure that Somalis in Dadaab and in Nairobi are treated the same way, and to minimize the time that Somali asylum seekers are vulnerable to police abuses in Nairobi.
II. Recommendations
To the Government of Kenya
In relation to its refoulement of Somali refugees and asylum seekers
·Immediately cease all refoulement of Somali refugees and asylum seekers.
·Train Kenya's military and police, particularly soldiers and officers stationed in North Eastern Province, on the rights of Somali refugees and asylum seekers under the 2006 Refugees Act.
·Investigate all incidents of refoulement where Kenyan police officers are known to have forcibly returned Somali refugees or asylum seekers to Somalia and take appropriate disciplinary action.
In relation to the border closure
·In line with Kenya's obligations under international and Kenyan law, allow Somali asylum seekers to cross all parts of Kenya's border with Somalia, including at all official border posts.
·Immediately invite UNHCR to re-open its refugee transit center in Liboi to ensure the orderly registration of all newly arrived Somali asylum seekers crossing at or near the HarHar border point between Doble and Liboi; security permitting, allow UNHCR to transport all asylum seekers between HarHar and Liboi and Dadaab's three camps to help prevent police abuses against asylum seekers on their way to the camps.
In relation to Kenyan police bribes, arbitrary arrest, detention, and violence against Somali refugees and asylum seekers
·Immediately investigate possible systematic corruption and police abuses in Kenyan police stations in Dadaab's camps and in the towns of Garissa and Mwingi.
·Discipline or charge any officers found to have committed violence against Somali refugees and asylum seekers.
·Ensure that Kenyan police stop demanding bribes from Somali refugees and asylum seekers in exchange for free movement in Kenya and take action against police found to have demanded such bribes.
·In line with Kenya's international and constitutional legal obligations, and in the absence of any specific national security threat associated with the movement of any person, ensure that all recognized refugees, including those registered in Dadaab, have full freedom of movement throughout Kenya, and ensure that no refugee is arrested on charges of "residing without authority" outside of Dadaab's camps; the Department of Refugee Affairs should issue all registered refugees in Dadaab with identity cards that guarantee such free movement.
In relation to the land crisis in Dadaab's camps
·Recognize that land for new camps with a capacity of 150,000 refugees is urgently needed in North Eastern Province and engage with the UN to quickly acquire land for new camps.
·Reach agreement with the UN on a comprehensive long-term joint approach for all future negotiations with local community representatives from Lagdera and Fafi constituencies, to ensure that those communities' medium and long-term development grievances are effectively addressed.
In relation to Department of Refugee Affairs' mandate in Dadaab and Nairobi
·Produce a public document that sets out in clear terms the criteria and procedures for refugees to obtain movement passes to travel from Dadaab to Nairobi, including the procedure for appealing refusals.
·Clarify the Department's current capacity to register Somali (and other) asylum seekers by publicly confirming that Somali nationals who have arrived in Kenya since the outbreak of war in Somalia in 1991 are able to register prima facie as refugees and by confirming the rights that attach to this status.
To UNHCR
In relation to Kenya's unlawful deportation of Somali refugees and asylum seekers
·Increase monitoring of Kenyan police practices in and around the town of Liboi and between Liboi and Dadaab's camps and interview new arrivals in Dadaab's camps to collect possible testimony from witnesses to police abuse and refoulement.
·Swiftly intervene with the Kenyan authorities whenever UNHCR receives reports of imminent refoulement and denounce refoulement whenever it is found to have occurred.
·Raise concerns over Kenya's refoulement of Somali refugees and asylum seekers at the 2009 meeting of UNHCR's Executive Committee in Geneva.
In relation to Kenyan police arbitrary arrest and detention of, and violence against, Somali refugees in police stations in Dadaab's camps
·Promote regular training of all Kenyan police officers working in police stations in Dadaab's camps on the rights of Somali refugees and asylum seekers under the 2006 Refugees Act, the 1951 Refugee Convention, and the 1969 OAU Convention, including their rights to be free from arbitrary detention and all forms of violence.
·In light of the ongoing abuse of refugees in police stations in Dadaab's camps, review UNHCR's protection work with Dadaab's police to ensure that refugees are more effectively protected against such abuses, document allegations, and raise incidents of alleged abuse with the heads of the police stations, with the Dadaab-based Department of Refugee Affairs, and with the Police Commissioner in Nairobi.
·Discontinue UNHCR's support for the Kenyan authorities' movement pass system for refugees in Dadaab's camps and in line with international refugee and human rights law, advocate for refugees to be granted full and unrestricted freedom of movement throughout Kenya.
In relation to registration of new arrivals in Dadaab's camps and corrupt security guards at UNHCR's gates
·Commit adequate resources at all times to UNHCR's registration procedures in all three of Dadaab's camps to ensure that all new arrivals are registered with as little delay as possible and receive food during the next available distribution cycle; only discontinue registration in all three camps once a new camp has been established where all new arrivals can be registered.
·Organize refugee registration and other operations to prevent corruption among Armed Group Kenya security guards (the UNHCR-hired guards).
·Investigate all allegations of corruption among Armed Group Kenya security guards and dismiss any guards found to be demanding bribes from refugees.
In relation to the land-crisis in Dadaab's camps
·Request the UN Humanitarian Coordinator, UNDP, and UNEP to join UNHCR and meet with the Ministries of Immigration and Registration of Persons, Land, Planning and National Development, Development of Northern Kenya and Other Arid Areas, and Special Programmes to adopt a joint approach for negotiations with local community representatives from Lagdera and Fafi constituencies for further new land capable of accommodating at least 100,000 Somali refugees.
·Formally request the United Nations Country Team, and in particular UNDP and UNEP, to take over these land negotiations because they have greater capacity than UNHCR to deliver the development-related products and services local negotiators are seeking from the UN in exchange for expansion of land for more refugee camps.
In relation to UNHCR's mandate in Nairobi
·In line with rapid UNHCR procedures in Dadaab and to help minimize Somali asylum seekers' vulnerability to Kenyan police abuses in Nairobi, ensure UNHCR determines their refugee status under the 1969 OAU Convention and the 1951 Convention as rapidly as possible.
·Publish the criteria UNHCR uses to decide that a Somali asylum seeker applying for refugee status in Nairobi has a right to remain in Nairobi instead of being required to seek refugee status in Dadaab's camps.
To the African Commission on Human and Peoples' Rights Special Rapporteur on Refugees, Asylum Seekers, IDPs and Migrants in Africa
In relation to Kenya's refoulement of Somali refugees and asylum seekers
·Call on Kenya to end its violation of the principle of nonrefoulement.
·Investigate and report to the African Commission on Human and Peoples' Rights on Kenya's refoulement of Somali refugees and asylum seekers.
In relation to the border closure
·Call on the Kenyan authorities to respect their international obligations to ensure that all Somali asylum seekers can access Kenyan territory to claim asylum.
·Call on the Kenyan authorities to allow UNHCR to re-open its Liboi transit center to ensure the orderly registration of all newly arrived Somali asylum seekers crossing at or near the HarHar border point between Doble and Liboi.
In relation to restrictions on refugees' freedom of movement in Kenya
·Call on the Kenyan authorities to guarantee refugees full and unrestricted freedom of movement throughout Kenya.
To other governments providing funding for Somali refugees and asylum seekers
In relation to Kenya's refoulement of Somali refugees and asylum seekers
·Raise Kenya's violation of international refugee law with the Kenyan authorities and call on them to put an immediate halt to these practices.
·Include in reviews of bilateral aid to Kenya reports on Kenya's violation of international refugee law.
·Raise Kenya's violation of international refugee law during UNHCR's 2009 Executive Committee meeting in Geneva.
In relation to the border closure
·Call on the Kenyan authorities to respect their international obligations to ensure that all Somali asylum seekers can access Kenyan territory to claim asylum.
·Call on the Kenyan authorities to allow UNHCR to re-open its Liboi transit center to ensure the orderly registration of all newly arrived Somali asylum seekers crossing at or near the HarHar border point between Doble and Liboi.
In relation to Kenyan police corruption and abuses against Somali refugees and asylum seekers
·Raise the incidents of Kenyan police corruption and abuses against Somali refugees and asylum seekers noted in this report with the Kenyan authorities.
·Request the Kenyan authorities to take concerted action to put an end to such practices and to prosecute all police officers found guilty of abuses against Somali refugees and asylum seekers.
In relation to Dadaab's camps
·Urge UNHCR to request the UN Country Team, in particular UNDP and UNEP, to take over negotiations with national and local officials for land for a fourth and fifth camp so that UNHCR can focus on areas falling within its mandate and area of competence.
·Respond generously to UNHCR's December 19, 2008, Supplementary Appeal for US$92 million to address the massive needs and humanitarian crisis in Dadaab's camps and/or commit funds directly to NGOs working in the camps.
·Press UNHCR to stop all security guard corruption in its camp compounds.
III. Methodology
This report is based on research conducted in Kenya between October 6 and 24, 2008.
Human Rights Watch conducted in-depth interviews with 54 Somali refugees (including 30 adult females and four children, two girls and two boys) in the three refugee camps (Dagahaley, Hagadera, and Ifo) near Dadaab town in Kenya's North Eastern Province.
Human Rights Watch worked with local contacts to identify areas in the Dadaab camps where recently arriving refugees were known to have settled. Interviews with refugees in Dadaab's camps were conducted individually in settings isolated from other refugees (under trees or in refugees' shelters) and lasted an average of 45 minutes. All interviews were conducted in English and Somali using a Somali interpreter of Kenyan nationality.
In Eastleigh, Nairobi, Human Rights Watch conducted 11 interviews with Somali refugees (five male, six female). A Kenyan journalist familiar with Eastleigh and members of a local nongovernmental organization (NGO) working with Somali refugees identified refugees to interview.
In Dadaab town, Human Rights Watch conducted a further 20 interviews with staff from United Nations agencies and national and international NGOs, as well as with representatives of the Department of Refugee Affairs (DRA) and a Member of the Kenyan Parliament.
In Nairobi, Human Rights Watch conducted a further 14 interviews with staff from United Nations agencies and international NGOs, five interviews with staff from Kenyan NGOs, interviews with staff from five embassies and three donor agencies based in Nairobi, and interviews with the DRA and a Member of the Kenyan Parliament.
Where individuals or agencies requested that some or all of their interviews not be attributed to them, Human Rights Watch has not identified those individuals or their agencies or the precise date on which the interview took place. For their safety, Human Rights Watch has also not published the names of any Somali refugees interviewed in this report.
IV. Border Closure, Refoulement, and Police Abuses in Border Areas
Since Kenya officially closed its border with Somalia in January 2007, at least 80,000 Somali asylum seekers have entered Kenya. This continuous cross-border movement gives the impression that the border closure has not affected Somali asylum seekers' ability to seek refuge in Kenya. In reality, however, the border closure has led to the forcible return of asylum seekers and refugees to Somalia by Kenyan police (in violation of Kenya's fundamental obligations under international and Kenyan refugee law), and to serious Kenyan police abuses of Somali asylum seekers and refugees. By forcing the closure of a UNHCR-run registration center close to the border, Kenyan authorities have seriously aggravated the humanitarian assistance needs among Somalis arriving in three refugee camps near the Kenyan town of Dadaab, which shelter almost 260,000 refugees, making them the world's largest refugee settlement.[1]
The border closure and closure of UNHCR-run refugee transit center in Liboi
Border closure
Following the intervention of Ethiopian troops in support of the Transitional Federal Government of Somalia (TFG) in December 2006, the Kenyan authorities announced the closure of Kenya's border with Somalia on January 3, 2007.[2] Referring to concerns that UIC fighters and possibly Al-Qaeda operatives fighting side by side with them might enter Kenya and endanger Kenya's national security, and echoing statements by the US State Department,[3]Kenya's then Foreign Minister Raphael Tuju said that Kenya was "not able to ascertain whether these people [Somali refugees] are genuine refugees or fighters and therefore it's best that they remain in Somalia."[4] That same day, Kenyan authorities deported 420 mostly women and children to Somalia.[5]National and international agencies condemned the border closure.[6]
Despite the closure, at least 80,000 Somali refugees crossed into Kenya in 2007 and 2008, reflecting the fact that Kenya's 682-kilometer border with Somalia is porous and hard to police.[7] In June 2008, Kenya's immigration minister publicly declared that "the border closure has not achieved what it was intended for."[8]
According to humanitarian workers and Kenyans with a good knowledge of the Kenya-Somali border, in 2007 and 2008 the vast majority of Somali asylum seekers entered Kenya at the HarHar border crossing, located three kilometers from the Somali border town of Doble and 15 kilometers from the Kenyan border town of Liboi.[9] Dadaab's camps are located about 100 kilometers from the border.[10]
Closure of UNHCR-run refugee transit center in Liboi
Before Kenya's border closure, UNHCR registered newly-arrived asylum seekers at their refugee transit center in Liboi. After completing registration and health-screening,[11] UNHCR transported them to the camps where they were directed to their plots of land.[12]
The border closure forced the transit center to close.[13] Although the Kenyan authorities knew they could not prevent Somali refugees from crossing the porous border, they sought to portray an image of sovereign control in the face of perceived Islamist threats to Kenya's security.[14] The existence of a UNHCR center set up to welcome refugees 15 kilometers from an officially closed border sent a contradictory message, in their view.[15]
After the transit center closed, UNHCR continued to register refugees who managed to find their own way to the camps. The Kenyan authorities agreed to this compromise, although they initially set a total limit of 2,000 refugees. When UNHCR continued registering asylum seekers well beyond that limit, the authorities did not intervene.[16] This unspoken compromise sought to avoid embarrassing the government, while simultaneously allowing UNHCR to register and assist new refugees in Dadaab, and continues to this day.
The Liboi transit center closure has had two serious implications for Somali refugees fleeing to Dadaab.
First, the closure means UNHCR can no longer register all new refugees in one place the moment they enter Kenya. Instead, it is obliged to register refugees in Dadaab's three sprawling and separated camps.[17] Even in ideal circumstances-with registration centers and sufficient registration staff in each camp-this process would lead to delays in registration and, therefore, in access to food, water, shelter, and health services. In the less than ideal circumstances in Dadaab's camps-where between June and December 2008 registration of record numbers of refugees took place in only one camp-the fact that UNHCR was forced to register new refugees in the camp led to significant registration delays of many weeks or even months and, even worse, to possibly thousands of refugees failing to get registered at all. The details of this situation are set out below in chapter V.
Second, Human Rights Watch documented serious Kenyan police abuses against Somali refugees between the border and Dadaab's camps, including systematic bribery and reports of violence, including rape. The details are set out below. Re-opening the Liboi transit center-and particularly re-introducing UNHCR transfer of refugees from the border to the center and from the center to the camps-would significantly protect Somali refugees from Kenyan police abuses.
Both Kenya's Department of Refugee Affairs and UNHCR have continuously called on the Kenyan authorities to allow UNHCR to re-open the transit center.[18] On November 19, 2008, the US embassy in Kenya added its voice to these calls, stressing that "Kenya is obligated to allow Somalis to cross the border to seek asylum," and that "a reception center for orderly registration and medical and security screenings is urgently needed to provide protection to the Kenyan host population and for the refugees in the camp." It urged "the Government of Kenya to re-open and authorize expansion of the Liboi Reception Center near the Somali border to meet the needs of new asylum seekers."[19]
Refoulement (unlawful forced refugee return)
Since the border closure, the Kenyan authorities have deported hundreds if not thousands of Somali refugees and asylum seekers back to their war-torn country, thereby violating the most fundamental part of refugee law, the right not to be refouled – forcibly returned to a place where a person faces a threat to life or freedom on account of race, religion, nationality, membership of a particular social group, or political opinion.[20] In accordance with its obligations as party to the 1969 OAU Convention Governing the Specific Aspects of the Refugee Problems in Africa, Kenya is further obliged not to send refugees back to situations of generalized violence such as in Somalia.[21]
Prohibition of refoulement
Under its Immigration law, Kenya has the right to regulate who is present on its territory and may prevent certain categories of people from entering or remaining in Kenya, including those deemed to be a threat to its national interests.[22] Since the 1998 embassy bombings in Kenya and Tanzania, there has been increased concern within Kenya over potential incursions of terrorist suspects from Somalia. These concerns were heightened when the Union of Islamic Courts took power in Mogadishu in June 2008. Following the Ethiopian intervention in Somalia in December 2006 and a Somali militia incursion into El Wak in November 2008,[23] Kenyan security forces have been deployed along the Somali-Kenyan border in increased numbers.[24]
Despite these legitimate security concerns, Kenyan law-consistent with its international legal obligations-obliges Kenya to allow asylum seekers access to Kenyan territory to seek asylum and prohibits their refoulement.[25]
Applying the definition of a refugee in the OAU Refugee Convention, Kenyan law also provides that any non-Kenyan in Kenya has the right not to be returned to a place where "the person's life, physical integrity or liberty would be threatened on account of external aggression, occupation, foreign domination or events seriously disturbing pubic order…,"[26] and that such persons shall automatically be deemed to be a refugee ("primafacie refugee").[27] Somalis registering in Dadaab with UNHCR and-to an unknown extent-Somalis registering with the Department of Refugee Affairs in Nairobi are automatically granted status in Kenya based on this prima facie recognition.[28]
An asylum seeker claiming refugee status in Kenya has a right to have his or her case considered. Kenya may only deny a person refugee status who otherwise qualifies under the criteria in the OAU Refugee Convention if the person falls within one or more categories excluded from refugee status by Kenyan law, and then only after it has conducted an individual review of that person's background.[29] In addition, like all asylum seekers in Kenya, Somali asylum seekers are entitled under Kenyan law to seek asylum wherever the Department of Refugee Affairs or UNHCR has offices in Kenya.[30] They are, therefore, legally entitled to do so in Dadaab or in Nairobi and, regardless of whether they have entered Kenya through an official border crossing point or not, are theoretically free to travel from the Somali border to either of those two places without being arrested or detained.[31] However, as set out below, Kenya actually continues to violate these fundamental rights.
Reports of refoulement and attempted refoulement in 2008 and 2009
Throughout 2008 and in early 2009, the Kenyan authorities refouled, or attempted to refoule, hundreds of Somali refugees and asylum seekers. As Kenyan organizations and lawyers working with Somali refugees and asylum seekers know that they are only rarely made aware of case of imminent deportations, Human Rights Watch believes that these known cases are only the tip of the iceberg and that possibly thousands of Somalis suffered a similar fate. Refoulement often took place in remote border areas, where asylum seekers have no way of contacting lawyers, Kenyan NGOs, or UNHCR. Kenyan NGOs and lawyers told Human Rights Watch that cases of which they became aware in 2008 are a small percentage of the true number of Somalis being arrested, detained, fined, and then refouled to Somalia.[32]
Refoulement
On May 9, 2008, Kenyan police intercepted 10 asylum seekers (all women and children) at UNHCR's then-closed refugee transit center and took them to the border.[33]
In mid-May 2008, a group of about 20 Somali asylum seekers arriving at the camps for the first time were arrested by Kenyan police at 2 am as they entered Ifo camp and were detained for three days in the camps' police station before being unlawfully returned to Somalia.[34]
Human Rights Watch spoke to two Somali girls who in two separate almost identical incidents in July 2008 were unlawfully deported to Somalia (though they later returned to Kenya), together with 70 other Somali refugees and asylum seekers, after having been detained and beaten in Garissa and Mwingi police stations[35] for 10 days:
We were driven in the back of trucks from Garissa police station straight to the border. Whenever anyone tried to stand up, the police beat them with sticks. When we arrived at the border, the police told us to walk across the border to Doble and not to come back.[36]
On September 9, 2008, Kenyan police intercepted a minibus near Dagahaley camp carrying 19 asylum seekers and five refugees, all of whom were transported to Wajir, northeast of Dadaab, before being returned to Somalia.[37]
In the early evening of October 10, 2008, a witness in Liboi saw Kenyan police round up close to 100 Somalis, put them in a civilian bus, and drive them toward the border. Later the same day the same witness spoke to colleagues in Liboi who interviewed the Somalis on arrival in Doble, on the Somalia side of the border.[38]
Human Rights Watch also heard credible evidence from two people living and working in and around Liboi that Kenya's Rapid Deployment Unit, active in the border areas in 2008, has regularly turned back buses at the border crossing point of HarHar or-after they redeployed in around mid-2008-from areas about half way along the 15-kilometer stretch of road between HarHar and Liboi.[39] Because of this unlawful practice, that risks forcing asylum seekers back across the border, mini-buses from Doble drop asylum seekers in the bush just across the border at HarHar and tell them to walk to Liboi or to other pick-up points in the bush between HarHar and Liboi.[40] Kenyan security forces are likely to spot the Somalis walking through the bush toward Liboi and-based on Human Rights Watch testimony in this report -are likely to subject them to arrest, detention, abuse, and refoulement.
In early 2009, Kenya continued to refoule refugees and asylum seekers, some under appalling circumstances.
On January 16, Kenyan police opened fire on a vehicle driving in the border areas near Liboi, injuring three Somali nationals who were among 29 people who had just crossed the border. They were taken to the health center in Dadaab town where they were confirmed to be asylum seekers from Somalia's capital Mogadishu. According to hospital staff, six Kenyan police officers entered the health center on January 21, ordered the three wounded asylum seekers into a van, and drove towards the border. The same day the Kenyan authorities confirmed that the three had been returned to Somalia.[41]
On January 25, Kenyan police arrested almost 100 Somali nationals, including 59 children under the age of 12, in the town of Wajir, approximately 100 kilometers from the border and 230 kilometers from Dadaab's camps, charged them with "illegal presence," fined them, and deported them to Somalia.[42]
Attempted refoulement
In 2008, the Refugee Consortium of Kenya (RCK) successfully organized legal representation, which helped prevent the refoulement of 150 Somali refugees and asylum seekers.[43]
On May 23, Somali asylum seekers were arrested on the island of Lamu. Thanks to an immigration officer trained by RCK in refugee law, no deportation orders were issued and they were handed over to UNHCR.
Between April and August, the RCK represented 47 Somali asylum seekers who had arrived in Kenya by boat and who were arrested in the coastal towns of Mombasa and Malindi and were threatened with deportation. The court quashed the deportation orders and instructed the Kenyan authorities to take the refugees to Dadaab's camps.
Between April and September, the RCK secured the release of 38 asylum seekers (including 13 Somalis) arrested in Nairobi on charges of unlawful presence in Kenya.
On December 3, 28 Somali asylum seekers traveling to Nairobi were arrested in the coastal town of Taveta. The RCK secured their release and ensured they were handed over to the Department of Refugee Affairs and UNHCR for registration.
Also in December, Kenyan police arrested 55 Somalis as they approached Dadaab's camps. The RCK intervened just before they were deported and a court ordered the police to release them and take them to Dadaab's camps.
Kenyan police bribes, detention, and violence in the border areas, in Dadaab's camps, and on smuggling routes
The border closure has led to widespread Kenyan police malpractice and related abuses against Somali refugees in the border areas. Human Rights Watch spoke to many refugees in Dadaab and with Nairobi-based NGOs working with refugees who confirm that Somali (and other) refugees have been victims of Kenyan police demands for bribes and other abuses for many years.
Police officers demand bribes in exchange for allowing onward movement to Dadaab or Nairobi. If they refuse or cannot pay the bribe, refugees are detained in appalling conditions in overcrowded cells with no space to sleep and at times with no access to latrines. Some are beaten and Human Rights Watch spoke to a young girl who was raped in a police station in one of the refugee camps. Those who finally are unable to pay are deported back to Somalia.[44]
Kenyan police corruption in the border areas and throughout Kenya is not new. Kenya's police force is known to be the most corrupt of Kenya's public institutions, leading Transparency International's 2008 Kenyan bribery index for the fourth year in a row.[45]
However, the border closure and the related Liboi transit center closure have made a bad situation worse. The absence of UNHCR protection and transportation between the border and Dadaab's camps means that Kenya's police now have free reign to intercept and demand bribes of Somali refugees attempting to reach Dadaab's camps, threatening deportation and inflicting violence if refugees refuse.
Under the Kenyan Constitution, which reflects key provisions of international human rights treaties to which Kenya is party, including the International Covenant on Civil and Political Rights,[46] all people in Kenya, including refugees and asylum seekers, are entitled to protection of their property,[47] freedom from arbitrary arrest and detention,[48] and freedom from all forms of inhuman and degrading treatment or punishment.[49] The border closure has, therefore, unquestionably led to an increase in serious human rights abuses against Somali refugees and asylum seekers, a point which UNHCR raised with Kenyan government officials at the highest level in January 2009.[50]
Demands for bribes between the border and Dadaab's camps
The border closure has seen the growth of a lucrative people-smuggling network between Doble and Dadaab, with Somali asylum seekers paying smugglers fees to ensure they can safely cross from Somalia to Dadaab's camps.[51] Kenyan police corruption in the border areas is so endemic that smugglers reportedly include the cost of Kenyan police bribes in their fees, although this does not guarantee safe passage once in Kenya.[52] Even before leaving home in Somalia, asylum seekers know that they should take as much money as possible with them to pay for additional bribes.[53]
Human Rights Watch spoke to many Somali asylum seekers and refugees who described how the Kenyan police stopped their vehicles between the border and Dadaab's camps and asked the driver for money.[54] The following are just some examples.
On October 10, 2008, two Somali female refugees in their mid-thirties with their 15 children crossed the border from Doble and reached Liboi. The next morning they boarded a minibus and drove on the road towards Dadaab. The Kenyan police stopped them at a check point, told all the men to get out of the bus and run away (which they did), and told the women and children to stay on the bus. They then told the driver that everyone on the bus would be returned to Somalia, unless the driver collected US$100 per family. The refugees managed to pay enough to secure their onward journey to Dadaab's camps.[55]
In mid-September 2008, a 40-year-old widow with eight children paid people smugglers $100 to travel the 100 kilometers from Doble to Dadaab through the bush where the vehicle with 30 Somali asylum seekers was intercepted by Kenyan police. The police demanded the driver pay to be allowed to continue, which he did.[56]A 32-year-old woman with seven children recounted almost the exact same story about her journey that took place in mid-August 2008.[57]
According to UNHCR, it "frequently conducts … border monitoring missions to Liboi," although it says it would like to increase its capacity to ensure wider and more systematic monitoring of the border areas.[58]
Bribes, detention and related police violence near and in Dadaab's camps
Even when refugees manage to reach Dadaab's camps, they still face the risk of Kenyan police bribes, arrest, detention, and violence, including in Kenyan police stations inside the camps.[59]
Human Rights Watch spoke with a 17-year-old girl who was intercepted, together with 20 other Somali asylum seekers, by Kenyan police in February 2008 as they reached Hagadera camp. She and the other asylum seekers were held at the Gadudey police post[60] for 10 days when refugees from the same clan in Hagadera camp paid a $300 bribe to secure their release. In the evening of the eighth day of her detention, the police raped her:
I left the cell to go to the toilet but two policemen stopped me and told me to go into a room and lie down. One of the men held down my arms and the other raped me. I was so scared that I couldn't even shout but then the second man wanted to rape me and I started to scream. The first one tried to choke me but I struggled and they let me go. They left the room, locked the door and left me alone for one hour. Then they took me back to the cell. The others asked me where I had been but I could not tell them. I was too ashamed. This is the first time I have talked about it.[61]
A 16-year-old girl explained how she was dropped off by a minibus close to Ifo camp in early September 2008, where a pre-arranged "guide" met her and other refugees to bring them to the camp. Less than a kilometer from the camp the group was intercepted by the Kenyan police and she was taken to the police station inside Ifo camp:
The police held me for three days and nights in a police cell. There were 30 other refugees in the cell. They had all recently arrived in the camp. The police asked us for money so that we could be released. When we said we had no money they beat us. They beat me on my arms, legs and back with a wooden stick and with a rubber whip made out of a car's tire. They beat me three times for about five minutes each time. After the third beating I was in so much pain that I gave them $50 I had hidden under my headscarf. Then they let me go.[62]
Police near Dadaab town also demand bribes and threaten deportation. A 34-year-old man told Human Rights Watch that he arrived from Somalia in Dadaab town on August 25, 2008, and then started walking towards Ifo camp. Close to Dadaab's airport, the police stopped him and, on hearing he had just arrived from Somalia, demanded he pay 4,000 Kenyan Shilling (K Sh), about US$50, or face deportation to Somalia.[63]
These abuses are all the more concerning because UNHCR has increased its "visits" to police bases in the camps since August 2008 to at least three a week. It now regularly organizes security meetings between refugees, the police operating in the camps, and NGOs to discuss "operational concerns."[64]
UNHCR says that most police cases drawn to its attention in Dadaab involve arrest and detention of refugees charged with "illegally being outside a designated area." Under the 2006 Refugees Act, a person who "resides without authority outside the designated areas specified under" the Act "commits an offence," and is liable to a fine of up to K Sh20,000 ($2,500), imprisonment of up to six months, or both.[65] However, to date the Minister of State for Immigration and Registration of Persons has not designated Dadaab's three camps as refugee camps,[66] which means that refugees moving in and out of Dadaab's camps cannot lawfully be charged with (or detained in relation to) "residing outside a designated area." In addition, even if the camps were to be officially designated as refugee camps, international refugee and human rights law and Kenyan Constitutional law prohibits the Kenyan authorities from limiting refugees' right to free movement outside the camps, unless special circumstances apply. This is looked at in chapter VI.
Bribes, detention, and related police violence between Dadaab and Nairobi
Human Rights Watch spoke with people living and working in Dadaab and Garissa who know bus drivers working between the camps, Garissa town (100 kilometers south west of Dadaab), and Nairobi. They confirmed that a bus ticket for Somalis includes the cost of bribing Kenyan police along the Dadaab-Garissa-Nairobi road.[67] One refugee told Human Rights Watch that corrupt police permanently man the Tana Bridge on the edge of Garissa, on the only land route to Nairobi, and that Somali refugees refer to the bridge as "halak," meaning cobra.[68]
A 23-year-old Somali refugee traveling from Garissa to Naiorbi with her seven-month-old baby told Human Rights Watch that when she reached the Tana Bridge the police boarded the bus and took all passengers without identity documents to the police post next to the bridge and demanded K Sh4,000 ($50) from each of them to allow them to continue their journey.[69]
Human Rights Watch spoke with one refugee who had paid $100 to travel from Garissa to Nairobi, including the cost of police bribes:
Whenever the police stopped the car, they looked at me on the back seat and then asked the driver "do you have any mbuzi ?" ("goods"), which was a reference to me as a possible foreigner without identity papers. Each time the driver said, "Yes, I have one mbuzi," and paid them money.[70]
Human Rights Watch spoke with two girls, aged 15 and 17, who had escaped sexual violence in Mogadishu. During their attempt to reach Nairobi from Dadaab, unknown people-almost certainly cooperating with the smugglers-beat and robbed them and Kenyan police demanded bribes and subjected them to appalling treatment, including violence, in Garissa and Mwingi police stations, before deporting them to Somalia. One of the girls' full story is set out in full above.[71]
V. Humanitarian Crisis in Dadaab's Camps
The services in Dadaab are well below any minimum standards. There are huge needs in all sectors and we don't have the money to do anything about it. We can't even go look for the most vulnerable refugees because when we find them, we can't help them. It's overwhelming. We have asked that this situation be officially declared an emergency but that hasn't happened.[72]
-Aid worker in Dadaab refugee camp.
The huge 2008 increase in Somali refugees entering Kenya has placed a massive strain on Dadaab's refugee camps.[73] Although the camps' infrastructure was designed for 90,000 people, by end February 2009 the camps held just over 255,000 registered refugees who lacked just over 40,000 shelters. At the end of August 2008, the final camp was declared full. Between then and the end of February 2009, just over 35,144 registered new arrivals have received no shelter and are forced to live in cramped conditions with relatives or strangers. Because only limited additional land (for up to 50,000 refugees) has been promised so far, and because it will take at least until July or August 2009 to build a new camp, the number of refugees without any or adequate shelter will dramatically increase in 2009. Local politicians and community leaders demand that impoverished local Kenyans benefit more from aid agencies' presence in Dadaab before new land will be provided to the refugees. A registration crisis throughout much of 2008 has meant thousands of unregistered refugees have waited weeks, and in some cases months, to receive food, and struggle to access water and healthcare.
Severely under-funded even before some 80,000 new refugees registered in Dadaab's camps in 2007 and 2008, aid agencies working in the camps urgently need additional funding for their work. Acute malnutrition, including amongst under-fives and infants, stands at 13 percent,[74] and many refugees are forced to sell food to buy essential items such as firewood and basic household goods. Dadaab's crumbling water system officially provides only 16 liters per person per day-four liters below the absolute minimum required-and due to a number of factors the true amount is almost certainly far less. Sanitation conditions are appalling: just over 36,000 latrines are needed to reach minimum standards,[75] women and children (half the camps' population) cannot use the latrines, and a recent assessment by Oxfam concluded that the situation is conducive to a public health emergency. Healthcare teams-under-staffed and missing basic drugs-cannot cope with growing chronic needs and crude, maternal, infant, and under-five mortality rates are all far below international standards.
Overcrowding
"A whole new camp has walked in this year."[76]
Land shortage
When Dadaab's three camps first opened in 1991/2, their infrastructure-water piping, food distribution centers, and healthcare centers-was designed to accommodate 90,000 people.[77] By end 2005, the total number of refugees in the camps stood at 127,000; by February 2009 the number had doubled to just over 255,000.[78] 61,761 new refugees arrived in 2008 alone, a growth of 36 percent, and a further 14,009 refugees arrived in January and February 2009.[79] Based on an estimate of at least 5,000 new refugees per month, Dadaab's camps are projected to house at least 300,000 mainly Somali refugees by the end of 2009, though UNHCR estimates this number could rise to as many as 360,000.[80]
Over the years, the camps slowly expanded.[81] But in early 2008 local government representatives, the Dadaab (Kenyan) host community, and the Member of Parliament (MP) for Lagdera constituency, Farah Maalim, refused permission for the camps to be extended further.[82] They argued that refugees were destroying the local environment (by felling trees, cutting bush, and particularly by grazing livestock on pastoralist land) and that the host community was not benefiting enough from the UN and NGO presence in terms of economic development and employment opportunities, especially for unskilled labor.[83] In response to this pressure, the last plot of available land was distributed on August 20, 2008 and a week later UNHCR declared all three camps full.[84]
Since then new arrivals have not been given plots of land, receive no shelter materials, and have no choice but to settle with relatives or strangers on existing plots of land. Between August 20, 2008, and February 28, 2009, officially 35,144 new refugees arrived in Dadaab, and are now squatting with refugees who were living on plots of land that were already too small for their needs.[85] With predictions that at least another 50,000 refugees will arrive from Somalia in 2009, the need for new land is urgent.
In light of recent UNHCR reports that "the lack of shelter and the limited police presence has made it difficult to prevent sexual violence in the camp[s]," the urgency is even greater.[86]
Stalled negotiations and limited progress on land for a fourth camp and the need for a fifth camp
Since some time in 2007, UNHCR has unilaterally and-until February 2009-unsuccessfully tried to negotiate an agreement for new land for a fourth camp to house new arrivals.[87]
Initially, UNHCR tried to negotiate for land in the Lagdera constituency (represented by Farah Maalim, MP), but these negotiations soon stalled after the local host community demanded increased development aid and employment opportunities in return for an agreement.[88]
In 2008, UNHCR identified land located about 15 kilometers to the south east of Dadaab town, near the town of Kambi Oss.[89] The land is located in Fafi constituency represented by Alan Sugow, MP. Between September 2008 and January 2009, the negotiations stalled after the host community and its MP asked UNHCR to create a new UNHCR sub-office in the town of Alin Jugor, close to Kambi Oss, that would manage the new camp and one of the three old camps (Hagadera) which is also located in Fafi constituency.[90]
However, following a verbal agreement between UNHCR and the local community, in early February 2009 UNHCR announced that Kenya's prime minister had committed to providing land in Fafi District for a fourth camp near Dadaab, capable of sheltering up to 50,000 refugees to help decongest the existing camps.[91] At the end of February 2009, UNHCR told Human Rights Watch that it believed that the land could in fact hold 120,000 refugees, and that camps built on the land could be used to decongest the existing camps or shelter new arrivals.[92] However, Adan Sugow, the MP representing the local Kenyan community living near the new land, stated that in accordance with UNHCR's initial announcement, the agreement relates to land for a maximum of 50,000 refugees of whom 30,000 should be transferred from Hagadera camp and a further 20,000 from Dagahaley and Ifo camps.[93] Any additional land-either for more relocations to help further decongest the existing camps or for new arrivals in 2009 from Somalia-will have to be negotiated in a separate agreement.[94] In March 2009, UNHCR stated that the land for the 50,000 refugees had been "tentatively allocated," that it was "undergoing vetting by local councillors, who have indicated their support with many conditions including the request that the entire [camp] be fenced off," and that "other conditions remain ambiguous."[95]
Although the February 2009 agreement is a welcome development, the land shortage crisis in Dadaab's camps is set to get far worse before a sustainable solution is found. A conservative estimate of the number of refugees living in Dadaab's three camps by mid-2009 is 280,000.[96] If 50,000 refugees were then to be transferred to a fourth camp in July 2009, at least 230,000 refugees-far in excess of the camps' capacity-would remain in the existing three camps and, together with the new fourth camp, would have to take in new refugees arriving after June 2009.
These statistics speak for themselves; even if 50,000 refugees are transferred in mid-2009, additional land is needed to house a further 100,000 refugees to accommodate new arrivals and reduce the number of refugees in Dadaab's existing three camps to 150,000.[97] Proper contingency planning-reflecting UNHCR's estimate of a possible 120,000 Somali refugees arriving in Dadaab by the end of 2009-would require land capable of housing even beyond that number.
The need for the United Nations Country Team (UNCT) to step in
In its attempt to lease more land, UNHCR has faced resistance from two different host communities because they feel they have not sufficiently benefited in development terms from almost 20 years of UN and NGO presence in the area. The local Kenyan community in Fafi District, where limited new land was granted in early February 2009, has made it clear that any further agreements must involve environmentally sustainable camps and development benefits for local residents.[98] According to UNDP, North Eastern Province (where Dadaab's camps are located) is one of the poorest areas of Kenya.[99]
On November 4, 2008, UNHCR for the first time asked the UNCT for assistance in helping UNHCR secure more land.[100] However, between then and the time of writing, UNHCR's initiatives have been limited to cooperation with its two UN agency partners working in Dadaab's camps (UNICEF and WHO), neither of whom are mandated to take the lead on broad development or environmental issues.[101] UNHCR appears to have taken no proactive steps with the United Nations Development Program (UNDP) and the United Nations Environment Program (UNEP).[102] In March 2009, UNHCR stated it would "work with host communities to initiate development projects … to help improve relations between the host communities … and refugees."[103]
Human Rights Watch believes UNHCR should urgently ask the Humanitarian Coordinator (HC), UNDP, and UNEP to meet with five Kenyan Ministries-Immigration and Registration of Persons, Land, Planning and National Development, Development of Northern Kenya and Other Arid Areas, and Special Programmes-to adopt a joint approach for negotiations with local community representatives from Lagdera and Fafi constituencies.[104] The Humanitarian Coordinator should lead these discussions on behalf of all UN agencies involved, as UNHCR has neither the expertise nor the resources to do so. By assuring the local community that meaningful development initiatives will be undertaken by UNDP and UNEP in conjunction with the Kenyan authorities, the discussions should separate the short-term emergency issue of securing more land for at least two more camps from the longer-term development issues.
Possible transfer of refugees from Dadaab to Kakuma
In addition to seeking land for new camps to help decongest Dadaab's existing camps, shelter new arrivals, and thereby ease Dadaab's humanitarian crisis, UNHCR has recently considered the idea of transferring some refugees to Kakuma refugee camp south of Kenya's border with Sudan.
During the first days of 2009, the Kenyan authorities informed UNHCR that due to "mounting security concerns," the Kenyan authorities had decided that "no land will be made available for new camps inNorth Eastern Province ."[105]Two days later, the Ministry of State for Immigration and Registration of Persons wrote to UNHCR giving the go-ahead for the transfer of 50,000 refugees from Dadaab to Kakuma camp, 1,798 kilometers from Dadaab by road.[106]
In November 2007 and July 2008, around 2,000 refugees were transferred from Dadaab to Kakuma at an estimated cost of at least US$600,000 ($300 per person) and possibly as high as $1,250,000 ($500 per person).[107] The journey from Dadaab to Kakuma takes three days and two nights.[108] Based on these figures, the cost of transferring 50,000 refugees would be between $15 million and $25 million, more than UNHCR's entire yearly budget for Dadaab's in 2007 and 2008.
As a result of these high costs and of the Kenyan authorities' commitment in early February 2009 to provide UNHCR with land for a fourth camp near Dadaab, UNHCR is now planning to transfer only around 10,000 refugees to Kakuma.[109]
Registration Crisis
In the second half of 2008, UNHCR faced a registration crisis in Dadaab. In December 2008, UNHCR found additional resources to try to improve registration coverage. Given UNHCR's planning projections for continuing high rates of refugee arrivals in 2009, UNHCR needs to maintain and improve its registration capacity in all three camps to prevent a repeat of the 2008 crisis.[110]
Between May and December 2008, at least three factors contributed to possibly thousands of new refugees not being registered: first, the January 2007 border closure and the related closure of UNHCR's transit center in Liboi which had previously ensured everyone was registered on arrival in Kenya; second, UNHCR's May 2008 decision to register new arrivals in only one camp, which led to particular problems for refugees arriving in the other two camps, both significant distances away;[111] third, difficulties new arrivals had in getting past corrupt Kenyan private security guards at the gates to UNHCR's compounds who demanded bribes of anything between K Sh 500 and 2000 ($6 – 24).[112]
Those not registered faced numerous assistance problems. Unregistered people did not get food rations. Although they should have had free access to water, they did not (and were forced to beg from and share with others). Many had difficulties in accessing healthcare because-contrary to official UNHCR and NGO policy-they were turned away for not having food ration cards, the only evidence of registration. Many registered refugees shared their food, water, and shelter with the unregistered, leading to a reduction in those goods for registered refugees.
The registration system
On May 31, 2008, Ifo and Hagadera camps were declared full and registration continued only in Dagahaley camp to encourage all new arrivals to settle there. But, on August 28, 2008, Dagahaley was also declared full.[113] Given that all camps were full and that new refugees were arriving and settling in all of them, UNHCR should then have re-started registration in all camps. However, this did not happen due to a combination of the extremely high number of new arrivals in July (7,383) and August (8,325) 2008, and UNHCR's lack of registration resources, which forced it to remain in one location.[114]
In October 2008, Human Rights Watch spoke to refugees who said they had tried and failed for weeks and at times months to get registered, which meant they and their families received no food, had to beg for access to water, and were in many cases denied access to healthcare.[115] The following story, of a 40-year-old man living under a tree at the back of UNHCR's compound in Dagahaley camp, is typical of many similar stories Human Rights Watch collected in the space of a few days:
I arrived with my wife and six children almost exactly three months ago and we were only properly registered three days ago. So we are supposed to get our first food in 10 days time. All this time, we have lived under this tree-under the sky-and have begged for food from other refugees. When we try to get water inside the camp, the refugees chase us away from the water taps. They say we don't live in their part of the camp so we are not allowed to have their water. I know so many other new refugees here who spend all day trying to find water for their children.[116]
Based on dozens of similar testimonies collected in the space of a few days-including testimony collected in one hour from heads of households representing 180 adults and children in a randomly selected area of one of the camps-Human Rights Watch believes that in the months leading up to October 2008, thousands of refugees faced similar delays in registration.[117]
Refugees gave a number of reasons why they could not be registered.[118] First, refugees in Hagadera and Ifo camps-a 56 kilometer and 20 kilometer return journey from Dagahaley camp, respectively-said that they had tried to get registered once or twice, but that it was too expensive or too far to continue to make the journey and that they had given up trying. Human Rights Watch spoke to a refugee who said that she had met refugees in the Somali border town of Doble who said that they had been to Dadaab, but were returning to Mogadishu because they had been unable to get registered.[119] Others said they had heard from other refugees about the registration difficulties they had faced so they did not even try.
Second, refugees from all camps said that UNHCR turned them away because on some days it said it did not have the capacity to process everyone. Finally, many refugees said they could not afford to pay the bribes demanded by Armed Group Kenya security guards which UNHCR employs at its gates. In October 2008, UNHCR in Dadaab told Human Right s Watch that they were aware of reports that the guards at their gates had taken money from refugees and that earlier in the year they had called a meeting to remind the guards that they were subject to a Code of Conduct.[120] In January 2009, two Armed Group Kenya Guards were suspended pending investigations into alleged misconduct.[121]
In December 2008, UNHCR added four clerks to its team of 15 registration clerks and in early 2009 sought to add a further seven to help register new arrivals and deal with all other registration issues in the camps.[122] In December 2008 and January 2009, UNHCR began registering refugees in a single stage (in place of the previous two-stage process[123]), thereby ensuring that new arrivals would immediately receive their food ration card and no longer have to wait weeks or months to get food. The registration team also rotated on a weekly basis between all three camps to ensure that new arrivals in Ifo and Hagadera did not have to travel to Dagahaley to get registered.[124]
Until a new camp is ready to take in new arrivals from Somalia, UNHCR needs to continue to register all new arrivals in all three camps to avoid a re-run of the 2008 registration crisis.
Humanitarian assistance crisis[125]
"Working here is so frustrating. The needs are overwhelming. We have a crisis of everything: space, water, sanitation and food."[126]
The humanitarian situation in Dadaab's camps is well below minimum required standards. Despite registered refugees receiving 2,100 kilocalories per day, a number of factors have led to food shortages, and by mid-2008 acute malnutrition stood at 13 percent. Refugees officially receive 16 liters of water per day each, four liters below the absolute minimum required under international aid standards, but for numerous reasons the actual quantity is likely to be even well below this figure. As of the end of February 2009, 40,271 shelters and 36,271 latrines were needed to bring the camp up to minimum standards. In March 2009, Oxfam concluded that minimum standards of access, design, and use of toilets are not being met and that the situation in the camps was conducive to a public health emergency. Healthcare teams are not able to address chronic health issues and are severely under-staffed to deal with the needs of the camps' rapidly growing population.
Food
The camps face a bad nutritional situation. According to UNHCR, by mid-2008 acute malnutrition stood at 13 percent,[127] and at the end of 2008 UNICEF faced the possibility of cutting its therapeutic feeding activities due to funding constraints.[128] In March 2009, UNHCR confirmed that the level of malnutrition among under-fives was "elevated" and remained below international standards.[129] The World Food Program (WFP) states that all registered refugees are given the minimum amount of food (2,100 kcal per day) required under the SPHERE Standards.[130] But at least two factors lead Human Rights Watch to believe that the average intake is well below this level.
First, refugees sell their rations to purchase shelter (which is no longer available from UNHCR since the last camp was declared full in August 2008), as well as essential non-food items such as wood (for fuel and shelter) and basic household items.[131] Second, refugees who have been in the camps for some time told Human Rights Watch that they share everything they have-including food-with new arrivals who cannot get registered. With a new UNHCR registration strategy in place since December 2008, this problem will hopefully be reduced.
Water
The camps' 17-year-old water system is in very poor repair and running at full capacity and "with a lot of effort" to ensure that officially all registered refugees receive 16 liters of water per day.[132] This is four liters below the absolute minimum of 20 liters required under international standards.[133] For at least four reasons, the figure of 16 liters is likely to be an overestimate of the true amount of water consumed by the average registered refugee in Dadaab.
First, it ignores large quantities of water used for livelihood activities such as providing livestock with water, brick-making, and large canteens using up to 200 liters of water per day to make ice for freezers to cool drinks.[134] Second, it ignores the thousands of unregistered refugees who beg registered refugees for water, which means the average consumption rate has decreased.[135]
Third, a recent assessment by Oxfam concluded that a number of factors relating to water distribution points-"volunteers" at tap stands charging refugees for water, insufficient new tap stands to cope with huge overcrowding in certain areas, low water pressure-means that many refugees have little or no access to water.[136] Finally, Dadaab's water system can maintain the average refugee's water intake despite the constant increase in refugees, but only by pumping more water (which at some point will require the use of more powerful pumps) and by increasing rehabilitation work on the water system's piping that aims to reduce leakage and to install larger pipes that increase the rate of water flow.[137] Although there is no way of measuring whether agencies' attempts to keep up with these mechanical and logistical challenges are enough to meet the increased needs of the camps' rapidly growing population, the system is running at full capacity. Without major investment it will inevitably be unable to cope.[138]
CARE told Human Rights Watch that a major pipe breach or the failure of one of the camps' 17 bore holes could lead to a serious water crisis in the camps.[139] In March 2009, UNHCR estimated that five new boreholes were needed to meet the demands of the camps' mushrooming population.[140]
Shelter
Even before the influx of at least 61,000 new refugees in 2008, Dadaab's refugees faced a massive shortage in adequate shelter with most refugees living in tiny makeshift shelters made of sticks and plastic sheeting. According to the Norwegian Refugee Council (NRC)-Dadaab's lead shelter and sanitation agency since mid-2007-by the end of 2007, Dadaab's 171,870 refugees lacked some 25,000 shelters and an additional shelter would be needed for every five new refugees arriving in 2008.[141] By the end of February 2009, UNHCR had registered an additional 76,356 new arrivals (who required 15,271 shelters), bringing the total shelter gap at the end of February 2009 to 40,271 shelters.
As noted above, two of the camps were officially declared full at the end of May 2008 and the last piece of land was handed out in the third camp on August 20, 2008. Between then and the end of February 2009, at least 35,144 new refugees arrived in Dadaab, none of whom received land or shelter materials.
In October 2008, Human Rights Watch interviewed dozens of these new arrivals who had been in the camps for weeks or months but who were still living in appalling conditions under trees and bushes. They included very young children, the sick (including physically and mentally handicapped children), and the elderly. The most visible, maybe in their hundreds, were camped on land at the back of UNHCR's compound in Dagahaley camp, but the vast majority without land simply disappeared into the sprawling camps. In one case, Human Rights Watch found a young woman and her physically and mentally handicapped seven-year-old daughter who had been living for 13 weeks under a tree with nothing but a single mattress and a piece of cloth hung above their heads to provide a small amount of additional shade.[142]
Other newly arrived refugees, slightly more fortunate, found longer-term camp residents who had opened their already overcrowded shelters and plots to accommodate them-sometimes as many as 20 adults and children,[143] many of whom sleep out in the open at night. Human Rights Watch spoke with a 34-year-old woman with seven children. In hosting two other women and their six children who had arrived three weeks before and in sharing everything she had, her story was typical of many others:
I have one small hut with one room, where the nine younger children sleep. There is not enough room for the rest of us. So the older four children and the three of us, the mothers, we sleep under sky at night. Because they are not registered, they cannot get food and the other refugees don't want them to take water. So I share everything I have with them, including food and water.[144]
Sanitation
Due to the lack of latrines and an inadequate refuse-collection system, the sanitation situation in the camps is of enormous concern. Two cholera outbreaks in Dadaab in 2007 were directly traced back to poor latrine cover and sanitation,[145] and the camps saw a new cholera outbreak in February 2009.[146]
Even before the 2008 influx, Dadaab's refugees faced a dire situation. According to NRC, at the end of 2007, Dadaab's then 171,870 registered refugees lacked 21,000 latrines and an additional latrine would be needed for every additional five refugees.[147] With 61,761 new arrivals in 2008 and 15,271 new arrivals registered in the first two months of 2009, the total latrine gap by the end of February 2009 stood at 36,271.[148]
Oxfam's recent assessment of the limited data available reached a number of conclusions. 6,000 refugees have no access to latrines whatsoever. At least 20 per cent of the camps' residents (50,000 refugees) have access that does not conform to international aid standards, and there is not enough data available to conclude whether or not the remaining 80 percent has adequate access or not. Women and children-half the camps' population-very rarely access latrines because they are not segregated, which is unacceptable to Somali women, and because the overcrowding means children cannot compete with men. Generally, latrines are poorly maintained and dirty and refugees cannot access soap and latrine cleaning materials. In summary, the assessment concluded "minimum standards of access, design and use of toilets for excreta disposal are not being met," and that the situation in the camps was "conducive to a public health emergency."[149] Similarly, in March 2009 the United Nations Country team concluded that "the potential health risks posed by overcrowding and insufficient water and sanitation are dire."[150]
Dadaab's refuse collection system dates from the early 1990s. Instead of clearing an estimated 150 tons of garbage into landfills outside the camps using skips, new tractors (or donkey carts) with winches and pulleys and central collection points, the system still relies on wheelbarrows, shovels, and rakes to collect the garbage locally, which is then piled into (and burnt in) small holes throughout the camp that are then back-filled, creating small mounds of barely concealed garbage.[151] Shelters are built around these mounds, leading to fire risks and serious health risks when the rains come.[152]
Healthcare
Even before the influx, healthcare teams working for GTZ-the only healthcare NGO in Dadaab's camps-were unable to address many of the refugees' chronic health needs and there is a shortage of medication and qualified medical staff in the camps' clinics. According to UNHCR, by mid-2008 "the health situation among the refugees [was] still far below the minimum standards," that on average there was one health facility for every 17,000 refugees, and that "crude mortality, maternal mortality, infant mortality and under-five mortality rates are currently far below WHO standards."[153]
With the new influx, the pressure on the healthcare system is enormous. GTZ say that to work to required standards, they need a significant increase in qualified nurses, midwives, clinical officers and doctors, and that in particular Dagahaley camp's hospital needs to be significantly improved.[154]UNHCR confirmed that funding shortages mean all of Dadaab's health posts and hospitals face drug (including vaccine) and skilled-staff shortages, leading to a lack of adequate treatment and an over-reliance on incentive workers.[155]
Human Rights Watch spoke with many sick refugees recently arrived in the camps who said they had either been unable to access clinics because staff had required them to show a food ration card[156], or-if they had gained access-said they had not been given adequate treatment. As an example, an emaciated clearly severely sick man who had been living under a tree behind UNHCR's compound in Dagahaley for six weeks, said he was constantly vomiting, but that when he finally managed to pay his way into a clinic in Dagahaley, he was not seen by a doctor and was given paracetamol and multi-vitamin tablets.[157]
In 2006 and 2007, Dadaab's camps saw a number of epidemics (cholera, measles, and Rift Valley Fever).[158] With the increased numbers and concentration of refugees, lack of land, lack of water, and the appalling sanitation conditions, the risk of a renewed cholera outbreak is a constant possibility, as shown by the cholera outbreak in February 2009 that was fortunately swiftly contained by emergency health teams.[159]
Funding for Dadaab's Camps
Three UN agencies (UNHCR, UNICEF, WFP), the International Organization for Migration (IOM), the Kenyan Red Cross, and numerous international NGOs assist Dadaab's refugees. To date, UNHCR has not comprehensively set out the budget (and budgetary sources) of Dadaab's aid agencies, which makes it hard to determine the extent to which the Dadaab operation is under-funded. However, all agencies interviewed for this report agreed that Dadaab was clearly massively under-funded, leaving them in no doubt that a significant increase in funding was needed to ensure that the appalling state of Dadaab's camps is improved and that new camps are built to help decongest them and receive new arrivals.[160]
Even before the 36 percent increase in the camps' population in 2008, UNHCR's $15 million annual budget for 2007 and 2008 was far below the estimated $50 million needed to cope with the long-term needs of the camps' 2007 population of 152,000 refugees.[161] UNHCR says that its budget for the past two years has been totally inadequate to deal with refugees' needs, that the new arrivals rate in 2007 and 2008 has put UNHCR and NGOs in Daddab in a "constant emergency mode," and that most of the available funds have been targeted at new arrivals, leaving very few funds to address the needs of refugees arriving before 2007.[162]
By October 2008, UNHCR had drawn up a 2009 budget of $17 million, a 13 percent increase on an already inadequate budget that was supposed to cope with the need for at least one new camp ($20 million), with a 64 percent increase in the camp's population in 2007 and 2008[163] (total cost unknown), and with Dadaab's pre-2007 long-term needs ($50 million).[164]
After Human Rights Watch encouraged UNHCR to present donors with a full breakdown of its financial needs for Dadaab, UNHCR issued a Supplementary Appeal on December 19, 2008, for a little over $70 million, in addition to the $21.4 million it had already asked for under its Global Appeal for 2009.[165] This money is intended to cover the cost of "identified operational gaps and unmet needs" of the 235,000 refugees registered in Dadaab by the end of 2008, the cost of providing for up to 120,000 new refugees in 2009, and the cost of constructing new camps capable of sheltering approximately 100,000 refugees.[166]
Refugees' food needs in Dadaab are covered separately by the World Food Program (WFP). Between October 1, 2007, and September 30, 2009, WFP's Dadaab budget is $92,001,788 (an average of $3,883,408 per month). As of mid February 2009, WFP said that this budget was fully funded until June 30, 2009, and that it would be issuing a further appeal to cover refugees' needs after that time.[167]
VI. Kenya's de facto Encampment Policy for Refugees
Kenya has never officially adopted a policy requiring Somali (or other) refugees to stay in camps. International refugee law and its own refugee legislation requires it to guarantee refugees' freedom of movement throughout Kenya[168] and provides that asylum seekers can apply for refugee status at any of the Department of Refugee Affairs' offices in Kenya, including in Nairobi.[169] However, since the early 1990s, Kenya has-in practice-adopted an encampment policy.[170] The 2006 Refugees Act requires the authorities to formally designate all refugee camps,[171] and although the Act does not state that camps are the only place in Kenya where refugees may live, the authorities and UNHCR use a number of disincentives-including unlawfully restricting their freedom of movement-to limit the number of refugees choosing to live and move outside of camps.[172]
Number of Somali refugees in Nairobi
There are no official statistics for the number of Somali nationals who have left Somalia following the outbreak of war in 1991 and who have chosen to settle in Nairobi.[173] Although Kenya's Department of Refugee Affairs to some extent registers refugees from all nationalities in Nairobi and issues them with them with "Alien's Certificate" cards (see below), there are no official statistics available.[174]
By December 31, 2008, UNHCR had registered 34,249 refugees and 2,266 asylum seekers in Nairobi. Of these, 15,090 were Somalis, 1,910 of whom applied since January 1, 2004.[175] This number is widely believed to be only a small fraction of the total number of Somali nationals-possibly in the tens of thousands and maybe well over 100,000-living in Nairobi.[176] NGO staff working in the Somali border town of Doble report that half of the refugees interviewed in 2008 said they were travelling straight to Nairobi (with the other half saying they were going to Dadaab's camps).[177] In 2008, UNHCR registered almost 65,000 Somali refugees in Dadaab. If these observations are any indication of the true movement patterns, this means that in 2008 alone tens of thousands of Somali refugees arrived in Nairobi, although only 654 Somali asylum seekers applied for refugee status with UNHCR in 2008 (compared to almost 60,000 who applied in the same period in Dadaab's camps).[178]
Restriction of humanitarian assistance
The first disincentive for Somali refugees to live outside Dadaab's camps is the absence of humanitarian assistance. When registered in Dadaab, refugees are given a ration card which states that the holder of the card has no right to receive any form of humanitarian assistance outside the camps.[179] If a refugee applies for refugee status with UNHCR in Nairobi, the first screening test-to establish why the refugee wants to live in Nairobi and not in a camp (see below)-includes among its criteria "economic self-sufficiency," and all refugees are required to confirm they understand that they are not entitled to government or UNHCR assistance if they live outside refugee camps.[180]
Permission to travel from Dadaab to Nairobi
The second disincentive for leaving Dadaab's camps is the Kenyan government's unlawful policy restricting officially sanctioned movement between the camps and other parts of Kenya.
Once registered in Dadaab's camps, the only documentation refugees receive is a UNHCR food ration card and they are not permitted to travel outside of the camps unless they obtain a "movement pass" (known colloquially as a "travel document"), which is co-signed by the DRA and UNHCR's Dadaab sub-office.[181]
Somali nationals stopped by police outside of Dadaab's camps who do not have a movement pass are liable to arrest and a fine.[182] However, given that Somali nationals travelling directly from the border to Nairobi-without passing through the camps-are known to have been arrested, detained, and unlawfully deported to Somalia (see above), refugees travelling from the camps to Nairobi without a movement pass risk far more than just a simple fine.
To obtain a movement pass, refugees in Dadaab must convince the DRA[183] that they have to travel to Nairobi for one or more of the following reasons: urgent health issues that cannot be treated in the camps; further education; death of relative elsewhere in Kenya; tracing family members; embassy visits (for example for resettlement outside Kenya); purchase of stock for camp-based trading; or security threats in the camps.[184] These criteria have been developed on an ad hoc basis over time, are not prescribed by law or regulation, and are not available in written form.[185]
UNHCR says that it would prefer to "redirect its efforts to ensure wider freedom of movement" for Somali refugees "rather than be perceived as condoning encampment." To date these efforts have involved "minimizing discretionary decisions" by the Department of Refugee Affairs in its issuing of movement passes and ongoing discussions with the DRA to agree on "transparent and clear procedures for the issuance of passes and criteria for movement in Kenya."[186]
However, international refugee and human rights law, as well as the Kenyan Constitution, clearly prohibit interference with recongized refugees' freedom of movement unless the government can show that free movement would endanger "defence, public safety or public order."[187] In the absence of such a declaration, which could be challenged in court if believed to be without foundation, Kenya's current movement pass system is unlawful and should be abolished.
Lengthy UNHCR refugee status determination procedures and unclear Department of Refugee Affairs registration practices in Nairobi
The third disincentive for seeking refugee status outside of Dadaab's camps has been UNHCR's lengthy refugee status determination procedures in Nairobi-during which time Somalis have insecure legal status and face police abuses-and unclear refugee status determination procedures carried out in Nairobi by Kenya's Department of Refugee Affairs.
Lengthy UNHCR refugee status determination procedures and procedural delays in Dadaab and Nairobi
Despite the DRA's authority to process asylum applications and to recognize and register refugees, its capacity remains limited and UNHCR continues to conduct refugee status determinations in Nairobi. Although some Somali refugees apply for refugee status with the DRA, many continue to apply with UNHCR. UNHCR recognition leads to a "Mandate Refugee Certificate" (colloquially referred to as a "blue mandate")[188] and to a "Convention Travel Document" which, unlike DRA-based status, allows the recognized refugee to travel outside Kenya.[189]
Since the Kenyan government forced the closure of UNHCR's refugee transit center in Liboi in January 2007, refugees arriving in Dadaab's camps register for assistance with UNHCR. Before 2008, UNHCR would rapidly recognise Somalis in Dadaab under the 1969 OAU Convention. With the influx of refugees in 2008, UNHCR stripped its procedures down further to the bare minimum, and now a person only needs to show they are a Somali national[190] to ensure that UNHCR automatically recognizes them in a matter of minutes as a refugee under the 1969 OAU Convention.[191]
In contrast, until early 2008 UNHCR in Nairobi applied a lengthy two-or if necessary-three stage test to Somali asylum seekers.[192] On average, the test took anywhere between six and nine months[193] and in some cases even up to two years.[194] In early 2008, UNHCR simplified its procedure, but because of a backlog of asylum cases for all nationalities, by January 2009 Somali asylum seekers were still waiting up to nine months to be recognized as refugees, in contrast to their fellow refugees in Dadaab who were recognized in a matter of minutes. In March 2009, UNHCR said that the waiting time stood at four months and that by April 2009 it would be reduced to two months.[195]
Even under UNHCR's simplified procedures introduced in 2008, an asylum seeker must first explain in writing why she wishes to stay in Nairobi.[196] If she does not pass this stage, she is told to go to Dadaab. To succeed applicants must fulfil one or more of the following (unpublished) criteria: they face a security threat in the camps; they have serious health issues; they have educational opportunities in Nairobi; they have an offer of fixed employment in Nairobi; or they are economically self-sufficient.[197] UNHCR told Human Rights Watch that it does not require applicants to produce evidence of economic self-sufficiency and that as long as the applicant understands they will receive no UN or government assistance, they will pass this stage of the process.[198]
Once a Somali refugee has convinced UNHCR that she has a good reason to remain in Nairobi, she is assessed under the 1969 OAU Convention and with the exception of a few cases, all Somali applicants are recognised under this Convention.[199]
During the time it takes UNHCR to recognize them as refugees and issue them with Mandate Refugee Certificates, Somali asylum seekers often fall victim to abuses by the Kenyan police, who view asylum seekers as easy prey. Somali asylum seekers face arbitrary arrest and detention and frequently face demands for bribes.[200]UNHCR has confirmed that "police harassment and extortion of money" is one of asylum seekers' (and even recognised refugees') main protection concerns in Nairobi; that female asylum seekers and refugees claim that Kenyan police sexually harass them and threaten them with rape if they do not have enough money to pay the requested bribes; and that police from Pangani District in Nairobi go to Eastleigh (where most Somali nationals live) during their lunch break to demand bribes.[201]
Somali asylum seekers waiting to be formally recognised as refugees have faced a greater risk of abuse at the hands of Kenyan police due to UNHCR's practice of issuing them only with an "Appointment Slip," rather than with a formal asylum seekers identity card.[202] Kenyan NGOs have described how police seeking bribes routinely disregard and even rip up appointment slips.[203] In March 2009, UNHCR was working towards registering and screening Somali asylum seekers as soon as they apply for asylum at UNHCR's offices and issuing them with Appointment Slips only for the purpose of picking up their Mandate Refugee Certificate.[204]
DRA Alien Certificate Cards issued to Somali refugees
The lack of transparency in the way DRA registers refugees is the final disincentive for Somali refugees to attempt to survive outside of Dadaab's camps.
The DRA is mandated to register and issue all refugees in Kenya with identification cards and travel documents.[205] However, although it has registered some refugees, it has not done so in a transparent way. Human Rights Watch was unable to obtain information from the DRA to clarify its current status determination role. The way in which the DRA has registered non-nationals since 2006 has led to considerable confusion among asylum seekers and those who work with them.[206]
Beginning in 2006, the DRA carried out a major registration exercise for non-Kenyan nationals in Nairobi. The DRA never clearly announced the purpose of the exercise and never released official registration statistics. Neither Kenyan NGOs working with refugees in Nairobi nor UNHCR in Nairobi are clear on the purpose of the exercise and whether it was part of an attempt to begin to put in place a Kenyan refugee status determination procedure.[207] There was initial speculation that it was intended to register foreign nationals, including Somalis, running unlicensed business in Nairobi.[208] However, the exercise resulted in an estimated 50,000 non-Kenyan nationals, including an estimated 20,000 Somalis,[209] receiving "Alien's Certificate" cards, whose purpose was not clear.[210] Because of this lack of clarity and because many of the cards' expiry dates expired even before the cards had been delivered, some of them[211] were replaced by a second identical Alien's Certificate card on which the words "this complies with the Refugees Act" were hand-written, indicating that the purpose was to carry out refugee registration.[212] According to UNHCR, this was the first time the Kenyan government officially recognized the existence of refugees in Nairobi.[213]
In parallel with this one-off registration exercise, the DRA has continued to issue Alien Certificate cards to foreign nationals approaching the DRA to claim refugee status. However, Alien Certificate cards are not provided for under any Kenyan law and NGOs working with refugees in Nairobi are not clear on the extent to which refugees can access these certificates.[214]
VII. Acknowledgments
This report was researched and written by Gerry Simpson, refugee researcher and advocate at Human Rights Watch. The report was edited by Bill Frelick, director of the Refugee Program and Leslie Lefkow, senior researcher and Horn of Africa Team Leader. It was reviewed by Clive Baldwin, senior legal advisor, and Iain Levine, Program director. Additional editorial assistance was provided by Jon Cohen. Grace Choi, Anna Lopriore, and Fitzroy Hepkins provided production and photo assistance.
Human Rights Watch is grateful to all the Somali refugees who agreed to be interviewed for this report.
We would also like to thank all interviewees from UNHCR in Dadaab and Nairobi and from national and international NGOs in Dadaab and Nairobi who all gave generously of their time.
Annex I: Provincial Map of Kenya
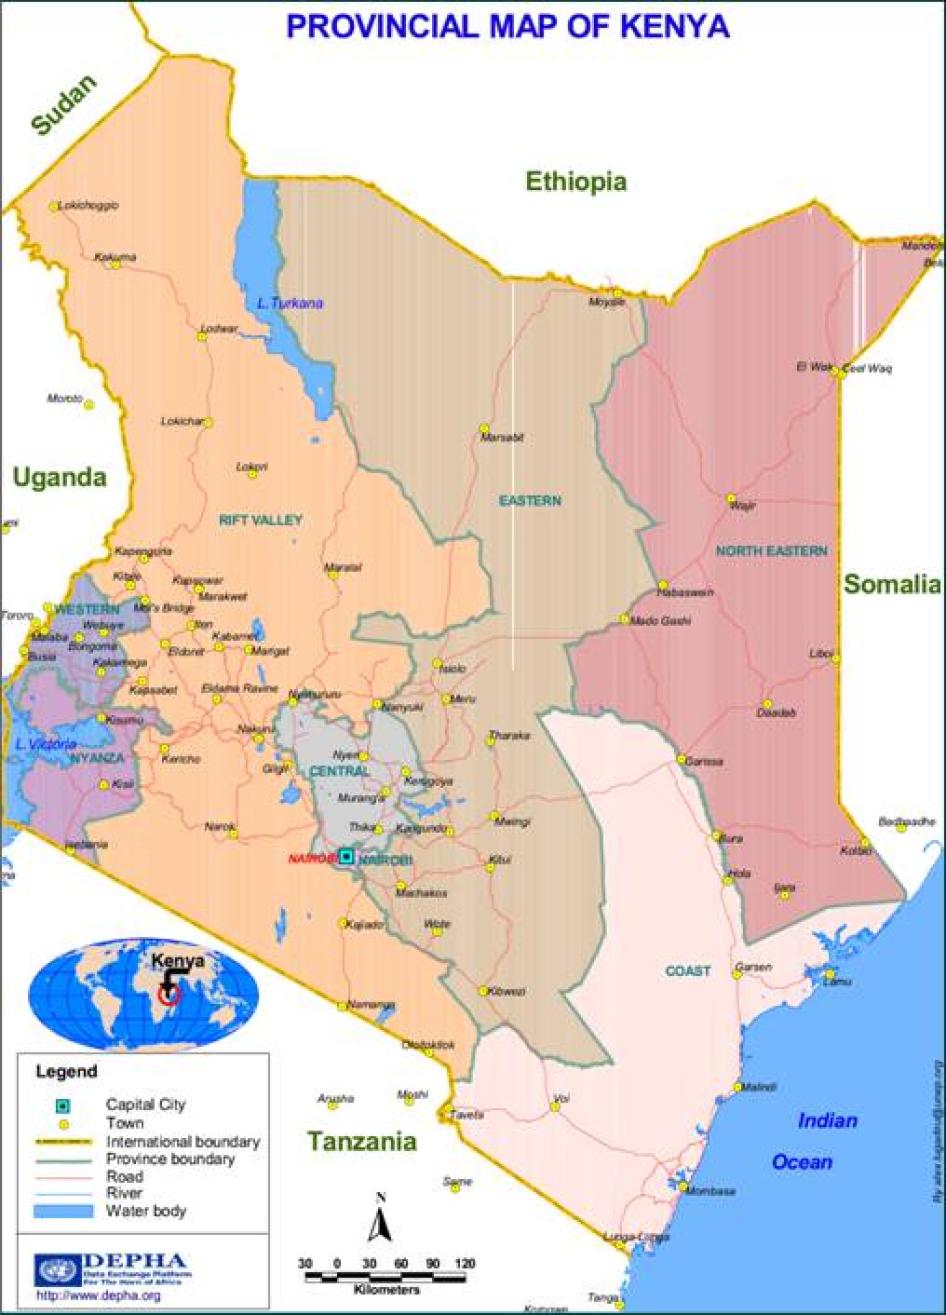
Annex II: UNHCR Overview Map of Dadaab's Camps, December 2008
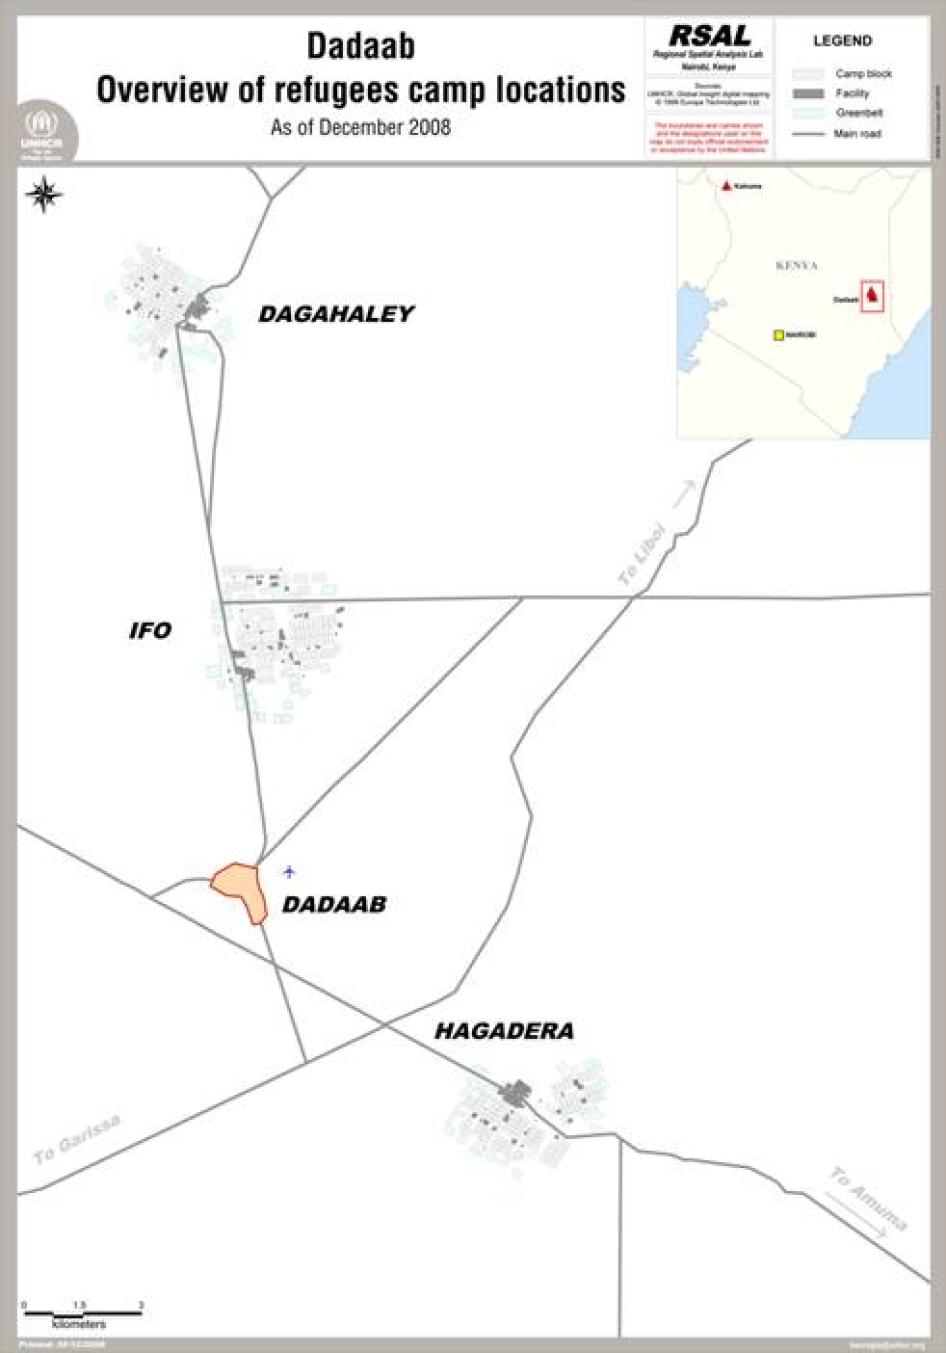
Annex III: HRW Overview of UNHCR Registration Statistics for Dadaab's Camps
1. Table I – Dadaab Population Trends, December 31, 2002 – February 28, 2009
Date |
Total for all three camps |
Change |
December 31, 2002 |
136,445 |
Unknown |
December 31, 2003 |
134,552 |
- 1,893 |
December 31, 2004 |
138,618 |
+ 4,066 |
December 31, 2005 |
127,387 |
- 11,231 |
December 31, 2006 |
152,938 |
+ 25,551 |
December 31, 2007 |
171,870 |
+ 18,932 |
December 31, 2008 |
235,455 |
+ 63,585 (61,761 new arrivals plus other growth[215]) |
January 31, 2009 |
247,182 |
+ 11,727 (8,235 new arrivals plus other growth) |
February 28, 2009 |
255,750 (244,580 Somali nationals) |
+8,568 (5,774 new arrivals plus other growth) |
2. Table II – Registered new arrivals and average waiting time to be registered/receive food ration card, January 1, 2008 – February 28, 2009
Month |
Total new arrivals (of whom Somalis) |
Registration Wait Time (days) |
January 2008 |
6,235 (5,875) |
14.5 |
February 2008 |
3,693 (3,441) |
25.9 |
March 2008 |
3,970 (3,826) |
25.5 |
April 2008 |
5,065 (4,929) |
30 |
May 2008 |
4,498 (4,385) |
33.8 |
June 2008 |
4,195 (3,935) |
51.2 |
July 2008 |
7,412 (6,868) |
25 |
August 2008 |
8,342 (7,703) |
28.8 |
September 2008 |
6,179 (5,716) |
35.9 |
October 2008 |
4,819( 4,545) |
53.5 |
November 2008 |
3,718 (3,567) |
60 |
December 2008 |
3,635 (3,423) |
60 |
January 2009 |
8,235 (7,583) |
21 |
February 2009 |
5,774 (5,054) |
10 |
[1]The three camps surrounding Dadaab town are Dagahaley (population 77,036), Hagadera (91,982), and Ifo (86,732)–a total of 255,750 (February 28, 2009). UNHCR statistics on file with Human Rights Watch. The camps are located within an 18 kilometer radius of Dadaab town, cover 50 square kilometers, and are separated from each other by significant distances. See the overview map of the camps in Annex II.
[2] "Kenyans close border with Somalia," BBC News, January 3, 2007, http://news.bbc.co.uk/2/hi/africa/6227083.stm (accessed January 14, 2009). Kenya has designated only two places on its border with Somalia–Liboi and Mandera–as official border crossings. Department of Immigration, Kenya, http://www.immigration.go.ke/index.php?id=27 (accessed February 24, 2009).
[3]Noor Ali, "Kenya on alert as Somalia fighting nears border," Reuters, January 3, 2007, http://www.alertnet.org/thenews/newsdesk/L0383709.htm (accessed February 25, 2009), quoting US State Department spokesman Sean McCormack: "We would be concerned that no leaders who were members of the Islamic Courts which have ties to terrorist organizations including al Qaeda are allowed to flee and leave Somalia."
[4] "Kenyans close border with Somalia," BBC News.
[5] Amnesty International, "Denied refuge: The effect of the closure of the Kenya/Somali border on thousands of Somali asylum-seekers and refugees," May 2, 2007, http://www.amnesty.org/en/library/info/AFR32/002/2007 (accessed January 14, 2009), pp. 3-4.
[6] Refugee Consortium Kenya (RCK), "Returning Somali Refugees: Kenya is Violating International Law," January 10, 2007, http://72.3.131.88/uploadedFiles/Investigate/070103per cent20RCKper cent20Pressper cent20Release.pdf (accessed January 13, 2008). Amnesty International, "Denied Refuge." Refugees International, "Kenya denying asylum to Somali refugees," January 4, 2007, http://www.refugeesinternational.org/node/1545 (accessed January 14, 2009).
[7] In 2007 and 2008, UNHCR registered 18,932 and 61,761 new refugees respectively in Dadaab's camps, of whom 95 percent were Somalis. See Annex III. In 2008, UNHCR registered 654 Somali asylum seekers in Nairobi. UNHCR statistics, on file with Human Rights Watch. As noted below in chapter VI it is possible that in 2008 alone, tens of thousands of Somalis made their way directly from the border to Nairobi. However, because Somalis are not registered when crossing the border and because Kenya's Department of Refugee Affairs does not publish statistics relating to its registration of non-Kenyan nationals in Nairobi, there is no way of knowing how many Somalis traveled directly to Nairobi or other parts of Kenya such as Mombassa.
[8] Guled Mohamed, "Somali refugees pour into Kayna," Reuters, June 18, 2008, http://uk.reuters.com/article/worldNews/idUKL187685620080618 (accessed January 18, 2009).
[9] See map in Annex I. Human Rights Watch interviews with NGO workers, UN agency staff and independent journalists in Nairobi, Dadaab, and Liboi, October 2008. Refugees crossing the border on the Doble-Liboi road take three different routes from Mogadishu to reach Liboi. The route chosen depends on the state of the (often flooded) coastal roads, the number of checkpoints on any given road, and the person's clan affiliation, which can make some roads more dangerous than others. Refugees from Kismayo also enter Kenya on the Doble-Liboi road. Some Somalis in 2007 and 2008 entered Kenya further north close to the Kenyan town of Khorot Harar and between or through the northern towns of El Wak and Mandera. Many originate from areas just across the border in Somalia and are a mixture of refugees and people fleeing drought. Most do not venture further south (to Dadaab and Nairobi) because they want to regularly check on their property in Somalia and increasingly because new clan alliances arising out of the recent conflict mean they would feel at risk of attack traveling between these northern towns and Dadaab's camps further south. Those entering through Mandera include Somalis coming directly from Mogadishu who can afford the expensive direct Mogadishu-Mandera trip. Somali refugees also enter Kenya through the border crossing of Amoma south of Liboi. Human Rights Watch interviews with various people living and working in the border areas, Nairobi, Dadaab and Liboi, October 6 – 24, 2008
[10]See Annex I.
[11]Health screening was carried out in Liboi to identify refugees needing vaccinations once in the camps. Human Rights Watch interview with "Gesellschaft für Technische Zusammenarbeit" (GTZ), Dadaab, October 17, 2008.
[12]Human Rights Watch interview with UNHCR, Dadaab, October 13, 2008, and Lutheran World Foundation (LWF), Dadaab, October 14, 2008. GTZ confirmed that the transit center's closure has made it more difficult to detect health (including vaccination) needs among new refugees, because once they arrive in the camps, refugees disappear and rarely proactively seek medical advice. Human Rights Watch interview with GTZ, Dadaab, October 17, 2008.
[13] After UNHCR reached an agreement with the then Acting Provincial Commissioner for North Eastern Province and with the Department of Refugee Affairs, the center briefly re-opened on March 12, 2008, but closed again on May 6, 2008. Human Rights Watch email exchange with UNHCR, Geneva, February 20, 2009. The center closed after a new Provincial Commissioner was appointed. Confidential Human Rights Watch interview, Nairobi, October 2008.
[14] Human Rights Watch interview with Kenyan official, October 2008.
[15]Human Rights Watch interview with UNHCR, Nairobi, October 7, 2008.
[16]Human Rights Watch interview with UNHCR, Nairobi, October 7, 2008.
[17]Dadaab's three camps are located far from one another. See map in Annex II.
[18] Human Rights Watch interview with Department of Refugee Affairs, Nairobi, October 6, 2008, and with UNHCR, Nairobi, 24 October, 2008.
[19] "U.S. Ambassador Ranneberger Visits Dadaab Refugee Camp," US Department of State, Virtual Presence Post, http://somalia.usvpp.gov/pr_11192008_1.html (accessed January 12, 2009).
[20] "No Contracting State shall expel or return ("refouler") a refugee in any manner whatsoever to the frontiers of territories where his life or freedom would be threatened on account of his race, religion, nationality, membership of a particular social group or political opinion." Article 33.1, 1951 UN Convention relating to the Status of Refugees (1951 Refugee Convention), 189 U.N.T.S. 150, entered into force April 22, 1954, and its 1967 Protocol Relating to the Status of Refugees, 606 U.N.T.S. 267, entered into force October 4, 1967, http://www.unhchr.ch/html/menu3/b/o_c_ref.htm, acceded to by Kenya on May 16, 1996 (accessed January 25, 2009).
[21] "No person shall be subjected by a Member State to measures such as rejection at the frontier, return or expulsion, which would compel him to return to or remain in a territory where his life, physical integrity or liberty would be threatened" for reasons that include "external aggression, occupation, foreign domination, or events seriously disturbing public order." Article 2(3), 1969 OAU Convention Governing the Specific Aspects of Refugee Problems in Africa (OAU Refugee Convention), 1001 U.N.T.S. 45, entered into force June 20, 1974, http://www.africa-union.org/Official_documents/Treaties, ratified by Kenya on June 23, 1992 (accessed March 13, 2008).
[22] Section 4, Kenyan Immigration Act, 1967, Law 25 of 1967, as amended by Law No. 6 of 1972, http://www.immigration.go.ke/act.htm (accessed January 17, 2009).
[23] "Kenya-Somalia: Thousands flee amid fears of fighting along border," IRIN, http://www.reliefweb.int/rw/rwb.nsf/db900sid/PANA-7LSLDF?OpenDocument&rc=1&cc=ken (accessed February 24, 2009).
[24] Cyrus Ombati, "More soldiers deployed along Somalia border," The Standard,http://www.eastandard.net/InsidePage.php?id=1143999573&cid=4 (accessed February 24, 2009).
[25] "No person shall be refused entry into Kenya … if, as a result of such refusal … such person is compelled to return or remain in a country where … the person's life, physical integrity or liberty would be threatened on account of … events seriously disturbing public order." Section 18(b), Refugees Act, 2006, Kenya Gazette Supplement No. 97 (Acts No. 13) (2006 Refugees Act), www.refugeelawreader.org/1036/The_Refugees_Act_2006.pdf (accessed January 31, 2009).
[26] Section 18(b), Refugees Act, 2006, Act No.13 of 2006, http://www.kenyalaw.org/kenyalaw/klr_app/frames.php (accessed January 13, 2009), applying the OAU Convention definition of a refugee: "no person shall be refused entry into Kenya … or returned to any … country … if as a result … such person is compelled to return to … a country where (b) the person's life, physical integrity or liberty would be threatened on account of external aggression, occupation, foreign domination or events seriously disturbing pubic order….".
[27] Section 3(2), 2006 Refugees Act.
[28] Unless the refugee can be excluded on the basis of exclusion criteria in section 4 of Kenya's Refugee Act, 2006. See chapter VI for UNHCR and DRA procedures for screening refugees in Nairobi. Before the 2008 influx, UNHCR carried out individualised refugee status screening under the 1969 OAU Convention but was unable to maintain this screening given the rate of new arrivals. However, since the influx, it has carried out simple registration based on nationality (cross-referencing biometric data against Kenya's national database to avoid registration of Kenyan nationals seeking assistance in the camps). Human Rights Watch email exchange with UNHCR, February 2009.
[29]Section 11(5), 2006 Refugees Act.
[30]Section 11(1), 2006 Refugees Act.
[31]Section 11(1), 2006 Refugees Act.
[32]Human Rights Watch email exchange with RCK, January 13, 2009. Human Rights Watch interview with legal aid NGO, Nairobi, October 22, 2008.
[33]Human Rights Watch email exchange with UNHCR, Geneva, February 20, 2009.
[34]Human Rights Watch interview, Dadaab, June 29, 2008.
[35]Their experiences in these police stations are referred to below.
[36]Human Rights Watch interview in Eastleigh, Nairobi, October 23, 2008.
[37]Human Rights Watch email exchange with UNHCR, Geneva, February 20, 2009.
[38]Human Rights Watch interview, Nairobi, October 19, 2008.
[39] Confidential Human Rights Watch interview, October 15, 2008.
[40]Human Rights Watch interview with numerous refugees in Dadaab's camps, October 12 – 18, 2008.
[41]UNHCR, "UNHCR calls on Kenya to stop forcible return of Somali asylum seekers," January 27, 2009, http://www.reliefweb.int/rw/rwb.nsf/db900sid/JBRN 7NPGP5?OpenDocument&rc=1&cc=ken (accessed January 27, 2009).
[42] Human Rights Watch email exchange with UNHCR, February 20, 2009. "100 Somalis accused of crossing border illegally," Daily Nation, January 27, 2009. On file with Human Rights Watch.
[43] Human Rights Watch email exchange with RCK, January 13, 2009. See also, "Closure of the Somali Border and its Implications on Refugee Protection," Refugee Consortium Kenya, http://www.rckkenya.org/news12.html (accessed January 13, 2009).
[44] See below, Human Rights Watch interviews with Somali refugees in Dadaab's camps, October 12 – 18, 2008, and in Nairobi with NGOs, October 21 and 22, 2008.
[45]Transparency International, "The Kenya Bribery Index 2008,"http://www.tikenya.org/documents/KenyaBriberyIndex08.pdf (accessed January 18, 2009), p. 16.
[46] International Covenant on Civil and Political Rights (ICCPR), adopted December 16, 1966, G.A. Res. 2200A (XXI), 21 U.N. GAOR Supp. (No. 16) at 52, U.N. Doc. A/6316 (1966), 999 U.N.T.S. 171, entered into force March 23, 1976, http://www2.ohchr.org/english/law/ccpr.htm (accessed March 19, 2008), acceded to by Kenya on May 1, 1972.
[47] Section 75, Constitution of Kenya.
[48]Section 72, Constitution of Kenya.
[49]Section 74, Constitution of Kenya.
[50]Human Rights Watch email exchange with UNHCR Geneva, February 5, 2009.
[51] "People smugglers" should be distinguished from "human traffickers." A person smuggler facilitates transportation, including cross-border movement, for a fee that is voluntarily paid by the person being smuggled: "smuggling of migrants" is defined as "the procurement, in order to obtain, directly or indirectly, a financial or other material benefit, of the illegal entry of a person into a State Party of which the person is not a national or a permanent resident." Article 3(a), Protocol against the Smuggling of Migrants by Land, Sea and Air, supplementing the United Nations Convention against Transnational Organized Crime, http://www.unodc.org/documents/treaties/UNTOC/Publications/TOC%20Convention/TOCebook-e.pdf (accessed February 24, 2009).A human trafficker is a person engaging in unlawful activity involving "the recruitment, transportation, transfer, harboring or receipt of persons, by means of the threat or use of force or other forms of coercion, of abduction, of fraud, of deception, of the abuse of power or of a position of vulnerability or of the giving or receiving of payments or benefits to achieve the consent of a person having control over another person, for the purpose of exploitation." Article 3(a), Protocol to Prevent, Suppress and Punish Trafficking in Persons, especially Women and Children, supplementing the United Nations Convention against Transnational Organized Crime, http://www.unodc.org/documents/treaties/UNTOC/Publications/TOC%20Convention/TOCebook-e.pdf(accessed February 24, 2009).
[52]Human Rights Watch interviews with numerous refugees, Dadaab's camps, October 12 – 18 2008.
[53]Human Rights Watch interviews with numerous refugees, Dadaab's camps, October 12 – 18 2008.
[54] Human Rights Watch interviews, Dagahaley camp, October 12 – 18, 2008.
[55] Human Rights Watch interview, Ifo camp, October 13, 2008.
[56]Human Rights Watch interview, Dagahaley camp, October 12, 2008.
[57]Human Rights Watch interview, Dagahaley camp, October 12, 2008.
[58]Human Rights Watch email exchange with UNHCR, Geneva, February 20, 2009.
[59]Each camp has two police stations. Human Rights Watch email exchange with UNHCR, Geneva, February 20, 2009.
[60]An administrative police post located on the edge of Hagadera camp.
[61]Human Rights Watch interview, Hagadera, October 16, 2008.
[62]Human Rights Watch interview, Hagadera camp, October 15, 2008.
[63] Human Rights Watch interview, Eastleigh, Nairobi, October 20, 2008.
[64]Human Rights Watch email exchange with UNHCR, Geneva, February 20, 2009.
[65]Section 25(f), 2006 Refugees Act. Section 25(f) refers to powers the Minster of State for Immigration and Registration of Persons has under section 15(2) of the act to specify areas as "designated areas." However, these powers are set out in section 16(2).
[66]Human Rights Watch email exchange with UNHCR, Geneva, February 20, 2009.
[67]Confidential Human Rights Watch interview, Dadaab, October 15, 2008.
[68] Human Rights Watch interview in Eastleigh, October 21, 2008.
[69]Human Rights Watch interview, Eastleigh, October 21, 2008.
[70] Human Rights Watch interview, Eastleigh, October 20, 2008.
[71]See textbox opposite page 1.
[72]Human Rights Watch interview with humanitarian worker, Dadaab, October 2008.
[73]On November 13, 2008, Human Rights Watch issued a press release on the unfolding emergency in the camps. Human Rights Watch, "Kenya: Protect Somali Refugees," November 13, 2008, http://www.hrw.org/en/news/2008/11/13/kenya-protect-somali-refugees.
[74]Information on file with Human Rights Watch.
[75] Human Rights Watch email exchange with NRC, January 16, 2009.
[76] Human Rights Watch interview with NGO staff, Dadaab, October 17, 2008.
[77]Human Rights Watch interview with UNHCR, October 11, 2008.
[78]As noted above, the three camps surrounding Dadaab town are Dagahaley, Hagadera, and Ifo, housing a total of 255,750 refugees (February 28, 2009).
[79]In 2008, the camps' population increased by 63,585 (from 171,870 to 235,455), of which 61,761 were new arrivals. See Annex III. In 2006 and 2007, there were 25,551 and 18,932 new arrivals, respectively. In January 2009, UNHCR registered 8,235 refugees, the second highest monthly figure since January 2008. UNHCR statistics, on file with Human Rights Watch.
[80] The average monthly arrival rate in 2008 was just over 5,000 refugees. 95 percent of the camps' refugees are Somalis. UNHCR statistics, on file with Human Rights Watch. In March 2009, UNHCR estimated that up to 120,000 new Somali refugees might enter Kenya in 2009. OCHA, "Kenya, Revision of 2009 Emergency Humanitarian Response Plan," March 16, 2009, http://ochadms.unog.ch/quickplace/cap/main.nsf/h_Index/Revision_2009_Kenya_EHRP/$FILE/Revision_2009_Kenya_EHRP_VOL1_SCREEN.pdf?OpenElement (accessed March 17, 2009).
[81]In the original agreement between UNHCR and Dadaab's host community, there were no fixed boundaries for the camps and the camps expanded based on ad hoc oral agreements. Human Rights Watch interview, UNHCR Dadaab, October 19, 2008.
[82]Human Rights Watch interview with international NGO staffer, Dadaab, October 18, 2008.
[83] Human Rights Watch interview with international NGO, Nairobi, October 2008, and with Farah Maalim MP, Dadaab, October 18, 2008.
[84]Human Rights Watch interview, LWF, Nairobi, October 9, 2008, and with UNHCR, Nairobi, October 24, 2008.
[85] Based on statistics for August 2008, around 2,784 refugees arrived in the last 10 days of the month. 32,360 arrived between September 1, 2008, and February 28, 2009. UNHCR statistics on file with Human Rights Watch. The statistics are based on refugees officially registered by UNHCR, but exclude the many–possibly thousands–of refugees who were unable to get registered between May and December 2008 due to UNHCR's registration crisis in those months.
[86] In early February 2009, UNHCR reported that it had recorded an increase in cases of sexual violence or attempted sexual violence (up from 103 cases in 2007 to 218 cases in 2008). "Kenya: Camp resources stretched by influx of Somali refugees," IRIN, http://www.reliefweb.int/rw/rwb.nsf/db900sid/JBRN-7NZJNU?OpenDocument&rc=1&cc=ken (accessed February 24, 2009).
[87] The camp would in fact be two separate entities, each sheltering 40,000 refugees. Human Rights Watch interview with UNHCR, Nairobi, October 24, 2008. Under section 16(2)(b) of the 2006 Refugees Act, the Minister responsible for Refugee Affairs can only designate places to be refugee camps once he has consulted with the host community. In addition, under the Trust Land Act, 1939, Cap. 288, Laws of Kenya, local districts authorities hold land (supposedly in trust for the local population) which means the local authority is also involved in negotiations with UNHCR. The procedures followed by the local authority in Fafi District–where the new land committed to in February 2009 is located and where additional further land is most likely to be located–are complex and involve numerous local actors, including the Provincial Administration, the County Council (Chairman, Counselors, Clerk), the District Development Committee, the District Officer's Office, and elders representing the local community. Human Rights Watch interview with Adan Sugow, MP, Nairobi, October 23, 2008.
[88]Human Rights Watch interview with UNHCR, Dadaab, October 11, 2008. As an example of where UNHCR and NGOs have already taken steps to employ more local Kenyans in the Dadaab operation, 75 percent of the security staff employed by the private Kenyan security firm "Armed Group Kenya"-which provides security for the UN and NGOs in the camps and in their compound in Dadaab town–are from the local community. Human Rights Watch interview with UNHCR, Dadaab, October 11, 2008. CARE carries out small projects supporting education and water and sanitation in Dadaab's host community, for example by repairing boreholes. Other NGOs in Dadaab carry out small ad hoc initiatives with the host community. Human Rights Watch interview with two international NGO staffers, Dadaab, October 14, 2008, and October 17, 2008.
[89]See map in Annex I.
[90]This request arose out of frustrations among local residents living near Hagadera camp, in Fafi constituency. They say that UNHCR has historically neglected their development and employment needs because UNHCR's sub-office in Dadaab, which manages all three camps, is in Lagdera constituency. Fafi constituents say that Lagdera's constituents and their MP unduly influence UNHCR's Dadaab office to neglect Hagadera camp (in Fafi constituency) and to focus on Ifo and Dagahaley camps (in Lagdera constituency). On the other hand, UNHCR says that for organisational reasons it cannot create a new sub-office and that the new office in Alin Jugor would simply be a field office-to manage only the new camp-and, therefore, subordinate to the sub-office in Dadaab town. Human Rights Watch interview with Adan Sugow, MP, Nairobi, October 23, 2008, and with UNHCR, Nairobi, October 24, 2008.
[91]UNHCR, "Kenya to allocate land to establish a new refugee camp," February 6, 2009, http://www.unhcr.org/news/NEWS/498c201416.html (accessed February 9, 2009).
[92]Human Rights Watch email exchange with UNHCR, February 25, 2009.
[93]Human Rights Watch email exchange with Adan Sugow, MP, February 26, 2009.
[94]Human Rights Watch telephone interview with Adan Sugow, MP, February 23, 2009.
[95]OCHA, "Kenya Humanitarian Update," Volume 44, 17 February – 11 March 2009, http://ochaonline.un.org/Default.aspx?alias=ochaonline.un.org/kenya (accessed March 18, 2009).
[96] This projection is based on a conservative arrivals rate of 5,000 refugees per month in the first half of 2009, to be added to the almost 250,000 registered at the end of January 2009. The last time refugees left Dadaab's camps in any significant number, was in 2005 (11, 231) – see Annex III.
[97]This is underscored by the fact that in late 2008 the host community surrounding Hagadera camp told UNHCR that as part of the transfer to a possible new fourth camp they would require 30,000 refugees to be transferred from Hagadera camp so that the camp contains no more than 60,000 refugees. Human Rights Watch confidential email exchange, January 2009. Many agencies told Human Rights Watch off the record that everyone working in Dadaab knew that what was needed was two more camps with a total capacity of 150,000. Human Rights Watch interviews with INGOs working in Dadaab, October 2008.
[98]Human Rights Watch telephone interview with Adan Sugow, MP, February 23, 2009.
[99] UNDP, "Human Development Report 2007/2008," http://hdr.undp.org/en/media/hdr_20072008_en_complete.pdf (accessed February 9, 2009).
[100] Human Rights Watch confidential email exchange, January 16, 2009.
[101] Human Rights Watch confidential email exchange, January 24, 2009.
[102] Human Rights Watch confidential email exchange, January 16, 2009.
[103]OCHA, "Kenya, Revision of 2009 Emergency Humanitarian Response Plan."
[104]Under section 7(2)(m) of the 2006 Refugees Act, the Head of the Department for Refugee Affairs-the Commissioner for Refugee Affairs-is obliged to "initiate, in collaboration with the development partners, projects that promote peaceful and harmonious co-existence between the host communities and refugees" (emphasis added).
[105] Confidential Human Rights Watch email exchange, January 3, 2009.
[106] Letter on file with Human Rights Watch.
[107] Human Rights Watch email exchange with international staff in Nairobi, January 27, 2009.
[108]The itinerary is as follows. Day 1: Dadaab to Thika (440 kilometers); Day 2: Thika to Kitale via Nairobi (679 kilometers); Day 3: Kital to Kakuma (679 kilometers). Human Rights Watch email exchange with Kenyan journalist who covered the 2007 and 2008 transfers, January 13, 2009.
[109] OCHA, "Kenya Humanitarian Update."
[110]In December 2008, UNHCR issued a Supplementary Appeal for Dadaab, in which UNHCR budgeted for a possible 120,000 new arrivals from Somalia in 2009. UNHCR, "UNHCR Emergency Assistance Programme for Somali Refugees in Dadaab, Kenya," December 19, 2008, http://www.unhcr.org/partners/PARTNERS/4951ef9d2.pdf (accessed January 25, 2009).
[111] Human Rights Watch interviews with dozens of refugees in all three of Dadaab's camps, October 11 – 18, 2008.
[112] Human Rights Watch interviews with dozens of refugees in all three of Dadaab's camps, October 11 – 18, 2008.
[113]Until Ifo and Hagadera camps were declared full, all new arrivals there received non-food items (NFIs) such as cooking items and blankets. When those camps were declared full and registration only took place in Dagahaley camp, all new arrivals in Dagahaley received NFIs. When Dagahaley was declared full, all NFI distribution was stopped and has not resumed since then. Human Rights watch interviews with UNHCR and LWF, Dadaab, October 14 and 17, 2008.
[114] Human Rights Watch interview with UNHCR, Dadaab, October 18, 2008.
[115] Health centers, clinics, and hospitals in Dadaab's camps are supposed to allow all persons free access to healthcare. However, in October 2008, dozens of refugees who were still waiting for UNHCR registration (and, therefore, did not have a food ration card) told Human Rights Watch that they had been turned away by healthcare staff because they did not have a ration card. UNHCR said that they are aware of this problem, but were not able to say what they had done to address the issue. Human Rights Watch interview UNHCR, Dadaab, October 19, 2008.
[116] Human Rights Watch interview in Dagahaely camp, October 11, 2008.
[117] Human Rights Watch interview with 19 heads of household in Hagadera camp, October 14, 2008.
[118]The following is based on dozens of Human Rights Watch interview with refugees in all three camps, October 2008.
[119] Human Rights Watch interview in Dagahaley camp, October 12, 2008.
[120]Human Rights Watch interview with UNHCR, Dadaab, October 18, 2008.
[121] Confidential Human Rights Watch email exchange, January 5, 2009.
[122] Human Rights Watch email exchanges, UNHCR, January 5 and February, 2009.
[123]Between May and December 2008, 15 UNHCR clerks registered refugees in Dagahaley camp in a two-stage procedure. Stage 1 involved a simple headcount of heads of household who were given a number marked on a wrist band and were told to check on UNHCR notice boards for their appointment date for Stage 2 registration. While waiting for Stage 2, they and their families were not entitled to food. In Stage 2 UNHCR recorded every family member's biometric-data (fingerprints and photos) to help prevent fraud. The head of household received a food ration card covering the food needs of all of his or her dependents. Human Rights Watch interview with UNHCR, Dadaab, October 17, 2008.
[124] Human Rights Watch email exchanges, UNHCR, January 5 and February, 2009.
[125]Human Rights Watch does not have the mandate or expertise to carry out technical humanitarian assessments and the following is based on information received from UNHCR and from NGOs working in Dadaab's camps.
[126]Humanitarian worker in Dadaab camp, October 2008.
[127]Information on file with Human Rights Watch.
[128] UNICEF, "Deputy Executive Director Hilde F. Johnson asks donors to 'step up to the plate' with support," December 4, 2008, http://www.unicef.org/infobycountry/kenya_46763.html (accessed February 9, 2009).
[129]OCHA, "Kenya, Revision of 2009 Emergency Humanitarian Response Plan."
[130]Human Rights Watch interview with WFP, Dadaab, October 14, 2008. The SPHERE Standards are minimum standards agreed to by humanitarian agencies that they seek to achieve in all humanitarian interventions. See http://www.sphereproject.org.
[131]OCHA, "Kenya, Revision of 2009 Emergency Humanitarian Response Plan."
[132]Dadaab's camps have 105 kilometers of piping, 60 percent of which is highly corrosive plastic which leads to a high degree of water loss through leakage. Human Rights Watch interview with CARE, Dadaab, October 19, 2008.
[133] In interviews with Human Rights Watch in Dadaab between October 13 and 18, 2008, UNHCR and NGOs confirmed that the absolute minimum benchmark for Dadaab, bearing in mind the harsh and dry environment, was 20 liters. UNHCR's general benchmark is 15 – 20 liters per day. UNHCR, "Handbook for Emergencies," p. 217, http://www.unhcr.org/publ/PUBL/471db4c92.html (accessed January 14, 2008).
[134] Human Rights Watch interview with CARE, Dadaab, October 19, 2008.
[135] This conclusion is based on dozens of Human Rights Watch interviews with refugees in Dadaab's camps in October 2008 who had arrived in the camps after August 2008. They told Human Rights Watch that because they had not been registered and because they did not have land of their own and had to squat on other refugees' land, other refugees prevented them from accessing the water points.
[136]Oxfam, "Addressing the Humanitarian Crisis on the Kenya/Somalia Border".
[137] Human Rights Watch interview with CARE, Dadaab, October 19, 2008.
[138]A separate concern is the level of the water table in Dadaab's surroundings which has dropped dramatically in the past few years. Already under pressure, increased pumping to cope with Dadaab's new arrivals will potentially lead to a crisis for all – refugees and Kenyans – living in the camps' vicinity. Human Rights Watch interview with CARE, Dadaab, October 19, 2008.
[139]Generators used to pump waters from boreholes into water tanks date from the 1990s and frequently breakdown. Human Rights Watch interview with CARE, Dadaab, October 19, 2008.
[140]OCHA, "Kenya, Revision of 2009 Emergency Humanitarian Response Plan."
[141]HRW interview with NRC, Nairobi, October 7, 2008. UNHCR and NGOs formally consider there to be an average of five people per family in Dadaab. In 2008, the official average number of people registered under the head of household was four. Human Rights Watch interview, UNHCR, Dadaab, October 19, 2008.
[142] Human Rights Watch conversation in Hagadera camp, October 14, 2008.
[143] Human Rights Watch spoke with a married man with three children who had taken in four families totaling 20 adults and children. Human Rights Watch interview in Hagadera camp, October 14, 2008.
[144] Human Rights Watch interview in Ifo camp, October 13, 2008.
[145] Human Rights Watch interview with GTZ, Dadaab, October 17, 2008.
[146]"Doctors contain cholera outbreak in Kenya's Dadaab refugee camp," February 13, 2009, http://www.reliefweb.int/rw/rwb.nsf/db900SID/JBRN-7P8EYG?OpenDocument&rc=1&cc=ken (accessed February 13, 2009).
[147]NRC and UNHCR base this standard on the fact that the average family size in Dadaab is five people. Human Rights Watch email exchange with NRC, January 16, 2009. The SPHERE standards provide that a maximum of 20 people should use one latrine. SPHERE Standards, Chapter 2: Minimum Standards in Water Supply, Sanitation and Hygiene Promotion; Section 3, Excreta Disposal, http://www.sphereproject.org/handbook/html/4_ch2.htm (accessed January 13, 2008).
[148] According to UNHCR, the gap in March 2009 stood at around 30,000. OCHA, "Kenya, Revision of 2009 Emergency Humanitarian Response Plan."
[149]Oxfam, "Addressing the Humanitarian Crisis on the Kenya/Somalia Border."
[150]OCHA, "Kenya Humanitarian Update."
[151] Human Rights Watch interview with CARE, Dadaab, October 19, 2008.
[152] Human Rights Watch interview with CARE, Dadaab, October 19, 2008.
[153]OCHA, "Kenya, Revision of 2009 Emergency Humanitarian Response Plan."
[154] Human Rights Watch interview with GTZ, Dadaab, October 13, 2008.
[155]Human Rights Watch interview with UNHCR, Dadaab, October 16, 2008.
[156] Human Rights Watch interviews in all three camps, October 11 – 18, 2008.
[157]Human Rights Watch interview in Dagahaley camp, October 12, 2008.
[158]2008 saw one outbreak of whooping cough. Human Rights Watch interview with UNHCR, Dadaab, October 16, 2008.
[159]"Doctors contain cholera outbreak in Kenya's Dadaab refugee camp."
[160]Human Rights watch interviews with UNHCR and internal NGOs in Dadaab and Nairobi, October 12 – 24, 2008.
[161] Human Rights Watch interview with UNHCR, Dadaab, October 11, 2008.
[162] Human Rights Watch interview with UNHCR, Dadaab, October 11, 2008.
[163] Between January 1, 2007 and December 31, 2008, Dadaab's population increased from 152,938 to 235, 455.
[164]Human Rights Watch interview with UNHCR, Dadaab, October 11, 2008.
[165] UNHCR, "Global Appeal 2008-2009," http://www.unhcr.org/ga08/launch.html (accessed February 9, 2009).
[166] UNHCR, Emergency Assistance Programme for Somali Refugees in Dadaab.
[167]Human Rights Watch telephone interview and email exchange with WFP, Nairobi, February 17, 2009.
[168]See below, footnote 187.
[169]Section 11(1), 2006 Refugees Act.
[170] Human Rights Watch, Hidden in Plain View: Refugees Living without protection in Nairobi and Kampala, November 2002, http://www.hrw.org/legacy/reports/2002/kenyugan/ (accessed January 25, 2009).
[171] Under section 16(2)(b) of the 2006 Refugees Act "the Minister [responsible for Refugee Affairs] may designate places … to be … refugee camps."
[172] Some of these disincentives apply to all refugees in Kenya, but the following section refers only to Somali refugees.
[173]Somalis also live in other major Kenyan towns such as Garissa near Dadaab or Mombasa on the coast. In September 2008, the Department of Refugee Affairs registered around 4,000 foreign nationals in Mombasa and Malindi on Kenya's coast of whom 3,200 were Somalis. Human Rights Watch interview with Department of Refugee Affairs, Nairobi, October 6, 2008. However, the vast majority of Somalis are generally known to live in Nairobi.
[174]Human Rights Watch interview with Department of Refugee Affairs, Nairobi, October 6, 2008.
[175] Of these Somali nationals, 14,524 were recognized refugees and 566 were asylum seekers. UNHCR Statistics, on file with Human Rights Watch and Human Rights Watch email exchange with UNHCR, March 4, 2009.
[176] In 2001, UNHCR stated that the total number of refugees (of all nationalities) living in Nairobi was likely to be at least three times the number that UNHCR had officially registered. Human Rights Watch, Hidden in Plan View, p. 27.
[177] Confidential Human Rights Watch interview, Dadaab, October 15, 2008. According to these interviewees, Somali refugees traveling directly to Nairobi usually have friends or relatives there they can stay with or have enough money to survive without assistance.
[178]Human Rights Watch email exchange with UNHCR, February 11, 2009.
[179]Human Rights Watch interview with RCK, Dadaab, October 17, 2008.
[180]Human Rights Watch interview with UNHCR, Nairobi, October 7, 2008.
[181] Section 17(f), 2006 Refugees Act. Human Rights Watch interview with UNHCR, Nairobi, October 7, 2008.
[182] Section 11(3), 2006 Refugees Act.
[183] The procedure is as follows. Refugees request UNHCR (camp) field offices for an application form. Once completed, they submit the form to DRA staff working inside UNHCR's field offices in Hagadera (Mondays), Ifo (Wednesdays), and Dagahaley (Thursdays). If the DRA approves the application, UNHCR prepares a movement pass with the refugee's photo, name, date of birth, UNHCR ration card number, final destination, and validity period. The DRA then stamps the travel document. If the DRA rejects the application, the DRA gives reasons and the applicant can appeal against the refusal. If the appeal is unsuccessful, there is no further appeal. There are no statistics available on the number of refusals, appeals or rejection of appeals. Human Rights Watch interview with Refugee Council Kenya, Dadaab, October 17, 2008.
[184] Human Rights Watch interview with Refugee Council Kenya, Dadaab, October 17, 2008.
[185] Human Rights Watch interviews with Refugee Council Kenya and with Department of Refugee Affairs, Dadaab, October 17, 2008. In 2002, Human Rights Watch recommended that until full freedom of movement could be ensured, the Kenyan government should establish a system under which the following five categories of refugees would be granted permission to travel outside the camps: (i) those experiencing serious security problems in the camps; (ii) those in need of medical care only available in urban centers; (iii) those who had lived in the camps for more than three years; (iv) those in need of education not available in the camps; (v) those who relatives residing lawfully outside the camps. Hidden in Plain View, p. 6.
[186]Human Rights Watch email exchange with UNHCR, Geneva, February 20, 2009.
[187]Section 16(1)(a) of the 2006 Refugees Act states that "every recognized refugee … shall be entitled to the rights … in the international conventions to which Kenya is party." Kenya's international obligations require it to guarantee refugees the right to choose their own residence and to move freely throughout Kenya. Article 26 of the 1951 Refugee Convention. Article 12(1), ICCPR. Article 12(3) provides that the only exceptions permitted to this right are those "provided by law … and necessary to protect national security, public order (ordre public), public health or morals or the rights and freedoms of others." Section 81(3)(a) of Kenya's Constitution provides that a person's freedom of movement in Kenya may be restricted if it is "reasonably required in the interests of defence, public safety or public order." The Constitution of Kenya, revised 2001, http://www.bunge.go.ke/downloads/constitution.pdf (accessed February 11, 2009).
[188] This certificate states that the holder is a UNHCR-recognized refugee, that (s)he is not entitled to humanitarian assistance from UNHCR and that the holder may relinquish the certificate in exchange for a travel document to Dadaab and registration there as a refugee. Human Rights Watch interview with Kenyan lawyer in Nairobi, October 8, 2008.
[189] Article 28, 1951 Refugee Convention. Human Rights Watch interview with Kenyan legal aid NGO in Nairobi, October 20, 2008. Convention Travel Documents are issued by the Kenyan authorities only after UNHCR has recognized a person as a refugee. Human Rights Watch email exchange with UNHCR, February 20, 2009.
[190] As noted above, UNHCR records the biometric data (photos and fingerprints) of all new arrivals in Dadaab which are checked against a database containing biometric data of all Kenyan nationals. This is to prevent Kenyan nationals-particularly Kenyan Somalis living in North Eastern Province who-from fraudulently registering in Dadaab as Somali refugees.
[191]See above, footnote 28.
[192]Human Rights Watch interview with UNHCR, Nairobi, October 7, 2008.
[193]Human Rights Watch email exchange with UNHCR, March 4, 2009.
[194]Human Rights Watch interviews with Kenyan NGOs working with refugees in Nairobi, October 2008. In 2002, Human Rights Watch reported on the problem of delays in UNHCR's Refugee Status Determination process. Human Rights Watch, Hidden in Plain View, pp. 67-71.
[195]Human Rights Watch email exchange with UNHCR, Nairobi, March 4, 2009.
[196] Human Rights Watch interview with Kenyan legal aid NGO, Nairobi, October 20, 2008.
[197] Human Rights Watch interview with Refugee Consortium Kenya, Dadaab, October 17, 2008.
[198] Human Rights Watch interview with UNHCR, Nairobi, October 7, 2008.
[199]Until late 2007/early 2008, UNHCR first applied lengthy refugee status determination procedures under the 1951 Refugee Convention, according to which each refugee had to show why she personally feared persecution in Somalia. Since the new procedures were put in place in early 2008, only a few Somali asylum seekers whose profile raises concerns under the 1951 Refugee Convention's exclusion clauses are then assessed separately under that Convention. Human Rights Watch interview with UNHCR Nairobi, October 24, 2008, and Human Rights Watch email exchange with UNHCR, March 2008. When conducting refugee status determination under the 1951 Refugee Convention, UNHCR is guided by its own rules set out in UNHCR, "Handbook on Procedures And Criteria for Determining Refugee Status," UN Doc. HCR/1P/4/Eng/REV.2, 1979 (edited 1992), http://www.unhcr.org/publ/PUBL/3d58e13b4.pdf (accessed January 25, 2009).
[200]Human Rights Watch interviews with three Kenyan NGOs working with Somalis in Nairobi, October 2008, and with five Somali refugees, Eastleigh, October 20-22, 2008. In 2002, Human Rights Watch reported on how asylum seekers and refugees of all nationalities faced corrupt Kenyan police practices which involved police routinely ignoring or destroying documents stating that the holder was an asylum seeker or recognized refugee and then held and threatened them with arrest and detention or detained them at a police station until they or their relatives paid a bribe (ranging from US$5 – US$50) to secure their release. Human Rights Watch, Hidden in Plain View, pp. 42-44.
[201]Human Rights Watch email exchange with UNHCR Nairobi, February 5, 2009.
[202] There is some confusion amongst NGOs working with Somali asylum seekers and refugees in Nairobi as to whether or not UNHCR issues so-called "asylum seeker certificates" in addition to appointment slips. UNHCR confirmed that with the exception of a few cases, it almost never issues such certificates. Human Rights Watch email exchange with UNHCR, March 4, 2009.
[203] Human Rights Watch interviews with three Kenyan NGOs working with Somalis in Nairobi, October 2008.
[204]Human Rights Watch email exchange with UNHCR, March 4, 2009.
[205] Section 7(2)(i) and (j) and Section 14, 2006 Refugees Act.
[206] In its interviews with NGO and UNHCR staff in Nairobi, October 2008, Human Rights Watch was unable to identify to what extent the DRA is fulfilling its refugee status determination mandate. Human Rights Watch was also unable to obtain clarity, or statistics, from the DRA.
[207]Human Rights Watch interviews with UNHCR, Nairobi, October 7, 2008, and with Kenyan NGOs working with Somali refugees, Nairobi, October 7 and 22, 2008.
[208]Human Rights Watch interview with Kituo al-Sharia, January 19, 2009.
[209]Human Rights Watch interview with Kituo al-Sharia, October 21, 2008.
[210]According to a legal aid NGO working with refugees in Nairobi, these certificates are mentioned in as yet un-promulgated procedures still to be adopted under the 2006 Refugees Act. They are due to be given to refugees recognized by the DRA under as yet un-established refugee status determination procedures. Human Rights Watch telephone interview with Kituo al-Sharia, January 19, 2009.
[211]In 2008, the Refugees Commissioner issued a Gazette notice saying that holder of cards that appear to have expired had been extended for five years. Human Rights Watch interview with Kituo al-Sharia, January 19, 2009.
[212]Human Rights Watch interview with Kituo al-Sharia, January 19, 2009.Although prima facie refugee status determination under the OAU Convention definition would make sense for Somalis who are clearly prima facie refugees, the difficulty has been that other nationals such as Ethiopians have also been registered under this procedure. Human Rights Watch interview with Kituo al-Sharia, January 19, 2009.
[213]Human Rights Watch interview with UNHCR, Nairobi, October 7, 2008.
[214]Human Rights Watch interviews with various NGOs in Nairobi, October 2008.
[215]"Plus other growth" refers to increases in the camps' population due to births and family reunification determinations.