I. Summary
I'm a former cop. I'm a true believer in law and order. But my son was a child when this happened. He wasn't thinking like an adult, and he wasn't an adult . . . how is it that the law can treat him as if he is one?
-Frank C., father of youth offender sentenced to life without parole, October 22, 2004
Children can and do commit terrible crimes. When they do, they should be held accountable, but in a manner that reflects their special capacity for rehabilitation. However, in the United States the punishment is all too often no different from that given to adults.
In civil matters, state and federal laws recognize the immaturity and irresponsibility of children. For example, they typically establish eighteen as the minimum age to get married without parental consent, to vote, to sign contracts, or to serve on a jury. Yet in forty-two states and under federal law, the commission of a serious crime by children under eighteen-indeed in some states children as young as ten-transforms them instantly into adults for criminal justice purposes. Childrenwho are too young to buy cigarettes legally, boys who may not have started to get facial hair, kids who still have stuffed animals on their beds, are tried as adults, and if convicted, receive adult prison sentences, including life without parole (LWOP).
This report is the first ever national analysis of life without parole sentences for children. Human Rights Watch and Amnesty International have discovered that there are currently at least 2,225 people incarcerated in the United States who have been sentenced to spend the rest of their lives in prison for crimes they committed as children. In the United States, departments of corrections do not maintain publicly accessible and accurate statistics about child offenders incarcerated in adult prisons, and there is no national depository of these data. Therefore, we were able to collect data on individuals sentenced to life without parole for crimes they committed as children only by requesting that it be specially produced for us by each state's corrections department.
The public may believe that children who receive life without parole sentences are "super-predators" with long records of vicious crimes. In fact, an estimated 59 percent received the sentence for their first-ever criminal conviction. Sixteen percent were between thirteen and fifteen years old at the time they committed their crimes. While the vast majority were convicted of murder, an estimated 26 percent were convicted of felony murder in which the teen participated in a robbery or burglary during which a co-participant committed murder, without the knowledge or intent of the teen. Racial disparities are marked. Nationwide, the estimated rate at which black youth receive life without parole sentences (6.6 per 10,000) is ten times greater than the rate for white youth (0.6 per 10,000).
Our research shows significant differences among the states in the use of life without parole sentences for children. For example, Virginia, Louisiana, and Michigan have rates that are three to seven-and-a-half times higher than the national average of 1.77 per 100,000 children nationwide. At the other end of the spectrum, New Jersey and Utah permit life without parole for children but have no child offenders currently serving the sentence. Alaska, Kansas, Kentucky, Maine, New Mexico, New York, West Virginia, and the District of Columbia all prohibit the sentence for youth offenders. In May of 2005, Texas changed its law to allow individuals found guilty of a capital felony (including those below the age of eighteen) to be sentenced to life without parole. However, we could not definitively interpret this legislation, nor could we include data from Texas in this report, because the law went into effect on September 1, 2005, meaning it had not yet been applied or interpreted by the courts of Texas when this report went to press.
Before 1980, life without parole was rarely imposed on children. The number of child offenders who received the sentence each year began to increase in the late 1980s, reaching 50 in 1989. It peaked in 1996 at 152 and then began to drop off; in 2003, 54 child offenders entered prison with the sentence. But states have by no means abandoned the use of life without parole for child offenders: the estimated rate at which the sentence is imposed on children nationwide remains at least three times higher today than it was fifteen years ago. In fact, the proportion of youth offenders convicted of murder who receive life without parole has been increasing, suggesting a tendency among states to punish them with increasing severity. For example, in 1990 there were 2,234 youth convicted of murder in the United States, 2.9 percent of whom were sentenced to life without parole. Ten years later, in 2000, the number of youth murderers had dropped to 1,006, but 9.1 percent were sentenced to life without parole.
In addition, in eleven out of the seventeen years between 1985 and 2001, youth convicted of murder in the United States were more likely to enter prison with a life without parole sentence than adult murder offenders. Even when we consider murder offenders sentenced to either life without parole or death sentences, in four of those seventeen years, youth were more likely than adults to receive one of those two most punitive sentences.
Such harsh treatment for youth offenders cannot be squared with the most fundamental tenets of human rights law. International standards recognize that children, a particularly vulnerable group, are entitled to special care and protection because they are still developing physically, mentally, and emotionally. States are required to offer a range of alternatives to institutionalization. The imprisonment of a child should always be a measure of last resort, focused on the child's rehabilitation, and for the shortest suitable period of time. While incarceration may be proper for youth convicted of very serious crimes such as murder, this report argues that a sentence of life without the possibility of parole is never appropriate for youth offenders.
The dramatic increase in the imposition of life without parole sentences on child offenders in the United States is, at least in part, a consequence of widespread changes in U.S. criminal justice policies that gathered momentum in the last decades of the twentieth century. Responding to increases in crime and realizing the political advantages of promoting tough law and order policies, state and federal legislators steadily increased the length of prison sentences for different crimes and expanded the types of offenders facing prison sentences. They also promoted adult trials for child offenders by lowering the minimum age for criminal court jurisdiction, authorizing automatic transfers from juvenile to adult courts, and increasing the authority of prosecutors to file charges against children directly in criminal court rather than proceeding in the juvenile justice system. The United States thus abandoned its commitment to a juvenile justice system and the youth rehabilitation principles embedded in it.
"Adult time for adult crime" may be a catchy phrase, but it reflects a poor understanding of criminal justice principles. If the punishment is to fit the crime, both the nature of the offense and the culpability or moral responsibility of the offender must be taken into account. As the U.S. Supreme Court has repeatedly recognized, the blameworthiness of children cannot be equated with that of adults, even when they commit the same crime. Most recently, in Roper v. Simmons in 2005, the Court ruled that the execution of child offenders was unconstitutional, finding that juveniles are "categorically less culpable" than adult criminals. The ruling noted that juveniles lack the "well-formed" identities of adults, are susceptible to "immature and irresponsible behavior," and vulnerable to "negative influences and outside pressures." Neuroscientists have recently identified anatomical bases for these differences between juveniles and adults, establishing the behavioral significance of the less developed brains of children.
Life without parole sentences for child offenders-meaning there is no possibility of release during the prisoner's lifetime-effectively reject the well-established principle of criminal justice that children are less culpable than adults for crimes they commit. As the father of a teen offender serving life without parole pointed out to us: "I'm a former cop. I'm a true believer in law and order. But my son was a child when this happened. He wasn't thinking like an adult, and he wasn't an adult . . . how is it that the law can treat him as if he is one?"[1] The anguish and anger of a victim's family and friends may well be the same whether a murder is committed by a child or an adult. But justice requires a sentence commensurate with both the nature of the crime and the culpability of the offender.
Three Young Child Offenders
|


For supporters of life without parole sentences, the immaturity of child offenders is not a good enough reason to abolish the sentence. They argue that the punishment also serves to deter future crime. But does youth deterrence actually happen? Research has failed to show that the threat of adult punishment deters adolescents from crime. This is not surprising, given the well-documented limited abilities of children, including teenagers, to anticipate the consequences of their actions and rationally assess their options. Few adolescents are likely to be able to grasp the true significance of a life sentence. One twenty-nine-year-old woman serving life without parole told a researcher for this report that when she was sentenced, at the age of sixteen:
I didn't understand "life without" . . . [that] to have "life without," you were locked down forever. You know it really dawned on me when [after several years in prison, a journalist] came and . . . he asked me, "Do you realize that you're gonna be in prison for the rest of your life?" And I said, "Do you really think that?" You know. . . and I was like, "For the rest of my life? Do you think that God will leave me in prison for the rest of my life?"[2]
Virtually all countries in the world reject the punishment of life without parole for child offenders. At least 132 countries reject life without parole for child offenders in domestic law or practice. And all countries except the United States and Somalia have ratified the Convention on the Rights of the Child, which explicitly forbids "life imprisonment without possibility of release" for "offenses committed by persons below eighteen years of age." Of the 154 countries for which Human Rights Watch was able to obtain data, only three currently have people serving life without parole for crimes they committed as children, and it appears that those four countries combined have only about a dozen such cases.
Sentencing children as adults means they may well enter prison while they are still under eighteen. One third of the youth offenders now serving life without parole entered prison while they were still children, in violation of international human rights standards that prohibit the incarceration of children with adults. But regardless of the precise age at which they entered prison, all have faced the same conditions as the older adults with whom they live: gangs, sexual predators, extortion, and violence. They also confront special hardships inherent in their sentence. Although it may take time to fully register in a child's mind, the sentence sends an unequivocal message to children that they are banished from society forever. Youth are told that they will die in prison and are left to wrestle with the anger and emotional turmoil of coming to grips with that fact. They are denied educational, vocational, and other programs to develop their minds and skills because access to those programs is typically restricted to prisoners who will someday be released, and for whom rehabilitation therefore remains a goal. Not surprisingly, child offenders sentenced to life without parole believe that U.S. society has thrown them away. As one young man told a researcher for this report, "Seems like. . .since we're sentenced to life in prison, society says, 'Well, we locked them up, they are disposed of, removed.'"[3]
U.S. federal and state governments have the responsibility of ensuring community safety. But government is also responsible for ensuring that justice is served when a person is tried, convicted, and sentenced. The terrible crimes committed by children can ruin lives, causing injury and death to the victims and grief to their families and friends. Sentencing must reflect the seriousness of the crime, but it also must acknowledge that culpability can be substantially diminished by reason of the youth and immaturity of the perpetrator. Child offenders should be given the possibility of freedom one day, when they have matured and demonstrated their remorse and capacity for rehabilitation.
Note: In keeping with international human rights standards, throughout this report we use the terms "child" and "children" to refer to persons under the age of eighteen. Unless otherwise indicated, all references to youth, adolescents, minors, and juveniles also refer to persons under the age of eighteen.
II. Recommendations
To the President of the United States
ØPropose and urge Congress to enact legislation abolishing the sentence of life without parole for children convicted of federal crimes.
ØSubmit the Convention on the Rights of the Child to the U.S. Senate for its consent to ratification without reservation.
To the United States Congress
ØAbolish the sentence of life without parole for children convicted of federal crimes. Enable current child offenders serving life without parole to have their cases reviewed by a court for reassessment and re-sentencing to a sentence with the possibility of parole.
ØConsent (in the Senate) to ratification of the Convention on the Rights of the Child without reservation.
ØIncrease funding to states that eliminate life without parole sentences for child offenders in order to ensure state prisons can increase rehabilitative programs focused on helping such offenders to qualify for parole.
ØAmend Part D of the Juvenile Justice and Delinquency Prevention Act to require the Office of Juvenile Justice and Delinquency Prevention to serve as a central depository, analyst, and disseminator of national data on children tried and sentenced as adults.
To the Attorney General of the United States
ØSuspend the sentence of life without parole for child offenders pending its abolition.
To United States Attorneys
ØIn accordance with the instruction to U.S. government attorneys, contained in the U.S. Attorneys' Manual, to consider factors such as proportionality and whether a conviction will achieve rehabilitation, do not bring charges against a youth offender that would result in a life without parole sentence when there are other charges that could be suitably brought.
To State and Federal Judges
ØExercise any available discretion to not impose the life without parole sentence on child offenders since it constitutes a violation of international human rights law. If the sentence is mandated by statute, evaluate whether, as applied to the defendant on trial, it would constitute cruel and unusual punishment in violation of the Eighth Amendment to the U.S. Constitution.
To State Governors
ØPropose and urge the enactment of state legislation that eliminates the sentence of life without parole for any crime committed by a person under the age of eighteen.
ØUntil the sentence of life without parole for children is abolished, review the clemency applications of all child offenders sentenced to life without parole and commute their sentences to terms of years or give clemency. In reviewing clemency applications, take into account the international legal prohibition against life without parole for persons under the age of eighteen.
ØDevelop and publish annual statistics on youth in the adult criminal justice system, including: demographic information (age, race, sex), data on children tried in criminal court, the manner by which each child reached criminal court (e.g., transfer, direct file), the nature of the crimes alleged, existence of prior adult record, and if convicted, the precise sentence received.
To State Legislators
ØEnact legislation that abolishes the sentence of life without parole for any offense committed by a child. Such legislation should include a retroactivity provision enabling current child offenders serving life without parole to have their cases reviewed by a court for re-assessment and re-sentencing to a sentence with the possibility of parole.
ØStrictly limit the practice of trying children in the adult criminal courts. There should be a presumption in favor of adjudicating children's cases in the juvenile justice system. The transfer of children's cases to the criminal court should be strictly limited to those cases in which a balancing between the severity of a child offender's crime, his or her age, and his or her best interests clearly points to a need for transfer, and only if accused child offenders transferred to the criminal court can be provided with the care and safeguards, such as not to be compelled to give testimony or to confess guilt, to which they are entitled under international law.
ØRepeal or modify existing transfer provisions that automatically require all children charged with certain offenses to be tried as adults. The decision to transfer a case to the criminal courts should be subject to judicial discretion and should never be mandatory.
ØEnact legislation that eliminates the prosecutorial option of filing cases against child offenders directly in adult criminal court. All cases against child offenders, regardless of their alleged crime, should be brought first in a juvenile court. Enact legislation that provides criminal court judges with the discretion to send child offenders to juvenile detention facilities until they are at least twenty-one, before being sent to adult prison. Ensure that offenders over the age of eighteen who remain in juvenile detention facilities are housed separately from those below the age of eighteen.
ØIncrease funding, training, and administrative support for juvenile public defender programs.
To State Prosecutors
ØPending the abolition of the sentence of life without parole for child offenders, cease seeking sentences of life without parole for child offenders.
ØInstead of filing charges against child offenders directly in criminal court, refer all child offenders to juvenile court.
ØBefore any determination to transfer a case to the criminal courts is made, request and participate in, as an officer of the court, a full and fair assessment of each child offender's competency to stand trial as an adult.
To State Criminal and Juvenile Court Judges
ØBefore a child is tried before a criminal court, automatically raise the issue of a
child defendant's competency to stand trial as an adult.
ØEnsure that transfer hearings for child offenders in juvenile court are meaningful and are limited to cases in which a balancing between the severity of the child offender's crime, age, and best interests clearly points to a need for transfer. The hearing must weigh several factors, including at a minimum: the nature and seriousness of the offense, the age and history of the child, and his or her amenability to treatment. The court's decision should be written and should explain all evidence relied upon and reasons for ruling for or against transfer to adult criminal court. If appealed, transfer decisions should be subject to review by a higher tribunal.
To Defense Attorneys
ØEnsure that child defendants, as well as their parents or guardians, understand all procedures, defense strategies, and the seriousness of the charges, including possible sentences, so they can fully exercise their rights as clients to participate in their legal defense.
ØVigorously defend the interests of child defendants during competency and transfer hearings, as well as during other aspects of the criminal process.
ØAssist child offenders in the filing of clemency applications.
To State and Federal Officials Who Fund and Administer CorrectionsPrograms
ØChild offenders serving life without parole should have access to all prison programs offered-educational, vocational, occupational, and other rehabilitative programs-regardless of the length of their sentence.
ØChild offenders under the age of eighteen should not be held with adults; other decisions about where to hold youth offenders should take into account their mental and physical maturity and should be reviewed on a regular basis.
ØProvide mental health and social services to assist youth offenders in adjusting to prison conditions as well as in coping with the length of their sentences.

Case Study: Peter A.
Peter A. was age fifteen both in this photo and when he committed his crime.
© 2005 Private.
At the time of his crime, Peter A.[4] was a fifteen-year-old sophomore in high school, living at home in Chicago, Illinois with his mother, her fiancé, and his younger brother. He was seven years old when his parents divorced, and he was then raised by his mother, who supported the family through welfare and other public assistance.[5] According to Peter, he was not particularly interested in school, although he enjoyed and did well in his earth science class, which involved a lot of "lab work with my hands."[6] His probation officer reported him to be an "average student."[7]
Peter spent much of his time with his older brother, who had his own apartment. Peter said: "[My brother] tried to keep me out of trouble . . . my sophomore year-homecoming-he said, 'there's gonna be trouble, they're gonna be shooting at the school. You can't go.' . . . and they were shooting at the school, he was right. He wouldn't let me go to house parties or nothing. He was trying to keep me out of trouble, but at the same time, he had me along." Peter's older brother was involved in drug dealing, mostly cocaine. Peter said he would sometimes act as a courier for his brother, delivering drugs to customers. He also learned how to steal cars at an early age and had a juvenile adjudication for possession of a stolen vehicle when he was thirteen. He was placed on one year of probation and completed it to the satisfaction of his probation officer. He had no prior record of violent crime and no prior felony convictions.[8] He experimented with both alcohol and marijuana, but says he stopped using any drugs or alcohol when he was placed on probation.
Following a theft of "drugs and money" from his brother's apartment, Peter said that he went with an eighteen-year-old to steal a van to help to get the stolen goods back. Peter says he acted on his brother's instructions, and he
has always admitted his involvement in stealing the van. Peter says he sat in the back seat of the stolen van with another young man, age twenty-one, and the eighteen-year-old driver, both of whom had guns. They drove to the home of the men they were told had robbed Peter's brother. No one sat in the front passenger's seat, because "there was glass on the seat" from the window Peter had broken during the theft.
According to Peter, when the three arrived at the victims' home, Peter stayed in the stolen van while the other two went inside. Peter heard shots, and a few seconds later one of the co-defendants came running out of the house, without having recovered the drugs or money. The two sped away from the home, leaving the other young man behind. Peter said that he learned on return to his brother's apartment that two people had been shot to death in the botched robbery. A few days later, he found out that one of the victims was a close high school friend of his, a young man who had no involvement in the original robbery of Peter's brother. This friend, as Peter put it, was "completely innocent . . . just in the wrong place at the wrong time." Peter was arrested approximately one week after the crime, after his two co-defendants were already in custody.
Peter was questioned for a total of eight hours at the police station, without his mother or an attorney present. During this time, he readily admitted to his role in stealing the van.[9] His admission, "which the assistant State's Attorney wrote down, did not state whether defendant intended to kill the victims."[10] Peter explained, "Although I was present at the scene, I never shot or killed anyone." There was no physical evidence indicating that Peter had entered the victims' home, and one of his co-defendants was proven at trial to have been the triggerman in the crime, for which he was convicted. Peter was convicted of felony murder (two counts), which carries a mandatory sentence of life without parole. He was held accountable for the double murder because it was proved he had stolen the van used to drive to the victims' house.
The judge in Peter's case found that Peter, without a father at home, had fallen under the influence of his older brother. The judge called Peter "a bright lad" with "rehabilitative potential" and stated that he had qualms about sentencing Peter to life without parole. In his decision, he wrote: "[T]hat is the sentence that I am mandated by law to impose. If I had my discretion, I would impose another sentence, but that is mandated by law."[11] Peter's defense attorney told a researcher for this report that one of the other perpetrators of the crime "was subsequently
acquitted. So, now you have a fifteen-year-old who was waiting outside with a stolen car doing life without parole and a murderer on the streets."[12] Peter, who has already spent nearly half his life behind bars, was twenty-nine years old when he was interviewed for this report in 2005. In prison, has obtained his G.E.D. and completed a correspondence paralegal course, from which he graduated with very good grades.[13] He works as a law clerk in the prison law library and has received one disciplinary ticket in the past six years of his incarceration for possessing an extra pillow and extra cereal in his cell.[14]
III. Background: Youth on Trial
Juvenile Justice Trends in the United States
Two hundred years ago, when the United States was still in its infancy as a nation, child offenders aged fifteen and over were charged and tried in adult criminal courts.[15] As the nineteenth century progressed, children's welfare advocates argued that children's potential for rehabilitation should influence the response to their criminal behavior. By 1899, many states considered it counter-productive to incarcerate children along with adult convicts and began to establish reform houses for child offenders. In addition, reformers advocated establishing a separate system of justice for children, which removed them from adult criminal courts and instead employed "open-ended, informal, and highly flexible policies to rehabilitate" youth offenders.[16] Illinois created the first juvenile court in the United States in 1899.[17] By 1925, all but two states had followed suit.[18]
Until the 1970s, children accused of criminal conduct were almost exclusively brought before juvenile courts. A child could be transferred to stand trial in adult criminal court only if the juvenile court decided that such a transfer served the best interests of the child and of the public. At the request of the prosecutor or at the initiative of the juvenile court judge, the court would hold an adversarial hearing to determine whether the case should be transferred to adult criminal court. The transfer would not be approved unless the juvenile court determined that the adult court was best equipped to adjudicate the case and appropriately address the needs of society and of the offender.[19]
Starting in the mid-1980s, the United States experienced a steep and troubling increase in violent crime, including violent crime by adolescents.[20] In the ten years prior to 1986, the number of homicides committed with guns by offenders aged fourteen to seventeen remained around 965 homicides per year. The number then began a steady rise, peaking in 1994 at 3,337 homicides. Youth homicides then began to drop; by 2002, the number of youth homicides with guns was lower than in 1976.[21]
Before it became apparent that dramatic increases in youth violent crime were a short-lived problem, the nation was consumed by anxiety that bordered on panic. In 1996, Princeton University professor John DiIulio coined the term "super-predator," warning that in the United States, "by the year 2010, there will be 270,000 more juvenile super-predators on the streets than there were in 1990."[22] Politicians and pundits throughout the country told Americans to "brace" themselves "for the coming generation of 'super-predators.'"[23] Public confidence in the juvenile justice system began to wane as concern about youth crime grew. States embraced harsher criminal justice policies for children just as they did for adults, without stopping to ascertain whether or not they would prove effective. Racial disparities grew more pronounced as criminal sentencing became more punitive.
Figure 1, below, presents the relative percentages of black and white youth admitted to adult prisons in the United States, showing that from the early 1980s until the mid-1990s, the relative percentage of black youth offenders admitted to prison grew steeply, while declining for whites. During this same period, however, the rates at which both black and white youth were arrested for serious crimes such as murder increased.[24]Starting in the mid-1990s, the admissions of black youth to adult prison began to decline, although it remained higher than the percentages from the early 1980s.
Figure 1
Source: Data from the National Corrections Reporting Program (NCRP). The NCRP is sponsored by the Bureau of Justice Statistics (BJS), U.S. Department of Justice, and evolved from the need to consolidate data on corrections at the national level. Its objective is to provide a consistent and comprehensive description of prisoners entering and leaving the custody or supervision of state and federal authorities. NCRP data downloads are available online at: http://www.icpsr.umich.edu/NACJD/NCRP/, accessed on September 6, 2005. Note that races other than white and black made up anywhere from 1.1 percent (in 1983) to 7.7 percent (in 1989) of the total prison admissions in any given year. Also, due to overlapping Census 2000 definitions between race (black or white) and ethnicity (Hispanic or non-Hispanic), Hispanics are often (though not always) included in black or white race counts and classifications.
Adult Trial of Children
Legislatures seized upon a simple formula: youth who commit "adult" crimes (e.g., murder, robbery, drug dealing) should be tried like adults. By 1997, all states but three (Nebraska, New York, and Vermont) had changed their laws to make it easier and more likely that child offenders would stand trial and be sentenced in adult criminal courts.[25] Three mechanisms have been used to increase the adult trial of juvenile offenders:
- Withdrawal of Juvenile Jurisdiction: Legislation precludes juvenile court jurisdiction in certain cases, typically depending on the age of the child and the nature of the offense. For example, in some states, juvenile courts do not have jurisdiction over a child accused of first degree murder; such crimes may only be tried in adult criminal court.[26]
- Discretion to Direct File: Legislation gives prosecutors the discretion to file charges against child offenders accused of serious crimes in adult criminal court rather than beginning in juvenile courts. If they have this option, prosecutors typically choose to proceed with the prosecution of children as adults.[27]
- Lowering the Age for Adult Court Jurisdiction: Legislation simply lowers the age at which offenders are subject to adult trials.
As of 2005, all states and the federal government have the capacity to try certain youth as adults in criminal court. As Table 1 (below) reveals, these provisions vary from state to state, based on offense and age criteria.
Table 1: Minimum Age for Adult Prosecution and for Life without Parole Sentencing by State
State |
Lowest age at offense for which adult prosecution is possible |
Minimum age at offense for LWOP sentencing |
State |
Lowest age at offense for which adult prosecution is possible |
Minimum age at offense for LWOP sentencing |
Alabama |
14 |
16 |
Montana |
12 |
12 |
Alaska |
0 |
No LWOP |
Nebraska |
0 |
0 |
Arizona |
0 |
14 |
Nevada |
8 |
8 |
Arkansas |
14 |
14 |
New Hampshire |
13 |
13 |
California |
14 |
16 |
New Jersey |
14 |
14 |
Colorado |
12 |
12 |
New Mexico |
15 |
No LWOP |
Connecticut |
14 |
14 |
New York |
13 |
No <18 LWOP |
Delaware |
0 |
0 |
North Carolina |
13 |
13 |
District of Columbia |
0 |
No <18 LWOP |
North Dakota |
14 |
14 |
Florida |
0 |
0 |
Ohio |
14 |
14 |
Georgia |
12 |
13 |
Oklahoma |
7 |
13 |
Hawaii |
0 |
0 |
Oregon |
0 |
No <18 LWOP |
Idaho |
14 |
14 |
Pennsylvania |
0 |
0 |
Illinois |
13 |
13 |
Rhode Island |
0 |
0 |
Indiana |
0 |
16 |
South Carolina |
0 |
0 |
Iowa |
14 |
14 |
South Dakota |
0 |
10 |
Kansas |
10 |
No LWOP |
Tennessee |
0 |
0 |
Kentucky |
14 |
No <18 LWOP |
Texas |
14 |
No LWOP |
Louisiana |
14 |
15 |
Utah |
14 |
14 |
Maine |
0 |
No LWOP |
Vermont |
10 |
10 |
Maryland |
0 |
0 |
Virginia |
14 |
14 |
Massachusetts |
14 |
14 |
Washington |
0 |
15 |
Michigan |
0 |
0 |
West Virginia |
0 |
No LWOP |
Minnesota |
14 |
14 |
Wisconsin |
0 |
10 |
Mississippi |
13 |
13 |
Wyoming |
13 |
13 |
Missouri |
12 |
12 |
Federal |
15 |
15 |
Source: National Center for Juvenile Justice, State Juvenile Justice Profiles, available online at: http://www.ncjj.org/stateprofiles, accessed on June 6, 2005; Second Chances: Juveniles Serving Life without Parole in Michigan Prisons (American Civil Liberties Union (ACLU) of Michigan, 2004), p.3, available online at: www.aclumich.org/pubs/juvenilelifers.pdf, accessed on September 13, 2005; Juvenile Offenders and Victims: 1999 National Report, p. 106; and state statutory research.
In addition, in ten states youth may only receive a life without parole sentence if they are one or several years older than the minimum age for adult prosecution. In other words, minors may be prosecuted as adults in Alabama from the age of fourteen, but they may only be sentenced to life without parole if they were sixteen or older at the time of the offense. By contrast, in Colorado children as young as twelve are eligible both for trial as adults and for the life without parole sentence.

In most states that provide prosecutors the discretion to file cases in adult court, there is no judicial supervision or public accountability for their decisions, and prosecutors are not required to submit in writing the reasons for the direct charge in criminal court. However, at least six states and the federal government do attempt to limit prosecutorial discretion in some way.[28]

Transfer hearings would at least offer the possibility of a judicial examination in juvenile court of the justification for sending a child offender to be tried in criminal court.[29] These hearings are becoming increasingly rare.The available data indicate the proportion of children who have had a transfer hearing before being tried in criminal court has been steadily declining. In 1996, approximately 36 percent of child offenders in adult court had a prior transfer hearing in juvenile court; by 2000 the percentage had fallen to an estimated 13 percent.[30]
Moreover, U.S. juvenile court transfer hearings do not meet the international law standard that children accused of crimes should be dealt with, whenever appropriate, outside the realm of judicial proceedings in a criminal court.[31] U.S. transfer hearings often also give short shrift to the duty "to ensure that children [accused of crimes] are dealt with in a manner appropriate to their well-being and proportionate both to their circumstances and the offense."[32] Transfers routinely occur even in cases that appear not to merit the more punitive treatment that often results from trial and conviction in a criminal court.
When children are tried in criminal courts, little or no accommodation is made to take into account their youth. Whether eleven or seventeen, the child offender must participate in all the same pre-trial and trial procedures and confront all the same decisions that adult defendants do. Contrary to popular belief, it is the child and not his or her parent or guardian who must decide what to tell the police and defense attorneys, whether or not to follow attorney instructions, whether to testify, whether to give information to the prosecution, and whether to go to trial or accept a plea bargain.
Although common sense would suggest that many children are simply too young to undertake such weighty legal responsibilities, it is rare for courts to consider whether children lack the competence to stand trial because of their age.[33] To shed light on thechallenges children tried as adults face in court, the MacArthur Foundation Research Network on Adolescent Development and Juvenile Justice, whose members include leading legal and scientific professionals as well as academic experts, has been conducting a long term study of children's trial competency. The study has examined a broad range of factors, including children's understanding of basic elements in the judicial process and of their rights as defendants, their ability to put facts together and draw logical conclusions, and their ability to make decisions independent of pressure from authority figures.[34] The research indicates that many young adolescents, particularly those fifteen and under, are not developmentally and intellectually mature enough to be legally "competent" to stand trial.[35]
Any criminal defendant can make bad decisions. However, child offenders contacted for this report described a variety of errors in judgment in their dealings with police and during their adult criminal trials that may have been related to their youth. We found some child offenders who:
- Waived their constitutional rights and made confessions, including confessions they later said were false: For example, Gary C. from Menard, Illinois said that he falsely confessed to a murder that occurred when he was fourteen years old. The police interrogated him for several hours in the company of his mother. But after his mother left the room, the interrogation continued. Gary said he was "alone" and "scared" and ultimately told the police what they wanted to hear. When he left out details or failed to make statements that fit with the version of the crime already developed by the police, he said that they helped him along, saying things such as: "[Y]ou used the ladder to get in, right?" Afterwards, no one double checked the statement. Gary said he did not know what would happen once he confessed, but he had no idea he could be sentenced to life without parole.[36]
- Did not recognize bad advice from defense attorneys: Thomas M. is serving life without parole for a felony murder committed in Colorado when he was fifteen years old. Before trial, Thomas's trial attorney, Eydie Elkins, convinced him to write a letter of remorse.[37] Elkins went to the same church as the victim's family and delivered the letter to her pastor, who gave it to his congregant, the victim's mother, who then turned it over to the prosecutor. Although the letter was not a direct confession, it was the primary piece of evidence used to convict Thomas of the felony murder, in which a young man was shot and killed during a botched robbery.
- Were hampered by low levels of education, including illiteracy: Clifford S., who was convicted for a murder committed when he was sixteen years old, is serving life without parole in Arkansas. Clifford was illiterate. When he was interviewed for this report, he said that when he was being questioned about the crime, a detective said he could take a polygraph test if he signed a form. Clifford said that the detective "wrote stuff down on this piece of paper you know . . . You know, I can't read and write." Clifford continued, "When he got that piece of paper, you know and I signed my name on it, he stepped out and told the police that I confessed to the crime. And I heard it and I was like, 'No I didn't!'" When asked if the detective told him what the paper said, Clifford answered: "No ma'am. When I went to trial, they told him to read it and that was when I first heard what he wrote. . . . And he said in court that he wrote it. Only thing I did was sign my name on it."[38]
- Did not understand what was at stake during their trials: An Illinois defense attorney who represented a youth sentenced to life without parole said: "[My] client understood the proceedings. I've been a defense attorney for many years and he was a smart kid, he pretty much got what was going on. But it was still very difficult for him to comprehend where he might end up, to really grapple with the sentence and understand how important it was to work with me. It's the same as a bunch of young soldiers going off to battle when they've never met or had anyone die before."[39]
The trial of children as adults often fails to provide children with the special safeguards and care to which they are entitled under international law. Juvenile justice advocates in the United States widely recognize that decisions to send youth to adult court are often arbitrary and unfair and pay scant attention to the goal of rehabilitation. Once in the adult system, adolescents are deprived of the wide variety of rehabilitative sentencing options that they might be eligible to receive in the juvenile court system-sentencing options that are designed to give them the tools they need to turn their lives around and become law-abiding members of society. In Florida, for example, children transferred to adult court were shown to be a third more likely to re-offend than those sent to the juvenile system for the same crime and with similar prior records.[40]In 2000, Florida had more children in adult state prisons than any other state, yet Florida's violent juvenile crime rate was 54 percent higher than the national average.[41]

Case Study: Samantha L.
Samantha L. was age seventeen both in this photo and when she committed her crime.
© 2005 Private.
Samantha L. had already spent nineteen years behind bars when she was interviewed for this report. Samantha said that her parents divorced when she was two years old and that her father "was an alcoholic" who had "raped my mom and my sister."[42] At seventeen, Samantha was unemployed and had a baby son. She had been charged as a juvenile with assault, two burglaries, and auto theft.
Samantha said she spent most of her time with her older sister, and they often dated older men. One of these men, Rick, involved her in selling marijuana. She sold marijuana to an undercover policeman and was arrested and sent to a juvenile center as a result. When Samantha was released from the juvenile center, she re-started her relationship with Rick and moved in with him.
One night, Rick talked about wanting to leave town and asked if Samantha knew of anybody who would lend her money. She suggested her closest friend's grandfather, whose house she sometimes cleaned to earn money. They drove to his house, and Samantha and Rick went in to ask for the money. Her friend's grandfather reminded her that she still owed him a housecleaning because of some money he had already paid her, so she decided not to ask for the money. She told Rick she wanted to leave, but he said he wanted to stay to talk to "grandpa" some more. Samantha says she went outside and waited in the truck for Rick. "Rick didn't come out and I knew if I went in it
would take him longer to leave, so I honked the horn. Rick didn't come out so I started the truck thinking he would hear it and come out. He didn't. I pulled around to the front of the house and Rick came out. He got into the truck and started yelling 'I killed him!' I thought he was just making it up . . . because Rick didn't have any blood on him, I really thought he was lying . . . Rick drove the truck back to the man we had borrowed it from."
Samantha and Rick were arrested later that night. Samantha told a researcher for this report that she was not questioned by the police about the details of the crime, because immediately after her arrest Rick took full responsibility for the crime. Subsequently, however, he accused Samantha of the murder, claiming he had initially lied about his role in the crime, because he thought Samantha was pregnant with his child. Samantha wrote that Rick fabricated this explanation for his changed story in order to justify his altered theory of defense. She continued, "I was never pregnant by him, and my only son was seven months old at the time of the crime." Evidence introduced at Rick's trial appeared to corroborate Samantha's description of events.
Samantha was sentenced to life without parole for aiding and abetting first degree murder. Rick was sentenced to life without parole for first degree murder.[43]Samantha told a researcher for this report, "I know I did something wrong, but not as wrong as Rick because I wasn't there, in the house. I wasn't there during all of that. Rick admitted [when he was first questioned by the police] I wasn't there, he told them I didn't make those decisions. . . . I didn't even hold the knife. But, I know it doesn't matter to them."
IV. Sentencing of Youth to Life without Parole
Once children are prosecuted as adults, they become subject to the same prison sentences that can be imposed on adults, including in forty-two states, the sentence of life without parole. Only Kentucky, New York, Oregon, and the District of Columbia specifically exclude anyone under the age of eighteen who is tried as an adult from life without parole sentencing. In twenty-seven of the forty-two states in which youth can be sentenced to life without parole, the sentence is mandatory for anyone, child or adult, found guilty of certain enumerated crimes.[44]
Age, Crime, and Gender
As of 2004, there were at least 2,225 youth offenders serving life without parole in U.S prisons.[45] Because of the absence of any national database tracking the sentencing of youth to life without parole (or indeed any data tracking the presence of child offenders in adult prisons), Human Rights Watch and Amnesty International compiled this figure from data obtained directly from individual state departments of corrections and other sources. This figure includes youth offenders from forty of the forty-two states in which youth offenders may be sentenced to life without parole and from the federal bureau of prisons (see Appendix B for methods).
We have data on age at offense for 1,291 of the child offenders sentenced to life without parole. As shown in Table 2, the youngest children (six in total) were thirteen years old at the time of offense, and the average age was sixteen. Sixteen percent were imprisoned for crimes committed when they were fifteen or younger. Applying this proportion to the total number of youth offenders serving life without parole suggests that some 354 youth offenders nationwide currently face a lifetime behind bars for crimes they committed before their sixteenth birthdays.
Table 2: Age of Child Offenders Sentenced to Life without Parole
at Time of Offense
Age at Offense |
Percentage of Child Offenders |
13.00-13.99 years |
0.5 percent |
14.00-14.99 years |
2.2 percent |
15.00-15.99 years |
13.3 percent |
16.00-16.99 years |
32.0 percent |
17.00-17.99 years |
52.2 percent |
Total: |
100.2 percent (due to rounding) |
Source: Data provided from thirty-eight state correctional departments and additional other sources for the states of Alabama and Virginia.
Life without parole is imposed for a variety of crimes, as shown in Table 3.[46] However, it is most often imposed on child offenders who have been convicted of crimes of homicide, as shown in Figure 2.
Table 3: Crime Categories
General Category |
Includes (in this report) |
Homicide |
Murder, homicide, felony murder, felony homicide, homicide by child abuse, manslaughter, and capital felony (including all degrees of each). |
Other Violent Crimes |
Assault, attempted murder, battery, carjacking, robbery, use of firearm, use of other weapons (including all degrees of each). |
Kidnapping |
Kidnapping (including all degrees of each). |
Sex Crimes |
Sexual battery, rape, and child molestation (including all degrees of each). |
Property Crimes |
Burglary and grand larceny (including all degrees of each). |
Other Crime Categories Used by State Departments of Corrections |
Criminal liability for another person (used only in Connecticut to label two incoming prisoners), compact prisoner (category used to label one incoming prisoner in Iowa), oth-part-2 (category used to label one incoming prisoner in Pennsylvania). |
Source: see Table 2, above.
Figure 2
Source: see Table 2, above.
Almost 93 percent of the youth sentenced to life without parole were convicted of homicide. It is a misconception, however, that the sentence is reserved only for the most calculated and heinous of murderers. As already emphasized, it is often imposed, for example, on children convicted of felony murder-that is, on teens who participated in a felony such as robbery during which another participant in the crime killed someone without the child offender having intended the murder to occur and sometimes without even knowing the other participant was armed. In the cases examined by Human Rights Watch and Amnesty International, many of these felony murder crimes were robberies that went awry, often involving a group of offenders, at least one of whom was an adult. Unfortunately, data are not available to enable us to determine the nationwide number of child offenders convicted of felony murder who are serving life without parole.
However, we do know that 26 percent, or 45 of the 172 youth offenders across the nation who self-reported to us on this question, were sentenced to life without parole for felony murder.[47] We also know that 33 percent of the 24 youth offenders investigated in depth by Human Rights Watch in 2005 in Colorado are serving life without parole for felony murder offenses;[48] and that nearly half of the 146 youth surveyed by the American Civil Liberties Union in Michigan in 2004 were sentenced to life without parole for felony murder or for "aiding and abetting" a murder in which another person pulled the trigger.[49]
In terms of gender, all but a tiny fraction (2.6 percent) of the child offenders serving life without parole are male.[50] This is not surprising considering both the marked differences in violent juvenile crime rates (especially homicide offenses) by gender[51] and that boys are much more likely to be transferred to adult court than girls.[52] Although their total numbers were very small, the girls in the sample were more likely to have been convicted of homicide. Eight percent more female than male youth offenders serving life without parole were convicted of homicide.[53] The actual discrepancy may be even greater, since crime data on 18 percent of the female offenders is not available.
The specter of "super predators" created much of the national furor over youth violence. Politicians and the public thought their communities were (or would be) besieged by vicious teenagers with long records of crime. Yet few of the child offenders sentenced to life without parole fit this super predator profile. Our research suggests that 59 percent of youth offenders received a life without parole sentence for their first-ever criminal conviction of any sort. These youth had neither an adult criminal record nor a juvenile adjudication.[54] The other 39 percent had prior criminal records that ranged from convictions as adults for serious crimes such as robbery, to juvenile offenses such as getting into fights with other teenagers.[55]

Case Study: Stacey T.
Stacey T. was age thirteen in this photo and committed his crime at age fourteen.
© 2005 Private
Stacey T. was about to enter the tenth grade at a Pennsylvania high school, under a magnet program for students who excelled in school, at the time of his crime. He lived at home with his mother, a single parent. When Stacey T. was fourteen years old, he was arrested for the murder of Alexander Porter, a young man who was his girlfriend's brother. Stacey was convicted of second-degree murder (felony murder in Pennsylvania) and sentenced to life without parole. He had no juvenile record, and this crime was his first. Stacey was charged directly in adult court; he never had a juvenile transfer hearing.
Court documents and an interview with Stacey's attorney for this report indicate that Stacey T. agreed to participate with two adults (Henry Daniels, who was Stacey's cousin, and Kevin Pelzer) in a robbery of Alexander Porter, who was assumed to be wealthy, because it was "common knowledge" that his family was involved in drug dealing.[56] The plan involved coercing Porter to give over the keys to his apartment so that the two adults (Daniels and Pelzer) could rob it.
The court's decision in the case of Stacey's cousin establishes that the three perpetrators: "[S]et up a purported drug transaction with Porter, in order to lure him to a meeting, whereupon they bound and gagged him, confiscated his keys, and stuffed him in the trunk of his car. One of the conspirators [Stacey], a 'friend' of Porter's, allowed himself to be tied up in front of Porter. . . . He was 'released' after Porter was locked in the trunk, then taken home so that
Porter would later believe that he had been murdered. The remaining conspirators drove Porter's car, with Porter in the trunk, to the garage of one of the individuals and parked it there."[57]
Stacey explained that Daniels and Pelzer pretended to murder him in order to coerce Porter to give over the keys or face the same fate. In Pelzer's appeal, the court described what Pelzer and Daniels did in the twenty-four hours after Stacey left the scene: "Twice during the next twenty-four hours while Porter was kept in the car trunk, the kidnappers used Porter's car on excursions. . . . First, they used the vehicle to get to Porter's parents' apartment to commit burglaries. . . . [Pelzer] and Daniels went home, slept for a few hours, then took Porter to a park, shot him four times in the neck and back with a .25 caliber handgun, and left him by the roadside where his body was discovered the following day. . . . While Porter was being bound, [Stacey] was led outside, supposedly to be punished, but actually to be released."[58] [According to Pelzer] "[M]e and [Daniels] got into the boy's car, the black shiny one to drive [Stacey] home. I drove the car. We dropped [Stacey] off and returned to my house."[59]
In short, while Stacey T. had agreed to participate in a robbery scheme, he was not present for the murder of Porter, nor was there evidence presented at trial that suggested he knew Daniels and Pelzer were going to murder Porter. Indeed, it would appear that the murder itself was never planned as part of the scheme. Stacey was convicted of second degree murder-Pennsylvania's equivalent of a felony murder conviction in other states, and which has put him behind bars for the rest of his life.
Stacey wrote: "Convinced that I could make some money, I agreed with my cousin to rob this guy of his keys so that [my cousin] and his friend could rob the guy's and his father's apartment. . . . but I had no idea that this guy would end up dead. . . . Yes, I made a mistake. I associated with the wrong crowd. I engaged in committing a crime with them. However, is it fair that I spend the rest of my life in prison for a crime which was committed by someone else without my knowledge or without me being present? I feel sorry for the life which was lost in my case. I feel a deep sense of empathy for his family and what they must continue to endure in terms of pain. But this tragedy was never supposed to happen. I don't absolve myself of all guilt. I, out of naiveness, out of influence, out of the ignorance of knowing the consequences, agreed to do a crime: a robbery."[60]
Historical Trends in Sentencing to Life without Parole
As shown in Figure 3, from 1962 until 1981, an average of two youth offenders in the United States entered prison each year with life without parole sentences. Beginning in 1982, the number began to rise markedly, peaking at 152 youth in 1996. Although the number has declined since 1996, it has never returned to the much lower figures from the 1960s to mid-1980s.
While the absolute number of youth sentenced to life without parole has decreasedsince 1996, the nationwide proportion of youth sentenced to life without parole for murder has increased relative to the total number of youth arrested for or reliably implicated in murders nationwide ("known murder offenders").[61]
Figure 3
Source: Data provided from thirty-eight state correctional departments and additional other sources for the states of Alabama and Virginia.
Human Rights Watch and Amnesty International have compared the number of known murder offenders (including all degrees of murder and felony murder) who were below the age of eighteen for each year from 1980 through 2000, with the number of child offenders who entered prison during those same years with a life without parole sentence. As shown in Table 4, the proportion of youth murder offenders who entered prison with life without parole sentences constituted an ever growing proportion of the number of known youth murder offenders. For example, the percentage going to prison with life without parole in 2000 was three times greater than the percentage in 1990. The data thus suggest an increasing punitiveness toward youth murder offenders.
Table 4: Youth Murder Offenders and Youth Offenders Sentenced to Life without Parole
Year |
Youth Murder Offenders |
Youth Murder Offenders Entering Prison with LWOP |
Percentage of Youth Murder Offenders Entering Prison with LWOP |
1980 |
1,460 |
2 |
0.14% |
1981 |
1,410 |
5 |
0.35% |
1982 |
1,235 |
10 |
0.81% |
1983 |
1,100 |
33 |
3.00% |
1984 |
968 |
20 |
2.07% |
1985 |
1,125 |
32 |
2.84% |
1986 |
1,334 |
32 |
2.40% |
1987 |
1,348 |
32 |
2.37% |
1988 |
1,622 |
59 |
3.64% |
1989 |
1,805 |
50 |
2.77% |
1990 |
2,234 |
64 |
2.86% |
1991 |
2,457 |
66 |
2.69% |
1992 |
2,470 |
84 |
3.40% |
1993 |
2,776 |
73 |
2.63% |
1994 |
2,819 |
116 |
4.11% |
1995 |
2,338 |
118 |
5.05% |
1996 |
2,021 |
152 |
7.52% |
1997 |
1,709 |
143 |
8.37% |
1998 |
1,407 |
124 |
8.81% |
1999 |
1,168 |
133 |
11.39% |
2000 |
1,006 |
91 |
9.05% |
Source: H. Snyder, T. Finnegan, Y. Wan, and W. Kang, "Easy Access to the FBI's Supplementary Homicide Reports: 1980 – 2000," 2002, available online at: http://ojjdp.ncjrs.org/ojstatbb/ezashr/ , accessed on September 14, 2005 (using data from the Federal Bureau of Investigation, Supplementary Homicide Reports 1980-2000 [machine-readable data files]). Data on dates of entry to prison contained in data provided by thirty-eight state correctional departments and additional other sources for the states of Alabama and Virginia.
Comparing the imposition of life without parole sentences on children and adults convicted of murder casts additional light on the increasing punitiveness toward child offenders. As shown in Figure 4, in eleven out of the seventeen years between 1985 and 2001, youth convicted of murder were more likely to enter prison with a life without parole sentence than adult murder offenders.[62] Even when death sentences are included, as shown in Figure 5, in one quarter of the same seventeen years, child murder offenders were more likely to receive either the death penalty or life without parole than adults. In the remaining years, adults were only slightly more likely to enter prison with either life without parole or death sentences (between 1.3 and 0.1 percentage points)-a remarkable finding given that during most of the years studied, large numbers of states had abolished the juvenile death penalty. On its face, this data suggests that states have often been more punitive towards children who commit murder than adults. At the very least, it suggests age has not been much of a mitigating factor in the sentencing of youth convicted of murder.
Figure 4
Source: The data are from the National Corrections Reporting Program, which is sponsored by the Bureau of Justice Stastics. NCRP data downloads are available online at: http://www.icpsr.umich.edu/NACJD/NCRP/, accessed on September 6, 2005.
Figure 5
Source: see Figure 4, above.
State Variation in the Use of Life without Parole
There is wide variation among the states in the number of youth offenders serving life without parole sentences, as shown in Table 5, below.
New Jersey, Utah, and Vermont all have laws allowing life without parole for child offenders, but as of the end of 2003, none of them had any youth offenders serving the sentence. For this report, the federal bureau of prisons reported that they had zero youth offenders serving life without parole. However, we have since located at least one inmate, Jose A., who was fifteen at the time of his crime and is serving life without parole in the federal system.[63]
Table 5: Total Youth Serving Life without Parole by State
State |
Youth LWOP Total |
State |
Youth LWOP Total |
Alabama |
15 |
Montana |
1 |
Arizona |
30 |
Nebraska |
21 |
Arkansas |
46 |
Nevada |
16 |
California |
180 |
New Hampshire |
3 |
Colorado |
46 |
New Jersey |
0 |
Connecticut |
10 |
North Carolina |
44 |
Delaware |
7 |
North Dakota |
1 |
Federal |
1 |
Ohio |
1 |
Florida |
273 |
Oklahoma |
49 |
Georgia |
8 |
Pennsylvania |
332 |
Hawaii |
4 |
Rhode Island |
2 |
Idaho |
data missing |
South Carolina |
26 |
Illinois |
103 |
South Dakota |
9 |
Indiana |
2 |
Tennessee |
4 |
Iowa |
67 |
Utah |
0 |
Louisiana |
317 |
Vermont |
0 |
Maryland |
13 |
Virginia |
48 |
Massachusetts |
60 |
Washington |
23 |
Michigan |
306 |
Wisconsin |
16 |
Minnesota |
2 |
Wyoming |
6 |
Mississippi |
17 |
||
Missouri |
116 |
Nationwide |
2225 |
Source: Data provided by thirty-eight state correctional departments and additional other sources for the states of Alabama and Virginia.
In Figure 6, below, we present the rates at which states impose the sentence relative to state youth populations. The range in the rates is extraordinary: Virginia has the highest rate, 132.90 per 100,000 youth age fourteen to seventeen, a rate that is 886 times larger than Ohio's lowest rate of 0.15. The national rate is 14.20.
Figure 6
Source: Data provided by thirty-eight state correctional departments and additional other sources for the states of Alabama and Virginia. Population data were obtained from Population Division, U.S. Census Bureau, "Table 2: Annual Estimates of the Population: April 1, 2000 to July 1, 2003," released in September 2004, available online at: http://www.census.gov/popest/states/asrh/SC-EST2003-02.html, accessed on September 6, 2005.
The differences in the state rates of life without parole for youth do not correlate directly to differences in rates of violent crime by youth. As shown in Figure 7, there are states with high rates of youth violence but low rates of youth with life without parole sentencing such as Delaware, Illinois, and Maryland; and there are states with the reverse: high rates of youth with the sentence and lower rates of youth crime, such as Virginia, Pennsylvania, and Michigan. Virginia's rate of youth crime is 34 percent lower than Ohio's crime rate, yet, as noted above, Virginia uses life without parole sentences for youth at a rate that is 866 times greater than Ohio's. Missouri, on the other hand, has both relatively high rates of youth crime and high rates of sentencing youth to life without parole.
Figure 7
Source: sentencing rate data provided by thirty-eight state correctional departments and additional other sources for the states of Alabama and Virginia. Arrest rate data from Federal Bureau of Investigation (FBI), "Crime in the United States, 1997," Uniform Crime Reports (UCR), available online at: http://www.fbi.gov/ucr/97cius.htm, accessed on September 14, 2005. Population data from the Bureau of Census, "Estimates of the population of states: 1997". Although many states had crime index data available for subsequent years, the data from 1997 provided rates for the largest number of states, with reporting coverage ranging from 33 to 100 percent of counties. No 1997 data were available for Florida, New Hampshire, and Vermont.
State criminal justice policies and practices clearly play a large role in the different rates of life without parole sentences for youth. One of those policy choices is that of making life without parole a mandatory sentence for certain crimes, regardless of whether it is committed by an adult or a youth. As shown in Table 6, the eight states with the highest rates of sentencing youth to life without parole all make the sentence mandatory upon conviction for certain crimes. The five states with the lowest rates of sentencing youth to life without parole (other than those that do not impose the sentence on youth at all) make the sentence discretionary. In these states, in which the judge retains the ability to weigh individual characteristics of defendants, the much lower rates of sentencing suggests judges' assessments that life without parole is not an appropriate sentence for youth offenders.
Table 6: Mandatory or Discretionary Life without Parole by State
State |
Mandatory LWOP |
Rate* of Youth LWOP |
State |
Mandatory LWOP |
Rate* of Youth LWOP |
Virginia |
Mandatory Death (16 +) or LWOP |
13.29 |
California |
Discretionary |
0.92 |
Louisiana |
Mandatory Death (16 +) or LWOP |
10.96 |
Washington |
Mandatory LWOP |
0.66 |
Michigan |
Mandatory LWOP |
5.29 |
Hawaii |
Discretionary |
0.61 |
Pennsylvania |
Mandatory Death (16 +) or life sentence (no parole for life sentence) |
4.93 |
Alabama |
Mandatory LWOP |
0.59 |
Iowa |
Mandatory LWOP |
3.82 |
Connecticut |
Mandatory LWOP |
0.56 |
Missouri |
Mandatory LWOP |
3.51 |
Wisconsin |
Mandatory LWOP |
0.49 |
Florida |
Mandatory Death (16 +) or LWOP |
3.33 |
Maryland |
Mandatory LWOP |
0.44 |
Arkansas |
Mandatory LWOP |
2.92 |
New Hampshire |
Mandatory LWOP |
0.43 |
Oklahoma |
Discretionary |
2.32 |
Rhode Island |
Mandatory LWOP |
0.37 |
Nebraska |
Mandatory LWOP |
1.96 |
North Dakota |
Discretionary |
0.24 |
Colorado |
Mandatory LWOP |
1.87 |
Georgia |
Mandatory Death (16 +) or LWOP |
0.17 |
Massachusetts |
Mandatory LWOP |
1.85 |
Montana |
Discretionary |
0.17 |
South Dakota |
Mandatory LWOP |
1.80 |
Tennessee |
Discretionary |
0.13 |
Wyoming |
Discretionary |
1.79 |
Minnesota |
Mandatory LWOP |
0.07 |
Delaware |
Mandatory LWOP |
1.63 |
Indiana |
Discretionary |
0.06 |
Nevada |
Discretionary |
1.53 |
Ohio |
Discretionary |
0.02 |
Illinois |
Mandatory LWOP |
1.45 |
New Jersey |
Discretionary |
0.00 |
South Carolina |
Mandatory Death (16 +) or LWOP if prosecutor specifically requests either |
1.15 |
Utah |
Discretionary |
0.00 |
North Carolina |
Mandatory LWOP |
1.06 |
Vermont |
Discretionary |
0.00 |
Arizona |
Mandatory Death (16 +) or LWOP |
1.03 |
Idaho |
Mandatory Death (16 +) or "fixed life sentence" |
no data |
Mississippi |
Discretionary |
0.95 |
*Rate per every 10,000 youth aged 14-17 in state population as of the 2000 Census.
Source: Sentencing statutes of forty-one states. For state totals, data provided by thirty-eight state correctional departments and additional other sources for the states of Alabama and Virginia.
Race
No examination of criminal justice in the United States is complete without a discussion of race. Therefore, we collected data on the total number of youth offenders in each racial group serving life without parole. Our data reveal that blacks constitute 60 percent of the youth offenders serving life without parole nationwide and whites constitute 29 percent.[64] In addition, the data show that black youth nationwide are serving life without parole sentences at a rate that is ten times higher than white youth (the rate for black youth is 6.6 as compared with .6 for white youth). Neither the data we compiled nor other available sources answer the key question: are children from racial minorities sentenced to life without parole more frequently than white children convicted of similar crimes and with similar criminal histories?[65]
As with the national totals given above, the percentage of minority youth serving life without parole are often very different from the percentage of white youth serving the sentence in a particular state. Again, while the differences are dramatic, we do not know the crime rates, criminal histories, or other race-neutral factors that would allow us to draw conclusions about racial disparities in the sentencing policies of states. However, research studies have found that minority youths receive harsher treatment than similarly situated white youths at every stage of the criminal justice system, from the point of arrest to sentencing.[66] For example, Amnesty International's research indicates that one reason for the over-representation of black and other minority children in the criminal justice system is racial discrimination by law enforcement and justice authorities.[67] In addition, in a study of youth in Florida's juvenile justice system researchers found:
[W]hen juvenile offenders were alike in terms of age, gender, seriousness of the offense which promoted the current referral, and seriousness of their prior records, the probability of receiving the harshest disposition available at each of several processing stages was higher for minority youth than for white youth.[68]
Table 7 presents, by state, the racially disaggregated rates of youth sentenced to life without parole per 10,000 youth aged fourteen through seventeen.[69]
Table 7: Rate of Youth Offenders Serving Life without Parole by Race and State
State |
Youth LWOP Rate* |
White LWOP Rate |
Black LWOP Rate |
Hispanic LWOP Rate |
Black / White Ratio |
Alabama |
0.6 |
0.2 |
1.3 |
0.0 |
5.6 |
Arizona |
1.0 |
0.3 |
5.2 |
1.4 |
18.1 |
Arkansas |
2.9 |
1.2 |
9.5 |
0.0 |
7.6 |
California |
0.9 |
0.2 |
4.4 |
0.9 |
22.5 |
Colorado |
1.9 |
0.6 |
10.7 |
2.7 |
16.7 |
Connecticut |
0.6 |
0.1 |
2.6 |
0.9 |
19.6 |
Delaware |
1.6 |
0.3 |
5.7 |
0.0 |
17.5 |
Florida |
3.3 |
1.4 |
9.8 |
0.6 |
6.9 |
Georgia |
0.2 |
0.1 |
0.4 |
0.0 |
5.4 |
Hawaii |
0.6 |
n/a |
n/a |
n/a |
n/a |
Idaho |
no data |
n/a |
n/a |
n/a |
n/a |
Illinois |
1.4 |
0.4 |
5.7 |
0.9 |
15.7 |
Indiana |
0.1 |
0.1 |
0.0 |
0.0 |
n/a |
Iowa |
3.8 |
2.4 |
40.6 |
12.2 |
16.8 |
Louisiana |
11.0 |
4.2 |
21.7 |
0.0 |
5.2 |
Maryland |
0.4 |
0.1 |
1.2 |
0.0 |
10.6 |
Massachusetts |
1.8 |
0.9 |
8.8 |
2.6 |
9.7 |
Michigan |
5.3 |
1.9 |
23.1 |
2.6 |
12.4 |
Minnesota |
0.1 |
0.04 |
0.0 |
0.0 |
n/a |
Mississippi |
0.9 |
0.7 |
1.3 |
0.0 |
1.7 |
Missouri |
3.5 |
1.8 |
14.5 |
0.0 |
7.9 |
Montana |
0.2 |
0.0 |
0.0 |
6.1 |
n/a |
Nebraska |
2.0 |
1.0 |
18.6 |
0.0 |
18.1 |
Nevada |
1.5 |
1.1 |
4.6 |
0.8 |
4.3 |
New Hampshire |
0.4 |
0.3 |
0.0 |
6.8 |
0.0 |
New Jersey |
0.0 |
0.0 |
0.0 |
0.0 |
0.0 |
North Carolina |
1.1 |
0.2 |
3.0 |
0.0 |
14.6 |
North Dakota |
0.2 |
0.0 |
0.0 |
16.6 |
n/a |
Ohio |
0.0 |
0.0 |
0.1 |
0.0 |
n/a |
Oklahoma |
2.3 |
1.2 |
12.6 |
2.1 |
10.3 |
Pennsylvania |
4.9 |
1.3 |
26.4 |
13.2 |
20.9 |
Rhode Island |
0.4 |
0.0 |
2.4 |
1.6 |
n/a |
South Carolina |
1.2 |
0.6 |
1.9 |
0.0 |
3.2 |
South Dakota |
1.8 |
1.4 |
0.0 |
0.0 |
n/a |
Tennessee |
0.1 |
0.1 |
0.3 |
0.0 |
3.8 |
Utah |
0.0 |
0.0 |
0.0 |
0.0 |
0.0 |
Vermont |
0.0 |
0.0 |
0.0 |
0.0 |
0.0 |
Virginia |
13.3 |
n/a |
n/a |
n/a |
n/a |
Washington |
0.7 |
0.5 |
3.0 |
0.0 |
5.7 |
Wisconsin |
0.5 |
0.2 |
3.7 |
0.0 |
17.6 |
Wyoming |
1.8 |
0.9 |
0.0 |
8.0 |
n/a |
Nat'l Average |
1.8 |
0.6 |
6.6 |
1.1 |
10.3 |
*Rate per every 10,000 youth aged fourteen to seventeen in state population as of the 2000 Census
Source: Data provided by thirty-eight state correctional departments and additional other sources for the states of Alabama and Virginia. Population data were obtained from the U.S. Census Bureau, State Population Data Sets, available online at: http://www.census.gov/popest/states/asrh/files/SC-EST2003-race6-AL_MO.csv and http://www.census.gov/popest/states/asrh/files/SC-EST2003-race6-MT_WY.csv, accessed on March 4, 2005. Calculations are based on Census 2000 data.
In every single state, the rate for black youth sentenced to life without parole exceeds that of white youth. The highest black rate in an individual state-40.5 (in Iowa)-is just under nine times greater than the highest white rate of 4.2 (in Louisiana). The highest Hispanic rate of 16.6 (in North Dakota) is 3.6 times greater than Louisiana's rate for whites.
Table 7 also indicates that there is a sizeable spread between the highest and lowest rates within racial groups, but the differential for black youth is by far the greatest. For black youth, the life without parole rates range from 40.6 in Iowa to .3 in Tennessee. For Hispanics, the highest rate is 16.6 in North Dakota, and the lowest is .6 in Florida. Finally, for white youth, the range is much smaller, from 4.2 in Louisiana to .04 in Minnesota.
In Figure 8, we have ordered the states according to the size of the ratio of their black rates of youth offenders sentenced to life without parole compared to white rates.
Figure 8
Source: See Table 7, above.
The highest black/white ratio is that of California: black youth in that state are 22.5 times more likely to be serving a sentence of life without parole than white youth. Mississippi's black to white ratio is the lowest in the nation-blacks are only 1.7 times more likely to be serving the sentence than whites. Our inability to draw conclusions about racial disparities in sentencing from this data highlights the need for states, the federal government, and independent experts to compile disaggregated data on this issue.
Case Study: Emily F.
Emily F. was age fourteen in this photo and age fifteen when she committed her crime.
© 2005 Private.
Emily F. was reportedly violently raped when she was twelve years old. She was placed by her mother in a group home in Iowa, where she was treated for depression. Emily, who committed her crime in 1994 when she was fifteen years old, believes her crime is linked to her use of Prozac, a medication that is used to
treat depression "by increasing the amount of serotonin, a natural substance in the brain that helps maintain mental balance."[70]
According to Emily, she told her doctor three times prior to her crime that she was having violent hallucinations that she feared were triggered by the Prozac. Emily's mother also told the doctor that she herself had to be taken off of Prozac because of negative side effects.[71] Five days after that meeting, Emily was arrested for murdering her aunt, a woman that she "had no reason to harm and had spent every summer and most weekends with since [she] was three years old."[72]
At Emily's trial, contradictory evidence was introduced about whether her crime was premeditated or an impulsive reaction to her medication. One resident of the group home alleged that Emily told her of a plan to kill her aunt and
to take her money, and mentioned this plan several times in the days and hours leading up to the crime. This same resident "noticed defendant appeared more and more volatile and upset" near to the day of the crime.[73]
However, Emily's psychiatrist testified that she "did not know the difference between right and wrong and was incapable of understanding the nature of her acts on October 25 because she was in a psychotic state."[74]He stated that just prior to the murder, Emily "experienced an 'affective storm' which totally overwhelmed all other operations of her brain, leaving her in a dangerous limbic psychotic state before murdering [her aunt]."[75] However, the state's psychiatrist, Dr. Taylor, disputed any claim of insanity and "noted the various medications defendant was then receiving, including Prozac, would not have had any adverse consequences for her."[76]Dr. Taylor also noted that the defendant was receiving Thorazine at the time of the murder, which he said had the effect of making one less inclined to be aggressive.
V. The Difference between Youth and Adults
It is axiomatic that children are in the process of growing up, both physically and mentally. Their forming identities make young offenders excellent candidates for rehabilitation-they are far more able than adults to learn new skills, find new values, and re-embark on a better, law-abiding life. Justice is best served when these rehabilitative principles, at the core of human rights standards, are at the heart of any punishments imposed on child offenders. Sentences must take into account both the gravity of the crime as well as the culpability or blameworthiness of the offender. The question of culpability is what separates children from adults. While children can commit acts as violent and deadly as those adults commit, their blameworthiness is different by virtue of their immaturity. Their punishment should acknowledge that substantial difference.
Children may know right from wrong: proponents of adult sentences for children correctly point out that most children, even a six-year-old, can parrot the phrase that it is "wrong" to kill, albeit often without any real understanding of what killing means or why it is wrong. But by virtue of their immaturity, children have less developed capacities than adults to control their impulses, to use reason to guide their behavior, and to think about the consequences of their conduct. They are, in short, still "growing up." A sentence of life without parole negates that reality, treating child offenders as though their characters are already irrevocably set.
The Difference According to Psychology
Psychological research confirms what every parent knows: children, including teenagers, act more irrationally and immaturely than adults. According to many psychologists, adolescents are less able than adults to perceive and understand the long-term consequences of their acts, to think autonomously instead of bending to peer pressure or the influence of older friends and acquaintances, and to control their emotions and act rationally instead of impulsively. All of these tendencies affect a child's ability to make reasoned decisions.
Psychologists have long attributed the differences between adults and children to either cognitive or psychosocial differences. Cognitive theories suggest that children simply think differently than adults, while psychosocial explanations propose that children lack social and emotional capabilities that are better developed in adults.[77]
Research has established that adolescent thinking is present-oriented and tends to either ignore or discount future outcomes and implications.[78] At least one researcher has found that teenagers typically have a very short time-horizon, looking only a few days into the future when making decisions.[79] Another study concluded that only 25 percent of tenth graders (whose average age is sixteen), compared to 42 percent of twelfth graders (whose average age is eighteen), considered the long-term consequences of important decisions.[80] To the extent that adolescents do consider the implications of their acts, they emphasize short-term consequences, perceiving and weighing longer-term consequences to a lesser degree.[81]
Psychological research also consistently demonstrates that children have a greater tendency than adults to make decisions based on emotions, such as anger or fear, rather than logic and reason.[82] Studies further confirm that stressful situations only heighten the risk that emotion, rather than rational thought, will guide the choices children
make.[83] In the most emotionally taxing circumstances, children are less able to use whatever high-level reasoning skills they may possess, meaning that even mature young people will often revert to more child-like and impulsive decision-making processes under extreme pressure.[84]

Gregory C., who was fifteen when he shot and killed a police officer who had pulled him over for speeding in a stolen car, described his state of mind at the time:
A kid just does something-whether it's an accident or intentional. I mean personally, me, I was fifteen years old . . . I didn't know what I was doing. I was still a kid. . . . Kids do a lot of stupid things . . . The person I was when I was fifteen, I really didn't have any morals, I didn't even know who I was at that time. I hate to admit it, but I was real ignorant.[85]

The Difference According to Neuroscience
Neuroscientists using magnetic resonance imaging (MRI) to study the brain are now providing a physiological explanation for the features of adolescence that developmental psychologists-as well as parents and teachers-have identified for years.[86] These MRI studies reveal that children have physiologically less-developed means of controlling themselves.
Neuroscientists have produced MRI images of the anatomy and function of the brain at different ages and while an individual performs a range of tasks.[87] They have uncovered striking differences between the brains of adolescents and those of adults. Much of this scientific research into the biological distinctions between adults and children reveals that these differences occur along an age continuum-they do not magically disappear at a given age-and the rate at which the adolescent brain acquires adult capabilities differs from individual to individual. Nevertheless, researchers have identified broad patterns of change in adolescents that begin with puberty and continue into young adulthood.
A key difference between adolescent and adult brains concerns the frontal lobe. The frontal lobe of teenagers is composed of different quantities and types of cell matter and has different neural features than the adult brain. Researchers have linked the frontal lobe (especially a part of the frontal lobe called the prefrontal cortex) to "regulating aggression, long-range planning, mental flexibility, abstract thinking, the capacity to hold in mind related pieces of information, and perhaps moral judgment."[88] In children, the frontal lobe has not developed sufficiently to perform these functions. Throughout puberty, the frontal lobe undergoes substantial transformations that increase the individual's ability to undertake decision-making that projects into the future and to weigh rationally the consequences of a particular course of action.[89]
These cell and neural developments in the brain provide an anatomical basis for concluding that youth up to age eighteen are, on average, less responsible for criminal acts than adults. As Daniel Weinberger, director of the Clinical Brain Disorders Laboratory at the National Institutes of Health explains, the developed frontal lobe, including its prefrontal cortex, "allows us to act on the basis of reason. It can preclude an overwhelming tendency for action. . . . It also allows us to consciously control our tendency to have impulsive behavior."[90]
Addressing youth violence, Weinberger explains:
I doubt that most school shooters intended to kill, in the adult sense of permanently ending a life and paying the consequences for the rest of their lives. Such intention would require a mature prefrontal cortex, which could anticipate the future and rationally appreciate cause and effect . . . The [juvenile] brain does not have the biological machinery to inhibit impulses in the service of long-term planning.[91]
In addition, because their frontal lobe functions poorly, adolescents tend to use a part of the brain called the amygdala during their decision-making.[92] The amygdala is a locus for impulsive and aggressive behavior, and its dominance over the undeveloped frontal lobe makes adolescents "more prone to react with gut instincts."[93] In adult brains, the frontal lobe offers a check on the emotions and impulses originating from the amygdala.[94] Reflecting on the dominance of the amygdala, Deborah Yurgelun-Todd of the Harvard Medical School concluded:
[A]dolescents are more prone to react with gut instinct when they process emotions but as they mature into early adulthood, they are able to temper their instinctive gut reaction response with rational, reasoned responses . . . Adult brains use the frontal lobe to rationalize or apply brakes to emotional responses. Adolescent brains are just beginning to develop that ability.[95]

Case Study: Alexis V.
Alexis V. was age fourteen both in this photo and when she committed her crime.
© 2005 Private.
Alexis V., a woman of mixed race imprisoned in Iowa, committed her crime when she was fourteen years old. She wrote: "My mother had me when she was eighteen years old, my grandparents didn't like me because I was black. I was an abused child. . . . I was abused
physically and emotionally. My parents were both alcoholics. It was very hard for me growing up."[96]
When her mother was interviewed for this report, she said that Alexis was: "[O]ne of those kids that always had to have attention. She was diagnosed with ADHD [attention-deficit / hyperactivity disorder]. But up until sixth grade she was an honor roll student. . . . I was drinking a lot at the time and I was in the streets quite a bit. She was one of those kids that wanted to do the piano lessons and baseball and all that-but we didn't have the money. I drank up all the money . . . Well, she figured out a way to get those lessons. She told the teacher, "If I kept your car up could you give me lessons for free?"[97]
Alexis explained that she decided to "run away because I was getting beat by my mom and social services got involved but they didn't do anything." From the age of twelve, she lived in "shelters, foster homes, detention, and group homes." A researcher for this report interviewed Mike Dryden, who was Alexis' residential youth counselor in the first group home she lived in. Dryden said that he and his wife found Alexis to be:
"Intelligent, extremely intelligent. She was very outgoing, strong personality, pleasant to be around. Now, there was an anger and a temper there that was just below the surface . . . But I would never have believed that she would take someone's life. When one of the other counselors told me what happened . . . it was absolute shock, my first thought was that she was picked up for someone else's crime. I could maybe see her breaking into a house and taking credit cards, when she was on the run and scared. But hurting someone else? Never. A few months before it happened, when she graduated from Forest Ridge, my wife and I took her out special to Pizza Hut. I remember I let her take my two-year-old daughter Danielle to use the bathroom alone. That was how much I trusted [Alexis]. I still
trust her; my wife and I say that if she ever gets out of prison she can come and live with us for a while until she gets her feet on the ground."[98]
Alexis's behavior worsened between the ages of twelve and fourteen. The prosecutor in Alexis's case recalled that she had delinquency charges during this period.[99]
Alexis's mother described the change in her daughter's behavior after she turned twelve in the following way: "[S]he just changed. She stopped going to school. . . . She would get into fights, she was defiant, she had violent episodes. But then again, now I've got an eight-year-old and a sixteen-year-old, and they both have violent episodes. They call getting angry and yelling and all that violent, so I get violent too."[100]
Alexis wrote, "I ran away from the last group home I was in when I was fourteen and that's when all this trouble happened."[101]Court documents indicate that after running away, Alexis entered the home of a woman under the pretense of needing to use the phone, and she was later found to have taken and used the woman's car and credit cards. The sixty-six-year-old woman was found dead from multiple stab wounds. Other physical evidence, such as bloodstains and fingerprints, linked Alexis to the crime.[102]Both Alexis and her mother maintain that there were other individuals involved in the crime, but no one else was ever charged. Her mother says that the victim in the crime "was a very well known librarian in that town. She sounds like she was just a wonderful woman."[103]
Alexis was transferred from juvenile court in order to stand trial as an adult in Iowa. At the conclusion of her trial, she was sentenced to life without parole for first degree murder. Today, Alexis's mother says, "[Alexis] is a mature adult now. My daughter–it's like she sacrificed herself to wake me up. . . . Well I lost her. She gets jealous when she hears about what I do now with the other kids, but she's happy for them too."[104]
VI. Life without Parole in Adult Prison
"Doing time" is difficult for any prisoner. Prisons are tense, cheerless, and often degrading places in which all inmates struggle to maintain their equilibrium despite violence, exploitation, lack of privacy, stringent limitations on family and community contacts, and a paucity of opportunities for meaningful education, work, or other productive activities.
But "doing time" is particularly challenging for those who come to prison as adolescents or very young adults. They often lack the physical and mental coping mechanisms that older adult prisoners use to maintain their mental health and self-respect. Not only are teens ill-equipped to handle prison, it is also an unlikely place for them to gain the life experiences and education necessary for healthy mental and physical development. Penitentiaries in the United States are not designed to further rehabilitation, and youth offenders sentenced to life without parole are often barred from participating in the few programs that do exist. And youth offenders serving life without parole face an additional and daunting challenge-they must come to terms with the fact that they will live in prison for the rest of their lives.
We have data on age at admission for 420 of the 2,225 youth offenders currently serving life without parole in the United States. As illustrated in Table 8, the average age at admission to prison was eighteen years old; the youngest entered prison at age fourteen and the oldest was twenty-six years old. Nevertheless, 29 percent, or just under one-third of all the offenders studied, were admitted to adult penitentiaries while they were still children.[105]
Table 8
Age at Admission |
Number of Offenders |
14.00-14.99 years |
1 |
15.00-15.99 years |
5 |
16.00-16.99 years |
31 |
17.00-17.99 years |
86 |
18.00-18.99 years |
138 |
19.00-19.99 years |
111 |
Age at Admission |
Number of Offenders |
20.00-20.99 years |
31 |
21.00-21.99 years |
7 |
22.00-22.99 years |
7 |
23.00-23.99 years |
1 |
24.00-24.99 years |
0 |
25.00-25.99 years |
1 |
26.00-26.99 years |
1 |
Total: |
420 child offenders |
Source: Data provided by thirty-eight state correctional departments and additional other sources for the states of Alabama and Virginia.
Adjusting to Life in Adult Prison
No one, offenders included, expects prison to be a pleasant place. Upon incarceration, all inmates must face the taxing psychological and physical challenge of adjusting to prison, and some fail or just barely pass the test. Prisoners soon learn that their psychological and physical survival depends on emotional control, heightened guardedness, resistance to or modeling of violence and aggression, and an ability to negotiate the deceptive behaviors of others.[106] As one youth offender said, "[M]y life in prison has been like living in hell. It's like living and dying at the same time, and with my sentence the misery never ends. Life in prison is no life at all. It is a mere existence."[107]
There is a considerable incongruity between the physical or mental immaturity of young prisoners and the kinds of experiences and people prison forces them to confront. Starting in the 1960s, sociologists and psychologists found that the negative psychological effects of imprisonment increase as incarceration continues, but begin to reverse as prisoners near the time of release.[108] Offenders serving life without parole know that they will never leave prison, meaning that for some, the negative effects of imprisonment can be expected to increase and indeed, may never lessen.
Youth offenders interviewed and corresponded with for this report recalled experiencing a wide range of emotions while adjusting to prison. They reported initial feelings of fear, anger, loneliness, or hopelessness. Some youth offenders contemplated or even attempted suicide. Those who had been in prison for ten years or less were still in the midst of the adjustment process.
The Reality of the Sentence
Once in prison, child offenders must come to grips with the reality of a life-long prison sentence. For example, Jacob O., who was seventeen at the time of his offense of aggravated first degree murder, explained his understanding of his sentence, "In all reality it was not until about the age of twenty-two that I truly understood [the sentence]. I did not know that this would mean that my whole life was going to be gone. If I would have known at the time what it all meant I would have tried to take the plea."[109]
When he was interviewed for this report, Thomas M. said about his trial:
[It] was very emotional and I broke out crying in court. I don't know if I fully understood but I kinda understood when they just said, "guilty, guilty, guilty" and "life" y' know? As time went on, I'm really starting to realize how serious it is. I was young, I wasn't really too educated. When I got locked up, I was in the eighth grade. All my education has come through the years of being incarcerated.[110]
Matthew C. told a researcher for this report:
I don't think it really sunk in until I'd been in prison for a while and had some time to look over my case and then I realized, "man they're trying to keep me here." You know what I mean? It kinda sunk in.[111]
Case Study: Dean F.
Dean F. was fifteen years old at the time of his crime. He comes from a financially secure family and was living at home in Missouri with his mother and brother. He is incarcerated in Iowa, because his crime occurred in that state. He had prior juvenile charges of property damage, truancy, and felony tampering for stealing a car, and he had been held back in school for one year.[112]
At the time of his interview for this report, Dean said he spent most of his time reading history, philosophy, and law in his cell. When asked about his life when he was fifteen, he explained, "I lived with my mom, my parents are divorced and my dad is a university professor in Texas. I was a normal teenager. I had skipped school some and stole a car once before, but nothing violent. Never anything violent."[113]
At the time of the crime, he said: "[I and] three friends decided to run away from home. We decided to take a car and I brought along a hunting gun. We crossed into Iowa and then we started having car trouble. Eventually, we decided we should try to steal another car so we could keep going, and so we pulled over a lady [using flashing lights that Dean's friend's father-a postal worker-had on top of his car] and we were going to ask her to give us her car and scare her using the gun. Everything went O.K., but then it looked like she wasn't going to give us her car, so I walked back to our car. I wasn't even there when my friend started freaking out and shot her and then stabbed her over and over."
The victim, a thirty-two-year-old woman, had been shot once in the face and stabbed thirty-three times while sitting in her car. Press accounts of Dean's co-defendants' trials explained that evidence was introduced placing two twin brothers (Derek S. and Burt S.) at the car. Derek was alleged to have grabbed the gun from his brother Burt, who had shot the victim. Burt then stabbed her repeatedly with a knife.[114] Burt ultimately confessed to shooting and stabbing the victim.[115]
At Dean's trial, the prosecutor emphasized the fact that the gun used in the killing was Dean's, and he also introduced testimony that Dean instructed Burt to shoot the driver of the car, a claim that Dean denied when he was interviewed for this report.[116]
Some of the statements made by Dean and his codefendants during police questioning prior to their arrests were suppressed by the trial court, and the state filed an interlocutory appeal. In reversing the trial court's decision to
suppress the boys' statements, the state appeals court examined the trial record and summarized the evidence relating to Dean's role in the crime:
"[Dean] knowingly participated in the robbery by driving the Blazer and chasing down [the victim]. The jury heard testimony all four defendants knew about the gun which belonged to [Dean]. All four knew it was loaded and it would be used to threaten the person they stopped. Under this theory, if the jury believed [Dean] did not know a murder would occur, the killing is the different crime. The stabbing and shooting occurred because [the victim] did not cooperate with her attackers. This was in furtherance of the robbery, the offense in which [Dean] knowingly participated. A murder is a reasonably foreseeable crime when using a gun to threaten robbery victims. The defendants actually used the gun, and when that was insufficient to carry out the plan, Burt S. stabbed [the victim] to death. We find these facts are sufficient to support the jury's verdict under the theory of joint criminal conduct."[117]
Dean's co-defendant, Burt S., was ultimately convicted for the crime of first degree murder. Dean was convicted for "aiding and abetting" first degree murder and sentenced to life without parole.
The prosecutor in Dean's case conceded at trial that Dean was not standing near the car when the brutal murder took place.[118] In a subsequent interview for this report, a researcher asked the prosecutor why he sought a life without parole sentence for Dean, who was so young and who was clearly not the "triggerman." The prosecutor said unequivocally that he remains convinced that life without parole was the correct sentence for Dean.[119]
Fear and Anger
In Iowa, a former inmate, who spent six years in prison with a young woman serving life without parole, recalled that when her friend first came to prison at age seventeen: "She had such an anger problem. You just wonder where someone's boiling point is, you know?"[120]
Fear and anger can often lead to violent, disruptive behavior among inmates. In a study of children serving a variety of sentences in adult prisons throughout the United States, the U.S. Department of Justice found that correctional staff characterized youthful offenders as "more volatile and more difficult to deal with" than adults.[121] Of course, young inmates often use violence to protect themselves from harm as much as they use violence to express their anger. Whatever their motivations, offenders may attack other inmates or guards. A male offender, who was fourteen at the time of his crime and fifteen when he entered prison, told a researcher for this report about his feelings and violent behavior:
Even when I went to [prison] I was telling everybody, "I don't need, I don't want nobody." [Friends and family] were just writing to me and I said, "Don't write me. Don't . . . I might never get outta prison. If I do, I don't know when it's gonna be." I didn't wanna deal with nobody. My mentality was just bad, you know?
Because you know I couldn't deal with it, I couldn't deal with doing all that time, having that time, being so young, I couldn't deal with it. And it caused me a lotta problems when I first came to the penitentiary because I had the mentality, "I have a life sentence. I don't care about nothing, I got a life sentence, why should I care about anything?" So there wasn't nothing I wouldn't do. Wasn't no fight I would back down from. Even with the officers . . . so that caused a lot of problems. [I] fought on officers, [I was] stabbing officers with knives . . . You know, fought on inmates, 'cause of that mentality, 'cause of having that time . . . I haven't [killed] but I've beat on inmates. . . . Yeah, I used locks, knives, pipes, lead pipes, you know?[122]
When he was interviewed for this report, a treatment director at Mitchellville prison in Iowa said that teenagers with life without parole sentences "tend to go through the grief cycle twice."[123] He continued:
The first time it has to do with the simple fact of entering adult prison, so they pass through shock, anger, depression, and then acceptance. But for the lifers, they go through all four stages again-often several years later or whenever the reality of their sentence finally sinks in. . . . The child offenders [with life sentences] are used to acting out and getting kicked out of programs. We have to discipline them often when they first arrive.[124]
Since youth offenders tend to be more unruly and violent than older inmates, they are often placed in long-term isolation or super-maximum security confinement, which correctional officials across the country use to punish and minimize disruptive behavior. In Colorado alone, out of twenty-four child offenders serving life without parole who were interviewed or corresponded with for this report, thirteen inmates, or just over 50 percent, had spent time in Colorado's supermaximum prison, Colorado State Penitentiary (CSP). Dennis Burbank, an administrative officer at CSP, offered an explanation for why youth offenders serving life without parole often end up confined in long-term isolation:
One [factor] is age-when you come in at a young age with life without, there's not a whole lot of light at the end of the tunnel. Also, it's kind of a guy thing: the young ones come in with a lot of fear, anxiety, paranoia, and they want to make a name for themselves-so they have a tendency to act out. And if they are part of a gang, they are almost required to act out . . . any of the young guys, they see it as a feather in their cap to work themselves to CSP . . . and they don't think about the repercussions. . . .They say [to themselves] "I've got to impress everyone with what a bad-ass I am."[125]
Jackson W., who entered prison at age seventeen, told a researcher for this report that his violent defensive behavior in prison had landed him in long-term isolation in Arkansas:

If you are over here, you are with people who doing two years. And if you have life, they don't want me doing nothing to the person with two years, so they keep me confined [in isolation] until I show a certain type of mentality. And I don't got that mentality. My mentality is . . . I refuse to walk around with a cane, or with my eye knocked out, or my teeth knocked out … by not protecting [my]self.[126]

Membership in a "security threat group" (prison gang) is also a cause for transfer to isolation in many states.[127] Ethan W. committed his crime at age seventeen and entered prison at age nineteen. He explained to a researcher for this report:
You got me in a place where I'm surrounded by nothing but gangs, so the only way not to be a victim of one of those gangs is to join them. But when you become a member, you're a part of a security threat group, so now they say "we're gonna keep you in a room alone for the rest of your life."[128]
Life in long-term isolation usually involves segregating inmates for twenty-three or more hours a day in their cells. Offenders contacted for this report described the devastating loneliness of spending their days alone, without any human contact, except for when a guard passes them a food tray through a slot in the door, or when guards touch their wrists when handcuffing them through the same slot, before taking them to the exercise room or for a shower once a week.
Human Rights Watch and Amnesty International have systematically documented and advocated against the human rights violations inherent in the incarceration of individuals in super-maximum security prisons throughout the United States.[129] Prolonged periods of isolation can be devastating for anyone, but especially for young offenders.[130] Few of the offenders contacted for this report entered super maximum security isolation while they were still children; however, long periods in isolation raise human rights concerns for all prisoners, irrespective of age. According to the U.N. Human Rights Committee, the international body that monitors compliance with the International Covenant on Civil and Political Rights, "prolonged solitary confinement of the detained or imprisoned person may amount to" torture or other cruel, inhuman, or degrading punishment.[131] Moreover, the European Committee for the Prevention of Torture and Inhuman or Degrading Treatment or Punishment, an expert prison-monitoring body elected by the Committee of Ministers of the Council of Europe, "pays particular attention to prisoners held, for whatever reason . . . under conditions akin to solitary confinement."[132]
Long-term isolation can have lasting negative effects on inmates. Troy L. came to prison at age sixteen after committing first degree murder at the age of fifteen. He spent "something like 300 days in an isolation cell" when he was awaiting trial and had been transferred to isolation several times since for "different reasons."[133] Troy said he had spent so much time in isolation that he was unable to feel comfortable relating to and living around other people, especially now that he was housed in the general population barracks:
If you just see what these barracks are like, they got us piled in there like some cockroaches. And I've spent so much time over the years . . . in just cells and lockdown for different reasons. And it's hard for me to deal with just having so many people around. So much-I can't think-you know what I mean?[134]
Isolation, Loneliness, and Hopelessness
Everyone in prison experiences isolation and loneliness. It is a direct function of being cut off from family, friends, and the rest of society. One young man who came to prison at age fifteen, and who is now twenty years old, wrote: "Every day I grow inside. But I have no room to grow in here . . . It's lonely. Your surrounded by 1,500 people and it's still so lonely."[135]
However, psychologists suggest that some prisoners, "especially those serving very long sentences [use] withdrawal and self-imposed isolation . . . as a defensive reaction to the anticipated loss of . . . outside social support."[136] Using isolation as a defense takes its toll on prisoners who may experience "protracted depression, apathy and the development of a profound sense of hopelessness."[137]
Most prisoners, particularly those serving long sentences, lose social support and family connections. The difference for youth offenders serving life without parole is that they are likely to be much more dependent on family relationships than older inmates and may suffer these losses at an earlier age, causing them to endure their loss longer than other inmates.
Addison R. was convicted of attempted murder, armed robbery, and criminal sexual conduct. He entered prison at age fifteen and wrote at age thirty-five, "Since being in here I've lost my whole family. I don't know where they are or if they're dead or alive. I've been on my own in here since I was a kid fifteen years old. Twenty years done went by."[138]
Jeffrey B. was fifteen years old when he entered prison with a life without parole sentence for the murder and sexual assault of a seven-year-old boy. He wrote in 2004, "I don't hear from my family. They cut me off when my mother past away in 1982. That was my last visit. My last phone call was in 1991, when my sister hang up on me."[139]
John E. committed second degree murder and was sentenced to prison in Pennsylvania when he was seventeen. He was forty-six when he wrote:

I would like to be able to live again and see all those things I miss from being lock up because the world has grown up so fast and I mess out on it. My situation for the last twenty some years has been very hard on me because I have seen most of my family members pass away on me . . . just last year I lost my mother, so what is left for me and my situation but hope someday I walk out of here without being carry out in a body bag? I was seventeen then, now I'm forty-six.[140]


Some state prison policies aggravate the inherent isolation of imprisonment. In the state of Colorado, "a person may only be approved to visit an offender if there was an established relationship prior to the offender's incarceration."[141] Inmates must provide documentary proof of such a relationship.

One inmate serving life without parole in Colorado, Ethan W., who was twenty-five when he was interviewed for this report and nineteen when he entered prison for a crime committed at age seventeen, had lived in juvenile group homes for years before coming to prison. He explained that the last documentary proof he had to show he had a relationship with someone other than his family members was a grade school yearbook. He said:
So that means the only people that I can show them I knew when I was twelve, from some photo when I was in school, those are the only people that I can know for the rest of my life? I mean what am I supposed to do? I don't understand it? I mean … what am I supposed to hope for except for dying tomorrow maybe?[142]
Several youth offenders, both male and female, spoke about needing to "wear a mask, twenty-four / seven" in adult prison, which naturally led to their isolation and loneliness.[143] Psychologists have observed that some prisoners "learn to find safety in social invisibility by becoming as inconspicuous and disconnected from others as possible. These prisoners retreat deeply into themselves, trust virtually no one, and adjust to prison stress by leading isolated 'lives of quiet desperation.'"[144] Whether they enter prison as teenagers or young adults, child offenders serving life without parole must face the possibility that their loneliness and hopelessness may continue until they die.
Brandon S. was seventeen when he was arrested and convicted of first degree murder. He entered prison at age eighteen. Brandon wrote: "I'm very depressed because life without parole is the reality I face every day, all day. I'm paranoid about people in general. I trust no one and I honestly believe there is no good person on the face of the earth."[145]
Perhaps it is not surprising that the psychological strain of a sentence that will only end in death causes youth offenders to contemplate suicide. There are several factors associated with suicide in prison that are exacerbated by both the youth of the prisoner and the length of the life without parole sentence including:
[L]oss of outside relationships, conflicts within the facility, victimization, further legal problems, physical and emotional breakdown . . . When the inmate cannot effectively cope with these stressors, the result can be varying degrees of suicidal behavior-from ideation to contemplation, attempt, or completion.[146]
A young male prisoner, who committed his crime of felony murder when he was seventeen and came to prison at age nineteen, told a researcher for this report:
I started doing drugs [when I first came to prison]. I mean I always smoked weed [marijuana], but then I started doing like heroin and stuff. Sometimes I try to escape. I went to mental health one time and they put me on a pain killer. I told them I was starting to have suicidal thoughts . . . and they said that was normal and just go back to my cell. I cut my wrist [shows his wrist with multiple scars to a researcher] . . . Well, I thought that drugs helped me to escape. But then reality is still here when I wake up.[147]
Richard I., who was fourteen at the time of his crime and entered prison at age sixteen, had suicidal thoughts for many years and would cut his arms frequently. He said to a researcher for this report:
When I went to prison, I was around all the-up all night-all the violence. I was like, "man I gotta get out of this-how am I gonna get out of this prison?" I can't do no life sentence here at that age. And so I thought of that [killing himself]. Gotta end it, gotta end it. . . . .I've got so many cuts on me . . . Razor blades. They give us disposable razors, you pop it out.[148]
Ethan W. who entered prison at age nineteen, described hope as the only thing preventing him from committing suicide:
The only reason I don't kill myself is 'cause there's still hope. I mean at least if you got a dog that you know is never going to get adopted, that's never going to live free again, I mean they kill it. They put it to sleep. That's more humane than keeping him in this cage the next twenty years, making him live with his own shit and his own piss. I came in here at seventeen years old and what are they going to do, keep me for sixty or seventy years? I mean c'mon now . . . that's a long time![149]
Incarceration alongside Adults
Some child offenders interviewed or corresponded with for this report recalled that while they were still children-that is, age seventeen or younger-they were housed with adults in jail or prison. This finding coincides with a national survey conducted by the U.S. Department of Justice, which found that only 13 percent of institutions surveyed in the single year of 1997 maintained separate units for child offenders.[150] This same study also cautioned that "the presence of separate housing for youthful offenders does not necessarily mean that all youthful offenders were housed in these separate facilities."[151]
Richard I. was fourteen at the time of his crime and was jailed in Arkansas at that same age, though he soon turned fifteen. When interviewed for this report, he spoke about the county jail where he was held. He called the jail "a dungeon." He continued:

They had roaches. They had broken windows, it was terrible . . . I was there about eleven months, so I probably had anywhere from thirty to forty people come through and stay in there with me. So I had pretty much a lot of "cellies." I always had one and they was always adults.[152]

He told a researcher for this report how much he dreaded Friday and Saturday nights when the police would arrest adult "drunks" and "throw them in jail." Richard said:
Some would be hollering, some would be violent . . . some would be telling their life story, some would be cussing. You know, I was fifteen then in county jail and to have to work with alcoholics is kinda hard. I would just try to get them to go to sleep. I would just try to read a book, put my face in a book, and . . . give them a cigarette or something.[153]
Clifford S. was seventeen years old when he was put in an Arkansas county jail with adults: "I was with them older guys . . . And you know you're around older guys, prisoners, you know, killers, you know what I'm saying? Looking at you crazy . . . I was [thinking] I gotta get out. It's like a living hell, you know? It's hell. It's rough in there."[154]
Scott J. told a researcher for this report about being jailed at age seventeen in Arapahoe County, Colorado. He said:
They put me in a mental ward where they put all the wackos. . . . They put me in a cell with these two [adult males]. And I remember I woke up one time and this big . . . guy was like looking over at me, calling me "mom" and telling me to stop hitting him . . . and then the other guy like whooped his ass . . . [T]he toilet was like right here [gesturing to the space directly in front of him] and it smelled like piss all the time.[155]
Non-binding standards of the American Correctional Association (ACA) support placing youth offenders, including youths who are transferred or sentenced to adult prison, in separate juvenile facilities.[156] The ACA also recommends keeping children in pre-trial detention out of sight and sound of adults, in accordance with federal "sight and sound" requirements.[157] International human rights standards are more definitive and clear: children should not be held with adults and should be separated further according to sex, age, and conviction status, meaning that children convicted of a criminal offense should not be held with children awaiting trial.[158]
Access to Education and Vocational Programs
Regardless of whether they entered prison at fourteen or twenty, young offenders are incarcerated during the years when education and skill development are most crucial. Until they turn eighteen, most child offenders imprisoned in the U.S. are able to take courses preparing them for the General Educational Development (GED) exam or a high school diploma. In states such as Pennsylvania and Arkansas, obtaining the GED or diploma is mandatory for prisoners under the age of eighteen. In other states, such as California and Colorado, inmates can choose whether or not to take the test.
In the course of doing research for this report, we discovered two offenders who had entered prison prior to their eighteenth birthdays but had not passed their GED exams and were functionally illiterate. One, who entered prison at age seventeen, explained how he managed to answer a short letter sent to him by a researcher for this report:
I was in the [prison] building like I am now, and I let this guy, [a] charity dude, he can read and write you know? He read it [the letter]. He figured it out . . . He read the questions and [wrote the responses] . . . I did my best, you know?[159]
Among the youth contacted for this report, this young man was an exception. Most of the child offenders contacted who had entered prison before age eighteen were literate and had obtained their GED diploma. For example, Stacey T. was fourteen at the time of his crime, fifteen when he entered prison in Pennsylvania, and sixteen when he passed his GED exam. Ironically, he explained to a researcher for this report, "[A]lthough I graduated, I was too young to receive my diploma, I had to wait two years until I turned eighteen years old to receive it in the mail."[160]
Warren P., who came to prison at age fifteen, said:
I was in the GED class when I first came to prison, when I was fifteen I nearly maxed out [completed] the pre-GED [courses] and I was told I was too young to take my GED [exam]. I had to be sixteen. But I had life in prison with adults. I got my GED soon after turning sixteen.[161]
Once a youth offender has obtained his GED or its equivalency or has passed his eighteenth birthday, he faces an uphill battle to obtain additional educational opportunities in prison. All of the offenders contacted for this report were incarcerated in prisons with further education and vocational training programs, but only a few managed to gain access to these programs.
One who was able to do so, Gerard C., came to prison at age eighteen. He wrote:

I have received my GED . . . I completed college course hours . . . through Arkansas State University. I maintained a 4.0 G.P.A. and my courses were geared toward Sociology and Psychology . . . Then they said classes would be paid for [only] if you were within five years of parole. I did not fit those criteria; therefore, I had to discontinue taking classes.[162]

Gerard's college studies stopped abruptly because of a cutback in the nationwide "Pell Grant" program, which once included funding for prisoners' post-secondary education.[163] Today, the federal government provides funding only for "incarcerated youth under the age of twenty-five and within five years of release to acquire functional literacy, life, and job skills through the pursuit of a postsecondary education."[164] By definition, youth serving life without parole will never be within five years of parole and are therefore disqualified from this program. Post-secondary education is only available to youth offenders serving life without parole if someone can pay the course fees, which tend to be beyond the means of most offenders' families.
Cleveland B. entered prison at the age of seventeen after committing his offense at age sixteen. He explained:
I have received my GED. I also have graduated an eighteen-month program for behavior modification. It took twenty-eight months. I can do nothing else because the state offers nothing else for life without-ers, but I am working on college courses in criminal justice through [a] correspondence course which I pay for with the help of my family.[165]
As noted, these young prisoners were in the minority. Most child offenders who have been sentenced to life without parole are denied access to further education or vocational programs for a very simple reason: the state and the federal government do not expect them ever to leave prison and so reserve the already underfunded programs for those who will.
Joe L., who was seventeen at the time of his offense and nineteen when he came to prison, explained to a researcher for this report that his prison did not "offer me anything else [other than the GED] because of the length of my time."[166] Darby B., who entered prison at age sixteen, wrote: "I'm not allowed to participate in counseling because of the amount of time I'm doing. . . . Most programs [have] been eliminated by the state. I spend most of my time doing nothing."[167] When asked about educational opportunities in the Alabama prison he was held in, Holman C., who entered prison at age twenty, wrote: "None. Can't go to school with LWOP. I was told I had to pay for trades [vocational classes]."[168]
Cindy J., who was fourteen at the time of her crime and sixteen when she entered prison, wrote: "My institution doesn't allow LWOP inmates to attend vocational training."[169] Angela B. came to prison at age nineteen and wanted to take a college correspondence program. However, she wrote, "[S]ince I am serving LWOP, I'm not eligible. I guess they think since I am going to die in prison anyway, why educate us?"[170]

Correctional authorities in a number of states told a researcher for this report on the record that inmates serving life without parole sentences were at the "bottom of the list" for getting access to vocational training.[171] Officials cited their state's need "to put our resources where the inmates who are going home can access them first."[172] Others also mentioned the cut-backs in federal funding described above. Most officials were complacent about these policies; however one did admit to a researcher, "it's kind of hard to see them with all that potential just sit here for the rest of their lives."[173]

Susan McNaughton, press secretary for the Pennsylvania Department of Corrections, told a researcher, "Those going home have a better chance of getting into a [vocational] program."[174] However, she said that youth offenders with life without parole are not "sitting around doing nothing," because the "prison industries program" is a "good one for them."[175] But Pennsylvania's own policy states "inmate employment coordinators use the inmate's treatment level, treatment plan, custody level, and length of time remaining on his or her sentence to determine eligibility for referral to the program."[176] By definition, offenders sentenced to life without parole will have the longest amount of time remaining on their sentence.
Darryl T.'s sentence of life without parole prevented him from accessing the college education that a court psychologist recommended during his trial because of Darryl's "high mentality."[177] Darryl, who came to prison in California at age eighteen, wrote:
LWOPs cannot participate in many rehabilitative, educational, vocational training or other assignments available to other inmates with parole dates . . . The supposed rationality is that LWOPs are beyond salvagability and would just be taking a spot away from someone who will actually return to society someday.[178]

Darryl's explanation was confirmed by Margot Bach, Public Information Officer with the California Department of Corrections. She told a researcher for this report, "Those with the longer sentences are not going to get the same programming as someone who is closer to leaving prison. It's a question of resources."[179]
International human rights standards state that children in prison must be provided with basic primary and secondary education and even vocational or college-level opportunities.[180] Even those child offenders who enter prison after reaching age eighteen are entitled to further education. According to the U.N. Standard Minimum Rules for the Treatment of Prisoners (which applies to adult prisoners):
Provision shall be made for the further education of all prisoners capable of profiting thereby, including religious instruction in the countries where this is possible. The education of illiterates and young prisoners shall be compulsory and special attention shall be paid to it by the administration . . . [and] [r]ecreational and cultural activities shall be provided in all institutions for the benefit of the mental and physical health of prisoners.[181]
Case Study: Trey J.
Trey J. was seventeen years old when he was convicted of felony murder for the underlying crime of robbery. He attributed his crime to his need for money to support his drug habit. When he was interviewed for this report, he explained that he and another boy had, "developed a 'con scheme' to get some money from another juvenile under the pretext of selling him a gun."[182] He said that he accidentally squeezed the trigger during the transaction, killing the victim.
Trey wrote about his life at the time of his crime, emphasizing, as he did in a later interview, the role of his drug abuse: "My life situation at the time of my crime was not great but not awful either. I was more messed up than my situation. My family was clearly dysfunctional though. I was a heavy drug and alcohol abuser and had been for a few years prior to this crime. I was not in school as I was expelled a number of times and after I turned seventeen truancy courts no longer had legal involvement in my school situation. I really was a mess, I had several convictions of minor charges in my teen years concerning fights and drug and alcohol abuse, etc. . . . I was just out of touch with reality and didn't know how good I had it and how I could have really done something with my life in light of the advantages and opportunities I had."[183]
Violence
Violence is endemic in U.S. prisons. It affects all inmates, whether teenagers or adults. But child offenders who enter adult prison while they are still below the age of eighteen are "five times more likely to be sexually assaulted, twice as likely to be beaten by staff and fifty percent more likely to be attacked with a weapon than minors in juvenile facilities."
These chilling statistics testify to the inability of correctional authorities to provide safe correctional environments for all prisoners-an inability that is itself a reflection of prison overcrowding, staff shortages, and inadequate prison programming. Regardless, all inmates, whatever their age, have the right to be free from threats to their physical safety. Both U.S. constitutional law and international human rights law require authorities to provide safe and humane conditions of confinement. Despite these norms, not one of the offenders contacted for this report had managed to avoid violence in prison.
Assault
Almost all youth offenders contacted for this report suffered physical violence at the hands of other inmates. They rarely reported the assaults because of the harm it would do to their reputations in prison, and because they assumed correctional authorities would do little to rectify the problem. For example, Michael S. was seventeen when he entered prison. He wrote:

On several occasions I have been physically assaulted. I reported the first assault, but from that point forward I deduced that it was best to remain silent as I cannot afford to be labeled [an informant] in my current circumstances.[187]

Sometimes guards are allegedly to blame for assaults on young inmates. Joe L., who was nineteen when he entered prison, told a researcher for this report that "a few times" he was "slammed pretty hard by the guards here."[188] Another young man who was fourteen at the time of his offense and eighteen when he entered prison said, "I was having problems from other inmates that were violent to me and the staff wouldn't move me, they left me there on purpose to be abused by the other inmates."[189]
Every youth offender described getting involved in fights in order to defend him or herself. Gregory C., who entered prison at the age of sixteen, was typical. He said, "I've been in fights with prisoners on many occasions. Luckily, I received nothing more than a few black eyes, fat lips, chipped tooth and swollen knuckles."[190]
Others had more serious injuries, requiring hospitalization. Jackson W., who entered prison at age seventeen, said that he was hospitalized in prison in Arkansas because, "I got stabbed a couple times . . . I got my head busted by locks. That's a small weapon, but they still hurt."[191] Andrew H., who was sixteen at the time of his crime of murder and entered prison that same year, explained that he was hospitalized after being "stabbed in the left shoulder helping a guy that I knew when others tried to rape him."[192]
Patricia L. was sixteen years old when she was sentenced to life without parole. She entered prison at age twenty. Patricia wrote:

People here who are in and out prey on the young and use us for things. It's scary to wake up every morning and not know what will happen (get beat up or tested) . . . I've gotten beaten up by women who just don't like me for whatever their reasons.[193]

Some facilities are infamous for violence. Several of the young male offenders interviewed for this report had been confined in Varner Unit, a prison dedicated to housing youth offenders convicted of serious violent crimes. Before Arkansas stopped sending all such offenders to Varner, inmates and guards nicknamed it the "Gladiator School." The practice of sending all youth offenders to Varner Unit has since ended.
Richard I. began serving his prison sentence at age sixteen. His story was typical of those inmates who had spent time in Varner. He told a researcher for this report what life there was like:
I got to Varner on a Thursday night, and they . . . said "tomorrow is Friday. . .that's fight night." Friday come around . . . all these fellows, black dudes, got together with ski masks, made up ski masks, go down there and go find a white dude and jump on him. I didn't get jumped on the first weekend, it was like the second weekend when I got into a fight. I guess it was my turn.[194]
Richard claimed his injuries were not severe-just cuts and bruises-as a result of the fight. However, he said that at Varner:
I've seen people . . . they'd set the edge of his blanket on fire. Or I've seen people get wooden locker boxes dropped on themselves. Seen people, they put locks in their socks and hit people while they're sleeping. I've seen people get jumped on while they sleeping . . . Seen stabbings. Seen a person get killed.[195]
Sexual Abuse and Rape
As Human Rights Watch and Amnesty International have reported elsewhere, female inmates are particularly vulnerable to violent or otherwise coercive sexual relationships with corrections personnel. Abusing the power imbalance inherent in their positions, male corrections employees sometimes allegedly engage in abusive "sexual contact with female prisoners absent the use or threat of force or any material exchange."[196] However, they also at times use force or bribery to obtain sex from inmates. The practice of assigning of male staff to guard women in prisons and jails in the United States is itself contrary to international standards.[197]
Carolyn K. entered prison with a life without parole sentence at age seventeen. She wrote, "[O]ne official put me in a situation to have sex with him and I did."[198] Cheryl J., who began serving her life without parole sentence at age eighteen, described being approached by a male guard for a sexual relationship. When Cheryl was interviewed for this report, she said, "[H]e wanted to have sex but I was scared you know? I might get pregnant, you know, so that's why I didn't. I liked him . . . but I was young [then]."[199] She also spoke in general about how common sexual contacts with male guards were:
A lot of them [female inmates] do favors for the guards. The ones who work at sally port [a security gate between a prison's interior and public areas]. To get tobacco, they give guards head . . . it's beginning to be more male guards instead of female guards [here] and they're taking advantage of it. They think all females wanna be touched and watched by them but that's not true![200]
Cheryl also complained about having to expose her naked body to male guards during showers and about offensive pat searches. She said:
We have a lot of male officers here, and we have to expose ourselves to them and I don't think its right, the way the shower has see-through curtains and then we have a shower with no curtains. And we're told to get in it and the mans just be in there, they come in and count. And we're naked, and if you cover up or try to hide, that's a disciplinary . . . I don't know what they be thinking but they be staring. They don't stop looking or try to play it off. They just looking you know. And it's just bad. . . .
They pat us down, but they pat us down so unprofessional! They supposed to put their hands out but they go over your breasts like this [she squeezes her breasts]. And [they] come all the way up your legs. I mean so many womans have complained about it here. [But they told them] "They're only doing their job, they got womans at home, they don't want ya'll inmates." But that's not true! You've had several inmates get pregnant by guards here, so what do you mean?[201]
One young male offender in Arkansas, who was sixteen at the time of his crime and had just entered prison at age nineteen when he was interviewed for this report, alleged that guards in his prison had sex with inmates for money. He told a researcher that in order to have sex with a guard, "You gotta have money though, like fifty to one hundred bucks . . . it's not really sex, it's just kinda masturbation . . . it's both female and male guards that do it."[202]
Human Rights Watch has previously documented the extensive incidence of rape in U.S. prisons.[203] It was unsurprising that almost every young male offender raised the problem of rape.
Brian B. wrote about what happened soon after he entered prison in Pennsylvania at the age of seventeen with a life without parole sentence:
Sheriffs took me to the Western Penitentiary. They lied to the warden telling him I were eighteen, which I had not yet become. I were housed in an open poorly supervised unit, and that evening a group of large adult men rushed into my cell, holding me down they began pulling my clothes off while another took a syringe over to a spoon that another inmate were holding a lighter under. He drew up whatever was in the spoon. I were then injected with whatever it were. And then raped. Once found by the officers I were taken to a holding area, cleaned up, and placed on a van to another prison at around 3:00 am.[204]
Almost every male inmate we interviewed described having been approached by other prisoners for sexual favors, or having to fight to protect themselves from rape. Rape is a particular risk for child offenders, because they come to prison so young. Warren P. wrote that when he first came to prison, at the age of fifteen:
I was the target of covert sexual predators. Adults would pretend to be your best friend to get close to you, then they would try you . . . Officers would be hard on me more so than the adults for they believe that the younger inmates need rougher treatment.[205]
Tyler Y., who came to prison at age eighteen for a crime committed at age sixteen, wrote:
[W]hen I first when to jail / prison, when I was young, it was disorienting and scary, like a fish thrown in water not knowing how to swim. Everyone seemed big and dangerous and threatening, I was challenged and intimidated a lot. Canines [sexual predators] stalked me, and at all times I expected to be attacked.[206]
Eric R., who came to prison at age sixteen, wrote:
When I first came to prison attempts were made to lure me into out of the way places so that I could be sexually assaulted, fortunately I was so scared and wary that I managed to avoid being victimized. I was very small when I came to prison.[207]
Luke J., who came to prison at age nineteen, but admitted that he had always been "real skinny" and always looked younger than his age, said, "When I first came into prison [a] dude told me that he was gonna make me his 'bitch' and he beat me up real bad."[208]
Trent H. entered prison at age fifteen. He told a researcher for this report,
You know I've seen a lot of that. Dudes get turned out. I've seen dudes get raped, where they get choked out and raped. Seen where dudes get knives pulled on them and get raped. I've seen them do it willingly too. You know, I've seen them do it for food, and commissary. Yeah I've seen a lot of it. Like you and me sitting here right now bearing witness to it. Personally.[209]
The problem of sexual violence lessens as child offenders grow older in prison. Addison R., who entered prison at age sixteen and wrote to a researcher for this report at age thirty-six, explained:
I've gotten older, a little bit more mature, a little bit bigger in physical size, and the older prisoners have stopped preying on me for sex. . . . [Before] I've had to stab other prisoners for preying on me for sex.[210]
Occasionally, prison authorities recognize the problems a youth offender is having and take corrective measures. Jeffrey W., who entered prison at age seventeen, wrote:
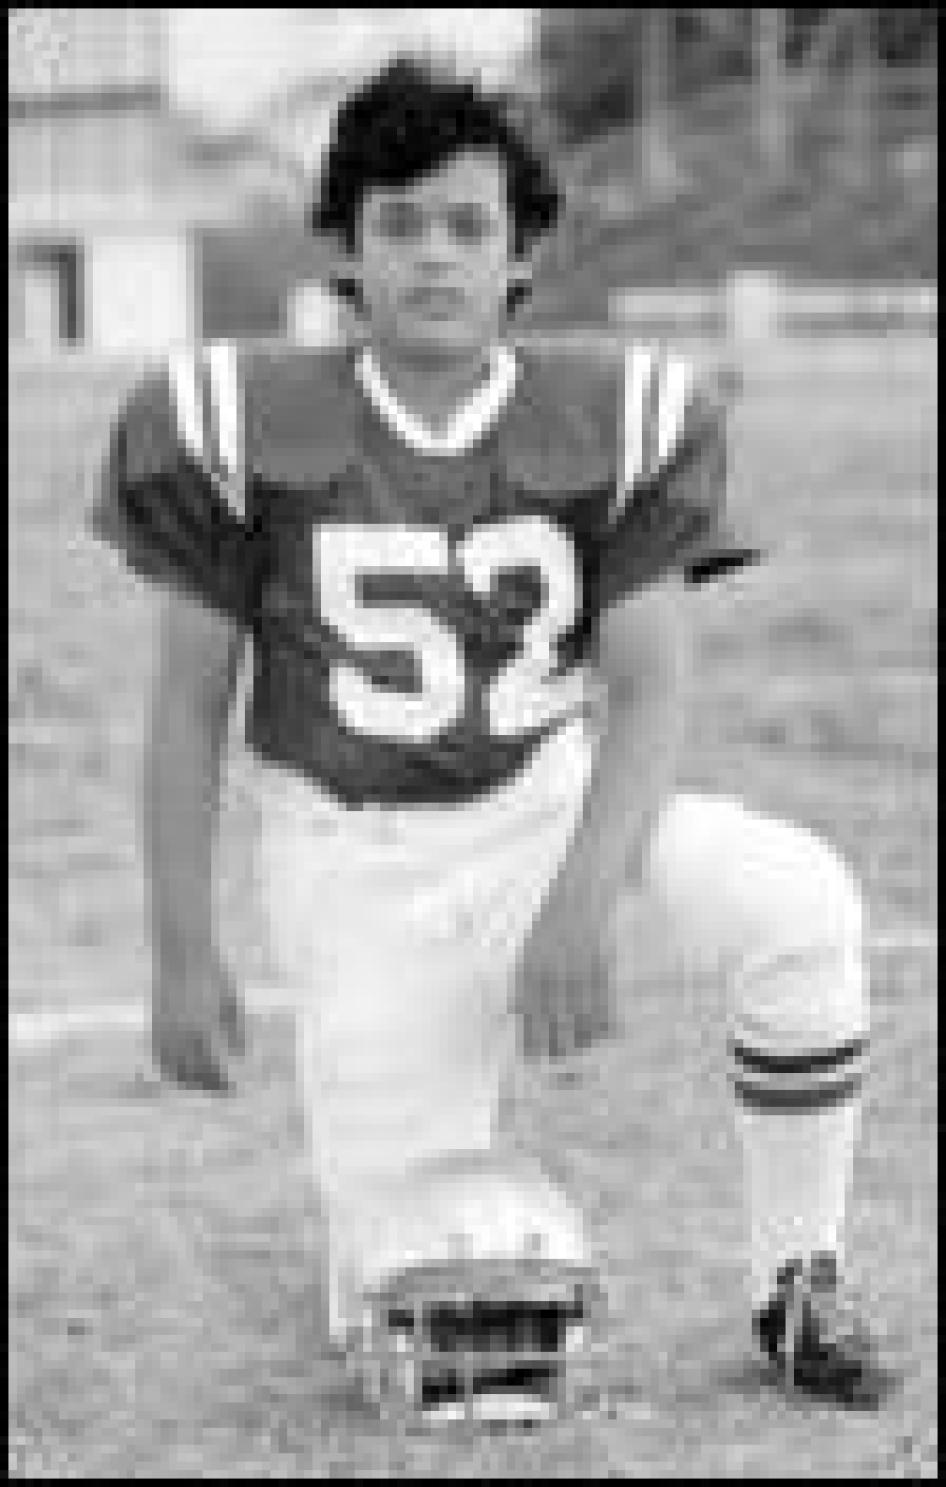
At the beginning, the focus was on surviving . . . Naturally, I was the target of sexual predators and had to fight off a couple rape attempts. . . . These were hardened, streetwise convicts who had been in prison 10, 15, 20, 30 years and I was a naïve 18 year old who knew nothing about prison life. … Because of the rape attempts on me … state prison officials [said] I should have been classified as needing protection. I was soon sent to the state's protection unit . . . I stayed there for seven years until I was returned to the general population-older, wiser, and capable of surviving general population.[211]

Sexual abuse and rape constitute serious human rights violations whenever and wherever they occur. The fact that youth offenders' particular susceptibility to sexual abuse and rape is well-known heightens the responsibility of adult prison authorities across the country to take actions targeting young prisoners to prevent its occurrence.[212] Yet, Human Rights Watch has found elsewhere that "rape occurs in U.S. prisons because correctional officials, to a surprising extent, do little to stop it from occurring."[213] Apart from those officials who may be guilty of these acts themselves, this is mostly because correctional authorities tend to deny that the problem exists in their facilities, or they actively avoid knowledge about rape and sexual abuse in order to evade liability in prisoner lawsuits, which require proof that the prison official had actual knowledge of a substantial risk and that he or she disregarded it.[214]
At the same time, prisoners' attitudes and fears can make preventing sexual abuse and rape a challenge. As noted above, some youth offenders are unwilling to report rape because of the debilitating effect it can have on their reputations in prison. Moreover, youth offenders interviewed for this report felt unable to ask for a placement in protective custody, since other inmates would view that as a sign of being an informant for correctional officials, or as an implicit admission that a youth offender was unable to protect himself. Youth offenders believed that such harmful implications for prisoners' reputations put them at greater risk of violence once they were released from protective custody. Finally, protective custody itself often means being housed in units whose conditions are similar to those of isolation (discussed above): twenty-three hours per day in a cell, restricted privileges, and no educational or vocational opportunities-making protective custody an unappealing solution for many inmates.
Potential for Rehabilitation
The paradigm of prison as a place for rehabilitation lost public support and political currency decades ago in the United States.[215] Most prisons pay nominal attention at best to improving inmates' skills and lives, regardless of their sentences. Concern about promoting successful re-entry is gaining currency and recognition as an effective means of preventing recidivism but has yet to make a meaningful impact on the nature of most prison programs.
Prospects for rehabilitation are even worse for individuals serving life without parole. The sentence itself contains an unmistakable message that is never lost on offenders serving it. As one young woman put it: "I feel like they threw the key away on me."[216]
By sentencing children to life without parole, society tells them unequivocally that their lives are worthless, they are beyond repair or redemption, and any effort they may make to improve themselves is essentially futile. There is also inherent cruelty in denying a child any possibility of rehabilitation or reform. Child offenders serving the sentence receive these messages much earlier in their lives than adult offenders with the same sentence.
As noted above, not only is the message of the life without parole sentence resoundingly clear to offenders, it offers correctional authorities a means to allocate the increasingly scarce rehabilitative resources at their disposal. U.S. society has instructed its correctional systems to invest in those who may rejoin society someday, and to disengage from those who never will.
As a result, some child offenders serving life without parole remain poorly educated, even illiterate. They frequently are angry and violent. They may use drugs and join prison gangs. Many are also unable or unwilling to come to terms with their crimes or exhibit any signs of remorse. Also working against their rehabilitation is the truncation of child offenders' development. Despite most offenders' physical and chronological maturity when they were interviewed for this report, many felt and even behaved as if they were still children. Time and again, inmates would describe feeling "stuck" at the age they were when they entered prison. For example, Samantha L. came to prison at age seventeen and was interviewed for this report twenty years later, when she was thirty-seven. She said:
You know what's the worst part of being young and being in prison? It's like you never get to the place where other people are at. It's like you're always looking for guidance, you can't trust other people, and even as you get old, you still feel like you are seventeen. I mean sometimes I see myself in the mirror and I see that my body, my skin, is getting older but inside I feel like I'm still seventeen.[217]
Nevertheless, there are many youth offenders serving life without parole who withstand these negative forces and work hard to rehabilitate themselves. One common sign of this drive towards rehabilitation is their unwavering desire to learn new things, however basic.

Charles L. came to prison at age nineteen. He spoke with obvious pride about what he was learning on "hoe squad" in the Arkansas Department of Corrections:
I ain't ever had no job. But now I'm on hoe squad. Know how to plant everything. Cantaloupe, squash, onions, green beans, cabbage, broccoli, tomatoes, peas, sweet potatoes . . . everything they grow, eggplant . . . they grow everything. There's a lot I know since I been here.[218]

Other offenders serving life without parole dream of playing a positive, redeeming role in society at some hypothetical point in the future. Nelson H. came to prison at age eighteen for murdering an elderly woman, and he was twenty-seven when he was interviewed for this report. Nelson spoke constantly and in great detail about his passion to become a "search and rescue" worker. He studied books on rescue techniques, physical conditioning, and first aid. He also trained and tested himself against the standards applied in rescue workers exams. He wanted to fight forest fires, or rescue people caught in other natural disasters because he believed that if he could save at least one life that would somehow compensate for the one he took.[219]


Other offenders held similar hopes of redemption. Troy L., who was fifteen when he murdered his abusive father, was interviewed for this report at age twenty-four in June 2004. He wrote in a subsequent letter:
I would be ever grateful, in fact, for the chance to spend my life now for some good reason. I would go to the most dangerous parts of Afghanistan or Israel, or jump on the first manned mission to Mars . . . .[I]f the state were to offer me some opportunity to end my life doing some good, rather than a slow-wasting plague to the world, it would be a great mercy to me.[220]
Some offenders manage to avoid drugs and alcohol in prison, a relevant accomplishment when substance abuse was a factor in their earlier criminal behavior. Thomas M., who was fifteen at the time of his offense and was interviewed in prison at age twenty, told a researcher for this report:
My dad is an alcoholic and he used to beat my mom real bad, and me. I remember one Christmas my dad got so drunk he threw my mom through the Christmas tree and it fell out the window. It can't get much worse than that . . . At that time [of the crime] I thought I was cool, getting high, cruising around on the streets with my so-called friends. Since I've been in prison, I've had plenty of opportunities to smoke cigarettes, do drugs, homemade liquor. But mark my words, I'll never smoke or drink or do drugs whether I spend the rest of my life in prison, or whether I am free. All I want is a chance. I've come a long way as far as who I am and what I want in life. . . . I've really changed.[221]
Bradley W. was sixteen years old when he committed first degree murder and when he entered prison. He wrote:
Now, having just turned thirty-two I am struck by the realization that I have literally spent half my life in prison. Please make no mistake, there is not a question in my mind, I do deserve to be in prison. I killed a man . . . I have very heavy regrets. But in a twist of irony, I also feel grateful for the opportunities I've had which have enabled me to become a vastly better person than I believe I ever could have been absent my incarceration.[222]
Case Study: Timothy C.
Timothy C., now thirty-three years old, is serving a sentence of life without parole in Iowa. According to Marty Marsh, his prison psychologist (who informed Human Rights Watch that his client had asked him to communicate with us about Timothy's case), Timothy has said he was raped by his father from the age of five.[223] After several years of this sexual abuse, Timothy said that his mother brought him to live with her and her boyfriend, who soon began to violently beat Timothy in fits of anger.When Timothy was fifteen, his father re-married and his new stepmother was very warm to him and invited him to return to live with her and his father. Timothy said he was afraid that the sexual abuse would begin again, but he was desperate to flee his mother's boyfriend's violent rages; he also longed to have a stable home environment as well as his own bedroom, neither of which he had ever had before.
Timothy decided to return to his father's home, where his stepmother became the only adult in his life to show a nurturing interest in him. For the first few months, Timothy lived for the first time in a stable family environment and, also for the first time, he had his own bedroom. However, Timothy said that his father soon began sexually abusing him again. His stepmother did nothing to prevent the abuse, and according to the psychologist, after about a year and a half, she also began abusing Timothy, allegedly masturbating him forcibly and teasing him about the size of his penis. According to Marsh, this abuse and final breach of Timothy's trust were emotionally and mentally devastating, leading to a severe psychological crisis. Timothy eventually murdered his stepmother and set fire to the house he shared with her and his father.[224]
According to Marsh, Timothy did not disclose any history of physical and sexual abuse during his trial and only began speaking about it in 2001-fourteen years after the crime occurred. Since then, Timothy has confronted his father about the abuse through correspondence. His father's only response was to call the prison to ask the correctional staff about whether his son was contemplating bringing criminal charges against him.[225]
Marsh believes that Timothy's history of abuse, his ability to confront his trauma and to work on maintaining his psychological health, and his educational and social rehabilitation in prison make Timothy "the one individual [he] ha[s] worked with-out of some eight hundred cases in prison-who is most deserving of a second chance."[226]
VII. Life without Parole under U.S. Law
State and Federal Law
The Eighth Amendment to the U.S. Constitution prohibits cruel and unusual punishment,[227] which includes sentences that are grossly disproportionate to the offense.[228] Although it has never ruled on the constitutionality of life without parole for children, the U.S. Supreme Court has often highlighted the inherent differences between youth and adults in the criminal law context. The Court has determined that youth offenders lack the "well-formed" identities of adults and are "immature[e] and irresponsib[le]," and "vulnerable or susceptible to . . . outside pressures."[229]
In its 2005 decision to eliminate the juvenile death penalty, the Court enumerated "three general differences between juveniles under nineteen and adults."[230] First, "any parent knows" and "scientific and sociological studies . . . tend to confirm . . . [that youth possess a] lack of maturity . . . an underdeveloped sense of responsibility . . . [they take] impetuous and ill-considered actions and decisions . . . [and they are] comparative[ly] immatur[e] and irresponsibl[e]."[231] Second, the Court found that youth are more susceptible to negative influences and peer pressure. Third, the Court stated that a youth's character is not as well-formed as that of an adult, meaning he or she can and probably will change. The Court concluded that it would be "misguided to equate the failings of a minor with those of an adult, for a greater possibility exists that a minor's character deficiencies will be reformed."[232]
Even before this landmark decision, the Supreme Court has generally held that "less culpability should attach to a crime committed by a juvenile than to a comparable crime committed by an adult."[233] Similarly, due to children's lesser capacities for rational thought, the Supreme Court has repeatedly limited children's abilities to make autonomous decisions about other aspects of their lives.[234]
Some state courts have found life without parole unconstitutional when applied to child offenders. For example, when interpreting both the U.S. and Nevada constitutions, the Nevada Supreme Court held that life without parole constituted a severe "cruel and unusual" punishment for a fourteen-year-old convicted of murder. The Court pointed to the "undeniably lesser culpability of children for their bad actions, their capacity for growth, and society's special obligation to children."[235] The Court continued:
To adjudicate a thirteen-year-old to be forever irredeemable and to subject a child of this age to hopeless, lifelong punishment and segregation is not a usual or acceptable response to childhood criminality, even when the criminality amounts to murder. . . . As said, hopelessness or near hopelessness is the hallmark of [this] punishment. It is questionable as to whether a thirteen-year-old can even imagine or comprehend what it means to be imprisoned for sixty years or more. It is questionable whether a sentence of virtually hopeless lifetime incarceration for this seventh grader "measurably contributes" to the social purposes that are intended to be served by this next-to-maximum penalty.[236]
Two decades earlier, the Supreme Court of Kentucky determined that the sentencing of two fourteen-year-olds convicted of rape to life without parole violated the Kentucky state constitution and "shocks the conscience of society today and is intolerable to fundamental fairness."[237]
Other state Supreme Courts, like those of Indiana and Illinois, have allowed for the possibility of parole in certain cases involving children who have been effectively sentenced to life in prison. The Supreme Court of Indiana has repeatedly found excessively long prison sentences, such as 120 years, disproportionate for children. At the same time, the court has merely reduced such sentences to time spans equivalent to a child's natural life, such as sixty or eighty years. In one case, a trial court judge refused to consider age as a mitigating factor and sentenced a fifteen-year-old convicted of murder, rape, robbery, and auto theft, among other crimes, to 199 years in prison.[238] The Indiana Supreme Court disagreed and reduced the sentence to ninety-seven years because, it concluded, even for the most heinous crimes, age is a "significant mitigating circumstance."[239] Under Indiana law, an individual would first become eligible for parole after serving twenty years of a ninety-seven year sentence.[240]
The Supreme Court of Illinois, which has not abolished life without parole for youth offenders, has imposed long sentences but allowed for the possibility of parole for certain children convicted of felony murder. In 2002, the Court affirmed a lower court judge's decision to reduce a fifteen-year-old's mandatory sentence of life without the possibility of parole to a sentence of fifty years, because the youth acted only as a "lookout" accomplice to the murder of two rival gang members. The sentencing judge found a life sentence without the possibility of parole for a child who was a mere lookout "unconscionable,"[241] due in part to the "greater rehabilitative potential" of children.[242] Under Illinois law, the youth will be eligible for parole after serving his fifty-year sentence.[243]
Some state legislatures are also deciding that life without parole is a disproportionate sentence for youth offenders. In Kansas, for example, when legislators passed a bill substituting life without parole for the death penalty, they included a provision that exempted child offenders from either sentence.[244] In 2005, Colorado lawmakers considered eliminating life without parole and other particularly long sentences for youth offenders, giving judges the ability to periodically re-examine a youth offender's progress in prison. These provisions did not pass the Colorado legislature.[245] In Florida in 2005, several state legislators introduced a bill to ensure parole for some children sixteen years old and younger sentenced to life. Florida's bill did not pass the state Senate's Committee on Criminal Justice.[246]
Several federal and state courts have determined that it is constitutionally permissible to sentence youth to life without parole. The U.S. Court of Appeals for the Ninth Circuit found that it was not cruel and unusual to sentence a fifteen-year-old first offender convicted of felony murder (in which his co-defendant killed the victim) to life without parole.[247] Stating that it had no room to substitute its judgment for that of the legislature in the state of Washington, the court stated that the defendant's youth had "no obvious bearing on" whether his sentence was disproportionate.[248]
The U.S. Court of Appeals for the Seventh Circuit, while stating that "a sentence of natural life in prison . . . is exceptionally severe when the defendant is a minor and suffers from deficits of understanding," nevertheless found that the sentence was not "unconstitutionally severe," when a judge determines that the sentence is proportionate to the crime.[249]
Many state supreme courts throughout the United States have upheld life without parole sentences for children.[250] In North Carolina, a disturbed and disabled thirteen-year-old with severe neurological problems was convicted of burglarizing an apartment and raping its occupant after harassing her for weeks. The trial court sentenced him to life without parole.[251] The North Carolina Supreme Court expressed its support for the legislature's "reasonable" response to rising youth crime rates, listed states that transfer children to adult criminal court at particularly young ages, and ultimately refused to adopt any "penological theory" that children should be "treated instead of punished."[252] Swayed most by its estimation that the crime committed in the case was "not the type attributable to or characteristic of a 'child'" and was due no "special consideration[ ],"[253] the court upheld the sentence of life imprisonment without parole.
In South Carolina, the state's "Two-Strikes Law" sends people who commit two serious offenses to life in prison without the possibility of parole.[254] A sixteen-year-old sentenced to life without parole under this law for burglary in the first degree and grand larceny had previously been tried in adult court for armed robbery, committed when he was fifteen. The South Carolina Supreme Court held that the life without parole sentence did not unconstitutionally violate contemporary standards of decency, because a "growing minority of states" impose the sentence on children, and "modern society apparently condones" such harsh punishment.[255]
Mandatory Sentences
While judges in the United States have ruled both for and against the constitutionality of the sentence, they have been more consistent in their opposition to mandatory life without parole for child offenders. For example, one judge sentencing a fifteen-year-old offender to life without parole stated in his order that it was "the sentence that I am mandated by law to impose. If I had my discretion, I would impose another sentence, but that is mandated by law."[256] Mandatory sentencing schemes eliminate statutory provisions allowing a judge to exercise discretion because of a child offender's age, background, the legal interpretations of facts established at trial, or any other factor provided for by statute that might make another sentence more appropriate. In essence, they substitute the legislature's generalized judgments about an entire category of youth offenders for the informed and individualized decisions once possible in a particular case.
The judge who sentenced fifteen-year-old Henry L. to life without parole for first degree murder reflected on his own lack of discretion and queried whether the legislature that developed the mandatory sentencing scheme understood the gravity of what it had put in place:
[T]he sentence that I must impose is mandated by law. I don't have any choice in the matter. I'm not at all comfortable with this case, not because the Defendant didn't receive a fair trial. I think that he did. . . .
One is always tempted in a case like this to search for some way to lessen the severity of the law because of the fact that the Defendant is only fifteen years old. The Motion for New Trial presented a certain amount of temptation to ignore the law and do something to fit the circumstances. I have a sworn duty to follow the law, and think in the long run the performance of the duty to follow the law is in the best interests of not only this community but the whole state.
. . . It's obvious to me that we can't, as a society, say that fifteen-year-old children should be held to the same standards as adults. Our law provides this. I think the law is wrong.[257]
Some judges find sentencing child offenders to life without parole especially troubling because it rejects the possibility of a child's rehabilitation. In a case involving a child offender facing life without parole, the Supreme Court of Nevada said, "We may possibly have in the child before us the beginning of an irremediably dangerous adult human being, but we certainly cannot know that fact with any degree of certainty now."[258] In Michigan, a trial court judge refused to impose life without parole on Nathaniel Abraham, who was convicted of murder committed when he was eleven years old. The judge emphasized the impossibility of deciding in the present whether a child offender might reform him or herself in the future: "Don't ask the Judge to look into a crystal ball today and predict five years down the road . . . Don't predict today, at sentencing, whether the child will or will not be rehabilitated, but keep the options open."[259]
Even some prosecutors question the mandatory sentencing of children to life without parole. Florida State Attorney Harry Shorstein prosecuted fourteen-year-old Joshua Phillips for killing his eight-year-old female neighbor in 1998. Shorstein has said he would not have objected to having a less stringent sentencing option for judges to consider in the case of youth offenders. In Phillips's case, the judge had only one mandatory sentencing option-life without parole.[260] Shorstein said, "I oppose mandatory sentences and the Legislature's tying the hands of judges and prosecutors." He continued, "No matter how tough you are on crime, you can't say a fourteen-year-old is the same as an eighteen-year-old."[261]
Case Study: Jose A.
Jose A. was fifteen at the time of his crime and is serving life without parole in the federal prison system. He was prosecuted for murder under federal racketeering laws for conspiring with three other individuals, all of whom were alleged to be members of the Latin Kings gang in Yonkers, New York. The U.S. Attorney's motion to transfer his trial to adult court was granted after a hearing, in which the court was required to weigh factors such as the seriousness of Jose's offense, his maturity, and his potential for rehabilitation.
Jose's former defense attorney, Paul Rinaldo told a researcher for this report about the transfer hearing: "He didn't have a chance to stay in juvenile court. The prosecutor focused on the fact that [Jose] was a gang member and emphasized the nature of the crime, that it wasn't done out of passion, that it was planned and the victim had been tracked down . . . The victim also was not a gang member. There was no convincing the court to pay attention to [Jose's] actual role in the crime."[262]
Jose wrote about his role: "I was alleged to have participated in the murder by acting as a lookout. At my trial, various co-conspirators testified that I rode my bicycle around the block and was to look for police while another person committed the murder."[263] Contemporaneous press accounts, his defense attorney, and testimony at trial all substantiate Jose's role in the crime as a lookout.[264] At trial, witnesses testified that Jose had been in the gang as a "Pee Wee Latin King" (for children) for no more than two or three months prior to the murder. They explained that Jose was fifteen years old at the time and that his "job was to ride his bicycle around the block as a lookout."[265] One of Jose's co-conspirators entered into a plea agreement in which he received a fifty-year sentence and admitted to shooting the victim as a reprisal.[266] At his sentencing hearing, Jose's attorney asked the judge to consider a sentence other than life without parole. The judge found that she was "required by law to sentence . . . to the mandatory minimum term of life imprisonment and that I do not have the discretion to depart."[267]
Jose's attorney said: "This trial was one of the worst. Right up until the very end, I really thought we had a chance. The prosecutor had three other perpetrators to convict, including the triggerman! And, I mean, [Jose] was such a minor player. While the other gang members had clearly planned things out and tracked the victim a few times prior to the murder, the evidence showed that [Jose] was brought in only that night . . . And his role was so stupid . . . I even brought a map into the courtroom to show the jury how crazy it was to have him ride away from point A, the victim's house, and then expect him to hustle on back, pedaling like mad, to say he saw a cop around the corner! . . . Jose broke down when he heard the jury give their verdict. He knew what was coming. It's a horrible memory."[268]
VIII. Just Sentences for Youth: International Human Rights Law
Conviction for even a very serious crime does not extinguish a youth offender's claim to just treatment at the hands of government, nor does it free a government to ignore fundamental rights when determining punishment. Nevertheless, by permitting the imposition of life imprisonment without parole on child offenders, forty-two U.S. states and the federal government threaten children's basic rights. International human rights law flatly prohibits life without parole for those who commit their crimes before the age of eighteen, a prohibition that is recognized and respected by almost every country in the world. State public officials, no less than federal, are required to follow international human rights law when imposing criminal sentences.
International Human Rights Law
The international prohibition against life without parole sentences for children (as well as the death penalty) is one of the crucial human rights protections for youth who have broken the law. Children have many of the same fundamental rights as adults-e.g., the right not to be tortured and the right to a fair trial. They also have additional rights not afforded adults. Even before the drafting of the major human rights treaties in the second half of the twentieth century, states acknowledged special rights of children that reflect their unique vulnerabilities and needs and the concomitant responsibility of governments to protect them. The United States also played an early leadership role in establishing a separate system of criminal justice for youth. The state of Illinois was the first government in the world to decide that children accused of crimes should be tried in a juvenile court that was structured differently from the regular criminal courts.[269]
In November 1959, the United Nations General Assembly adopted the Declaration on the Rights of the Child, which recognized that "the child, by reason of his physical and mental immaturity, needs special safeguards and care, including appropriate legal protection, before as well as after birth."[270] The United States was one of the seventy-eight members of the U.N. General Assembly, which voted unanimously to adopt the Declaration. Since that time, the world's governments, including the United States, have further elaborated the rights of children accused of crimes.
The International Covenant on Civil and Political Rights (ICCPR), to which the United States became a party in 1992, specifically acknowledges the need for special treatment of children in the criminal justice system and emphasizes the importance of their rehabilitation.[271] Article 10(3) requires the separation of child offenders from adults and the provision of treatment appropriate to their age and legal status. Article 14(4), which was co-sponsored by the United States,[272] mandates that criminal procedures for children charged with crimes "take account of the age and the desirability of promoting their rehabilitation."[273] The ICCPR requires states to respond to the offenses children commit by focusing on positive measures and education rather than punishment.[274]
There are several ways in which the United States is failing to uphold its obligations under the ICCPR. First, criminal laws allowing children to be tried and sentenced as adults violate the specific requirement contained in Article 14(4) that criminal procedures take account of the age of children.[275] As discussed above in Chapter III, many states allow prosecutors to charge children directly in adult court, without any consideration of the particular needs of the child. Other states require children to undergo a hearing in juvenile court before transfer to adult court, yet these hearings may be little more than a rubber stamp of prosecutorial decisions to seek adult sentences. Moreover, when children are tried in adult courts, they are treated as adults rather than being given age-specific accommodations. Most importantly for the subject of this report, children are given sentences equivalent to those of adult offenders. Thus, for example, if life without parole is a mandatory sentence for first degree murder, it is mandatory whether the offender was fourteen or forty-five at the time of the crime.
Second, the sentence of life without parole for children also contradicts the explicit requirement in Article 14(4) of the ICCPR that imprisonment should promote rehabilitation. The sentence reflects a determination that there is nothing that can be done to render the child a fit member of society. It is a sentence of permanent banishment-not an expression of faith that hard work and time can promote positive change. Indeed, the sentence tells child offenders that U.S. society rejects out of hand any hope they may have to atone for their crimes and improve their lives.
Both the ICCPR and the Convention against Torture and Other, Cruel, Inhuman or Degrading Treatment or Punishment prohibit "cruel, inhuman or degrading treatment or punishment."[276] Excessive punishment becomes cruel, inhuman, or degrading if its severity or length is greatly disproportionate to the crime or to the culpability of the offender. The prohibition on cruel, inhuman or degrading punishments is complemented by the positive requirements of article 10 of the ICCPR, which stipulates: "All persons deprived of their liberty shall be treated with humanity and with respect for the inherent dignity of the human person."[277] For treatment to be humane, it must be appropriate to age and legal status.[278] The vulnerability and immaturity of juvenile offenders renders them more susceptible to cruel, inhuman, or degrading punishments, which will in turn have a much more profound impact on the body and mind of a developing child than an adult.
Applying the prohibition on "cruel and unusual punishment" in U.S. law, the Nevada Supreme Court concluded that life without parole is a cruel and unusual sentence for a child offender. The Court stated, in part:
We do not question the right of society to some retribution against a child murderer, but given the undeniably lesser culpability of children for their bad actions, their capacity for growth and society's special obligation to children, almost anyone will be prompted to ask whether Naovarath deserves the degree of retribution represented by the hopelessness of a life sentence without possibility of parole, even for the crime of murder. We conclude that as "just deserts," for killing his sexual assailant, life without possibility of parole is excessive punishment for this thirteen-year-old boy.[279]
Imprisonment is the most coercive non-capital punishment lawfully imposed by criminal justice systems. Putting a person behind bars is so common in the United States, however, that public officials and the public at large seem to have lost sight of just how serious a punishment it is.
It is precisely because imprisonment is such an inherently severe sanction that governmental decisions to impose it are subject to human rights constraints. The ICCPR recognizes that all persons deprived of their liberty shall be treated with humanity and with respect for the inherent dignity of the human person.[280] Human Rights Watch and Amnesty International agree with the proposition advanced over thirty years ago at a U.N.-sponsored conference on human rights that punishments "prescribed by law and applied in fact should be humane and proportionate to the gravity of the offence."[281] We believe that the best reading of three interrelated human rights principles make life without parole sentences for child offenders per se disproportionate: the inherent dignity of the individual, the prohibition on inhuman or degrading punishment, and the right to liberty. All are affirmed in international instruments which the United States has signed or ratified, including the Universal Declaration of Human Rights, the ICCPR and the Convention against Torture.
When the United States ratified the ICCPR, it attached a limiting reservation that stipulates:
That the policy and practice of the United States are generally in compliance with and supportive of the Covenant's provisions regarding treatment of juveniles in the criminal justice system. Nevertheless, the United States reserves the right, in exceptional circumstances, to treat juveniles as adults, notwithstanding paragraphs 2 (b) and 3 of article 10 and paragraph 4 of article 14.[282]
The history of this reservation indicates that it was intended to permit-on an exceptional basis-the trial of children as adults and the incarceration of children and adults in the same prison facilities. The United States, as a co-sponsor of Article 14, was keenly aware of the breadth and scope of its language. There is nothing in its reservation to suggest that the United States sought to reserve the right to sentence children as harshly as adults who commit similar crimes.
On the contrary, the reservation's plain language and drafting history show that the United States sought to reserve the ability in "exceptional circumstance" to try children in adult courts and to require some of them to serve their sentences in adult prison. According to the United States Senate Committee on Foreign Relations, the reservation was included because, at times, juveniles were not separated from adults in prison due to their criminal backgrounds or the nature of their offenses.[283] In other words, the reservation is not about the length or severity of sentences, only about the need to sometimes try children as adults and incarcerate them in adult prisons.
The Convention on the Rights of the Child (CRC) explicitly addresses the contradiction between the particular rights and needs of children and life without parole sentences.[284] Underpinning several of the treaty's provisions is the fundamental recognition of the child's potential for rehabilitation. Recognizing the unacceptability of sentences that negate the potential of children to make changes for the better over time, the CRC flatly prohibits sentencing children to life sentences without parole or to the death penalty.[285] Article 37(a) states:
Neither capital punishment nor life imprisonment without possibility of release shall be imposed for offences committed by persons below eighteen years of age.[286]
The CRC also requires that a State's decision to incarcerate a child "shall be used only as a measure of last resort and for the shortest appropriate period of time."[287] A child who has committed a crime is to be treated in a manner that takes into account "the child's age and the desirability of promoting the child's reintegration and the child's assuming a constructive role in society."[288] States are to use a variety of measures to address the situation of children in conflict with the law, including "care, guidance and supervision orders; counseling; probation; foster care; education and vocational training programmes and other alternatives to institutional care."[289] The treaty also anticipates the need for regular and accessible procedures in which a child can "challenge the legality of the deprivation of his or her liberty."[290] Punishing a youth offender with the longest prison sentence possible, offering no hope of rejoining society, little motivation for rehabilitation, and scant opportunities for learning, violates each of these provisions.
The CRC has been accepted all but universally: as of 2005, 192 out of a total of 194 countries are parties. Notably, none of the state parties to the treaty has registered a reservation to the CRC's prohibition on life imprisonment without release for children.[291] The United States and Somalia[292] are the only two countries in the world that have not ratified the CRC, although both have signed it.[293] As a signatory to the CRC, the United States may not take actions that would defeat the convention's object and purpose.[294]
The U.S. government has proclaimed its commitment to the CRC's principles.[295] When Ambassador Madeline Albright, as the U.S. Permanent Representative to the U.N., signed the CRC on behalf of the United States in 1995, she declared:
The convention is a comprehensive statement of international concern about the importance of improving the lives of the most vulnerable among us, our children. Its purpose is to increase awareness with the intention of ending the many abuses committed against children around the world. . . . United States participation in the Convention reflects the deep and long-standing commitment of the American people.[296]
The United States has reaffirmed this commitment on subsequent occasions. For example, in 1999 Ambassador Betty King, U.S. Representative on the U.N. Economic and Social Council stated:
Although the United States has not ratified the Convention on the Rights of the Child, our actions to protect and defend children both at home and abroad clearly demonstrate our commitment to the welfare of children. The international community can remain assured that we, as a nation, stand ready to assist in any way we can to enhance and protect the human rights of children wherever they may be.[297]

Case Study: Troy L.
Troy L. was fifteen both in this photo and when he committed his crime.
© 2005 Private.
Troy L. grew up with his family in Arkansas. Troy did not have a juvenile record but had been kicked out of one high school for selling marijuana. He explained to a researcher for this report that he used drugs such as marijuana and "crystal meth." After Troy was suspended from the alternative school he was attending, his mother sent him to live with his father, who was an engineer in a nuclear power plant, so that Troy could attend another high school. Troy said that his father was physically and mentally abusive. He would not provide details about the abuse he had suffered at the hands of his father, explaining to a researcher for this report that he had promised his mother and sister that he would not to do so.
When asked what his new school had been like, Troy, who is now twenty-three years old, said: "I was doing a lot of drugs. I was real rebellious. I mean, like I said, I had problems going on at home and I'd take that to school and bring problems with me. And I didn't do good at school. Ironically, though, I sort of liked it-I liked being around the people and . . . I just didn't, you know teachers didn't like me."[298]
Troy was fifteen when he murdered his father and was sentenced to life without parole. He told a researcher for this report what his life was like at the time: "[M]e and my dad hadn't gotten along real good since they got divorced and well we probably had never gotten along real good. We had a sort of abusive . . . he was kinda abusive, but I was too . . . I mean I see now that I probably should've just left. It just, it seemed like me and him were just at war with each other. I mean, I really felt like he hated me at the time. I don't know how to explain that. It wasn't right, though, I see that now . . . I think now . . . if he was still alive I would like to meet him, you know give him a chance to, I don't know . . . And you know he was abusive, but like I said there've been a lot of parents who've been abusive . . . You can't have every kid that's abused killing their parents-it just ain't gonna work. And I realize that now."
An investigator in the case said that a friend had brought Troy a jacket a few minutes before the murder, "because it had some shotgun shells in it,"[299] which the prosecution introduced as evidence of premeditation. However,
according to Troy, he and his father had "fought heatedly" that night. He claimed: "[T]he decision to kill him, as much as it was made, was made while we fought, the feeling I guess being that I had to end this."[300] He said, "[I] had been so angry and emotional at the time of the murder that I had been incapable of realizing the consequences of what I was doing, that I would not have a father anymore."[301]
The Supreme Court of Arkansas examined the case and found that the murder was pre-meditated, because "a sheriff's deputy testified that a person had to make a conscious effort to pump the shotgun to fire it," and Troy's sister testified "that he had talked about killing their father for six months to a year."[302] The Court also found that Troy shot his father three times, with two different kinds of ammunition, meaning he had to actually reload, not just pump the gun. The same court record indicated that Troy confessed to shooting his father because he was "mad at him."[303]
After he was interviewed for this report, Troy wrote to explain that despite the fact that he murdered his father, he has the support of his sister and mother. He wrote, "I have a surprising number of friends and family who have kindly offered that I may stay with them if I am released, despite the state's fearful appraisal of me. . . . In spite of the insane thing that I did, I don't know of a single entity, aside from the state . . . who wish for me to stay here. . . . I want to be able to show my appreciation and make amends to people I've hurt . . . I sap time, joy and money from anyone I come into contact with . . . I would more than anything like to be rid of this curse that, by afflicting me, afflicts everyone I care about."[304]
In sharp contrast to the United States' expressed intention to protect the human rights of children, federal law as well as the laws of forty-two individual states in the U.S. permit the sentence of life without parole for child offenders. Indeed, as of this writing, the U.S. Congress was contemplating a new federal law that would increase the number of crimes for which a youth might receive life without parole.[305] Since 1989, no U.S. state that permits the sentence for child offenders has taken any significant stepsto reduce or eliminate it.
Federal and state governments' policy of imposing life without parole sentences on youth offenders violates U.S. constitutional law, which requires both individual states and the federal government to uphold human rights treaties made under the authority of the United States. The U.S. Constitution states:
[A]ll treaties made, or which shall be made, under the authority of the United States shall be the Supreme Law of the Land; and the Judges in every State shall be bound thereby, anything in the Constitution or Law of any State to the contrary notwithstanding.[306]
Upholding this constitutional principle, the U.S. Supreme Court has stated, "[I]nternational law is part of our law, and must be ascertained and administered by the courts of justice of the appropriate jurisdiction. . ."[307] Treaties of the United States have been held to be binding on states independent of the will and power of state legislatures.[308] Human rights treaties, like other treaty obligations of the U.S. government, are similarly binding on state governments.[309] Apart from treaty obligations, international human rights principles are also "instructive" in determining appropriate punishments.[310] Therefore, not only should state officials adhere to the prohibition against life imprisonment without parole for youth offenders, but the federal government has an obligation to support those states, including through federal funding, that may choose to eliminate the sentence in the future.
Practices of Other Countries
The domestic laws and practice of governments worldwide provide a clear measure of global adherence to the CRC's prohibition of the life without parole sentences for children.[311] Out of 154 other countries for which Human Rights Watch was able to obtain data,[312] only three currently have people serving life without parole for crimes they committed as children, and none of those four have more than a handful of cases. The paucity of countries that sentence children to life without parole is not due to their use of even harsher punishments (such as the death penalty) for child offenders. In fact, between 1990 and 2004, only eight countries (including the United States) have reportedly imposed the juvenile death penalty.[313]
For example, not one of the original fifteen member states of the European Union allows children to be sentenced to life without parole.[314] On the African continent, thirty-one countries prohibit life without parole for children in their penal laws.[315] Six other African countries have decided that the sentence cannot be imposed on child offenders under sixteen.[316] In three additional African countries, the sentence is technically possible, but it is not used in practice.[317]
Kenya and Tanzania are the only two countries in Africa where representatives of inter-governmental or non-governmental organizations reported that the sentence is still being imposed on offenders below the age of eighteen. But even these countries are working on improving their practices. Kenya is currently undergoing an extensive constitutional and law reform process, which may eliminate the sentence. In Tanzania, apparently the only recent life without parole sentence for a youth is that of a seventeen-year-old convicted in a highly controversial rape case. His conviction is currently under appeal.[318]
Throughout the world, about fourteen countries have laws allowing for a life sentence to be imposed on youth offenders, although it is not clear in all of these cases whether life means life, or whether parole remains a possibility.[319] O Outside of the United States, we have found only about a dozen child offenders serving such a sentence in three countries. South Africa reportedly has four child offenders serving life without parole sentences,[320] Tanzania has one,[321] and to our knowledge, there are between four and seven youth offenders sentenced to life in prison in Israel as of 2005.[322] In addition, youth can technically receive the sentence under the penal laws of Antigua and Barbuda, Australia, Brunei, Dominica, Kenya, Saint Vincent and the Grenadines, Solomon Islands, and Sri Lanka, but it seems that the sentence is rarely if ever used. Finally, in Burkina Faso and Cuba, the sentence seems to be technically possible for individuals above the age of sixteen, but we know of no instances in which it has been used.[323] Curiously, thirteen of the countries that allow for the sentence can trace their historical ties to the United Kingdom and the English common law tradition of sentencing "for the duration of Her Majesty's pleasure." Yet the source of this tradition, the United Kingdom, abolished the possibility of a life without parole sentence for youth offenders after a seminal decision by the European Court of Human Rights in 1996.[324]
Global consensus against the sentence has become increasingly cohesive and firm. In April 2004, the Commission on Human Rights adopted a resolution "urg[ing] States to ensure that under their legislation and practice neither capital punishment nor life imprisonment without the possibility of release shall be imposed for offences committed by persons below eighteen years of age."[325]
The international rejection of life without parole (as well as the death penalty) for child offenders is so overwhelming that it may have attained the status of customary international law. Once a rule of customary international law is established, that rule becomes binding even on states that have not formally agreed to it.[326] Under domestic U.S. law, customary international law is binding on the government of the United States.[327]
Establishing a rule of customary international law requires two elements: first, widespread and consistent governmental practice and second, a sense of legal obligation, or opinio juris accompanying the practice.[328] The International Court of Justice has said that "a very widespread and representative participation in [a] convention might suffice of itself" to evidence the attainment of customary international law, provided it included participation from "States whose interests were specially affected."[329]As the previous discussion of widespread adherence to the CRC and consistent worldwide refusal to impose the sentence on children indicates, both of these elements exist.[330] The United States, which historically was a leader in promoting juvenile justice reforms, now finds itself far behind the practice of the rest of the world.
The global rarity of life without parole for youth offenders may also be due to the ineffectiveness of the sentence. Harsh juvenile sentences such as life without parole do not appear to offer a deterrent effect to lower the prevalence of homicide offenses among youth. The prevalence of juvenile homicide in a particular country is due to a myriad of factors that are difficult to identify and even more challenging to compare across international boundaries. It is nevertheless the case that the harsh penalties for youth offenders in the U.S., such as life without parole sentences, have not given the United States significantly lower rates of youth crime. During 1999, 10 percent of all homicide offenders in the United States were below the age of eighteen, which means the United States had the third highest percentage in a comparison with twenty-eight European countries in 1999.[331] Ten years earlier, in 1989, children made up 11 percent of all homicide offenders in the United States. If harsh sentencing were the answer to deterring serious and violent juvenile crime, the United States should be among the countries with the lowest percentages of youth murderers, rather than having seen its total number of youth homicide offenders drop by just 1 percent.
Case Study: Kevin C.

Kevin C. was age sixteen in this photo and age seventeen when he committed his crime.
© 2005 Private.
Kevin C. grew up in a financially secure family in Colorado, and was seventeen at the time of his crime. He told a researcher for this report: "There were no problems at home. I lived with my dad, my parents were divorced . . . even though my parents are divorced, they get along."[332] Kevin had been arrested once before and charged as a juvenile for vandalism to a car.[333] According to his mother, he completed his community service satisfactorily. Kevin's father told a researcher for this report what his son was like at the time of the crime, "I have the feeling he was going into the drugs and all that, he was a kid. But I always checked his car, there were never any weapons in there or drug stuff. . . . To kill somebody, to hurt somebody, especially a girl? No way."[334]
His mother said: "He had dyed his hair blonde and just re-painted his bathroom. He was working hard at his job and he loved snowboarding and skiing. He kept a collection of beer cans from around the world. His father and I used to bring him back empty cans from Israel and other places we traveled. He kept the cans lined up on his bedroom window, like any teenage boy would. . . . They used that against him in court!"[335]
According to police investigations, Kevin was involved in the shooting of two Native American girls, one of whom subsequently died.[336] Kevin told a researcher for this report that he and two friends were driving around town one night. They were interested in buying some drugs and needed some money. He told a researcher, "I just went along for the ride." They eventually stopped two Native American girls who had just been given $2,000 "coming of age" money by their tribe.[337] Kevin explained that a "situation" broke out. Some shots were fired. He said, "I never touched a weapon. I never handled a weapon . . . one girl ended up being murdered and the other was injured severely." After his arrest, Kevin's hands tested negative for gunshot residue.[338] Kevin was convicted of felony murder and sentenced to life without parole. Kevin's co-defendant was convicted of first-degree murder and was also sentenced to life without parole.[339]
IX. Conclusion: Life without Parole and the Purposes of Criminal Punishment
Criminal punishment in the United States can serve four goals: rehabilitation, retribution, deterrence, and incapacitation. The effectiveness of any punishment-whether life in prison or a week in jail-should be measured against the yardstick of these four goals and should accord with the widely accepted corollary that no punishment should be more severe than necessary to achieve these stated goals. Sentencing children to life without parole fails to measure up on all counts.
Recognizing that all human rights derive from the inherent dignity of the human being, international human rights law requires that the essential aim of all penal systems must be to allow, encourage, and facilitate rehabilitation.[340] The United States, after a few decades of ignoring this goal, is moving back to recognizing it as crucial to community safety.[341] However, life without parole not only does not further this goal, it negates it. The sentence sends an unequivocal message to youth offenders that they are banished from the community forever, no matter how they change or grow.
Reflecting on his prosecution of Lionel Tate, believed to be the youngest child offender ever to be sentenced in the U.S. to life imprisonment without the possibility of parole, prosecutor Ken Padowitz said: "What I think we should have in a civilized society for a twelve-year-old who is convicted of a heinous and horrible crime, such as the one here, is some hope of rehabilitation, to be able to come out into the community as a productive member of society."[342]
Life without parole discourages youth offenders from attempting to reform themselves in prison. But rehabilitation is also stymied by the special hardships inherent in the life without parole sentence. Youth wrestle with the anger and emotional turmoil of coming to grips with the knowledge they will die in prison. They are denied educational, vocational, and other programs to develop their minds and skills, because correctional authorities reserve these under-funded programs for prisoners who will someday be released. Not surprisingly, child offenders sentenced to life without parole believe that U.S. society has thrown them, and respect for human dignity, away.
When the focus is on rehabilitation, legislators do not face a choice between being "soft on crime" or supporting life without parole for youth offenders. They can save taxpayer dollars, protect community safety, and save youth. As Steve Geller, a Florida state senator who sponsored a bill to provide youth offenders with access to parole, notes, "At least [children] have a chance for redemption . . . They're kids, they have to have punishment and they have to have rehabilitation. But we don't need to ruin their lives forever."[343]
Nevertheless, proponents of harsh sentencing argue that the severity of children's crimes warrants the most punitive sentences possible. Texas Senator Edward Lucio, who authored a bill allowing child offenders to receive life without parole sentences, said:
With the law as it is right now . . . young persons who commit these crimes are guaranteed to be eligible for parole when they reach my age. With the law as it is right now, these offenders who pose a grave risk to the safety of us all can now walk the streets of our communities again . . . Life without parole is the only option in a capital case that provides certainty for the families of victims . . . there are no concerns about parole hearings or early release-it is final, definitive and certain![344]
Other proponents of life without parole believe the sentence is necessary in order to ensure that society mete out the worst punishment for the worst offenses. They look solely to the crime to determine retribution, ignoring the age and culpability of the offender.
Retribution is not, however, simple vengeance. Punishment serves a retributive purpose when it gives the offender his or her "just deserts"[345]-in other words, when the punishment fits the crime. As the Supreme Court has stated, "The heart of the retribution rationale is that a criminal sentence must be directly related to the personal culpability of the criminal offender."[346] In order to achieve this goal of proportionality, both the nature of the offense and the culpability of the offender must be taken into account.
Children can commit the same acts as adults, but by virtue of their immaturity, they cannot be as blameworthy or as culpable. They do not have adults' developed abilities to think, to weigh consequences, to make sound decisions, to control their impulses, and to resist group pressures; their brains are anatomically different, still evolving into the brains of adults. These characteristics of children have long caused people to question whether youth offenders should ever be sentenced to life without parole. As the Supreme Court stated in Roper, the differences between youth and adults "render suspect any conclusion that a juvenile falls among the worst offenders."[347]
Deterrence of future crime is also ill-served by life without parole sentences. Supporters of the life without parole sentence claim that children who pause to consider the consequences before committing homicide will be deterred best if they face harsh sentences, such as life in prison without parole. But research has failed to show that the threat of any adult punishment deters adolescents from crime, given their limited abilities to think rationally or beyond the short-term.[348] Deterrence is also unlikely given that adolescents cannot really grasp the true significance of the sentence.
With regard to the fourth purpose of criminal punishment, that of incapacitation, it clearly makes a direct contribution to public safety to the extent an incarcerated person cannot commit additional crimes in the community. But the need to protect public safety and to incapacitate a particular offender ends once he or she has been rehabilitated. There is no basis for believing that all or even many of the children who receive life without parole sentences would otherwise have engaged in a life of crime. Our research indicates that many child offenders received life without parole for their first offense. There is little in their histories to warrant the assumption that they would not grow up and be rehabilitated if they were spared a lifetime in prison. And even if incapacitation did have a measurable impact on rates of youth violence, this is not an argument for condemning a child offender to life without parole. A fifteen-year-old offender will clearly be a very different person by the time he or she has become a mature adult. Incapacitation as a justification for life without parole sentences falters, because child offenders have the potential to be rehabilitated and become productive members of society.
Teen Offenders Now in Their 50s, 40s, and 30s
|


Some proponents of harsh sentences for children believe such sentences have contributed to the marked decline in violent youth crime nationwide after 1994. Others, however, have noted that where juvenile justice systems have implemented regimes tending more towards rehabilitation than punishment, the fall in youth violence has been even more pronounced. In the District of Columbia, a concerted program of replacing locked detention with community-based alternatives brought real results, as compared with a more punitive policy adopted by the nearby state of Maryland. Under its reform program, the District of Columbia sharply reduced its juvenile detention rate (by 71 percent). During this same period, Maryland slightly increased its juvenile detention rate by 3 percent. Comparing the two different policies towards juvenile crime, D.C.'s violent juvenile crime rate declined by 55 percent-more than three times Maryland's 15 percent decline in its violent juvenile crime rate.[349]
When an individual of any age can be held responsible for his or her actions, failure to bring them to account would deny justice to the victims. However, any criminal action against a child offender should include all internationally accepted safeguards for bringing children to trial. These laws and guidelines recognize the special needs and vulnerabilities of children and place an emphasis on rehabilitation and the reintegration of the child into society, rather than on punishment alone. Child offenders must have an opportunity to evidence rehabilitation and gain parole. Giving youth offenders that second chance would align U.S. sentencing practices with the rest of the world and better protect the rights of its children.
The United States has long acknowledged the differences between the maturity of children and adults by requiring that children reach a given age before they may legally engage in certain activities. These laws use chronological age to set a bright line-no one under eighteen, for example, may vote, no matter how intelligent, responsible, and mature. The use of age as a marker reflects widely shared understandings about when, as a group, children should be deemed mature enough to engage in adult activities. It also reflects the inherent difficulty of determining for any given young person whether he or she is developmentally akin to a young adult, or still a child.
When grave sentences are at issue-such as life without parole-the use of a legislatively-established age line reflects the judgment that the differences "are too marked and well understood to risk allowing a youth [to be treated as an adult] despite insufficient culpability."[350] The risk is especially high if the crime at issue is violent or particularly brutal. Leaving a sentence determination entirely in the hands of the jury carries the "unacceptable likelihood" that "the brutality or cold-blooded nature of any particular crime would overpower mitigating arguments based on youth as a matter of course, even where the juvenile offender's objective immaturity, vulnerability, and lack of true depravity should require a sentence less severe."[351] Even the simple fact of youth, irrespective of the brutality of the crime, may unfairly influence decisions by the jury, as illustrated by the fact that in certain recent years, children who committed murder in the United States were more likely to be given life without parole sentences than adults.
Eighteen is a fair and practical age to set as the line between childhood and adulthood for purposes of criminal sentencing. Although from a biological standpoint, key parts of the brain (including the prefrontal cortex) have not fully reached maturity by that age, most youth of eighteen are well into the process of acquiring the full capacities of adulthood. There is national as well as international consensus that it is fair to hold an eighteen year old as accountable as an adult.[352] As several Supreme Court justices have noted:
Eighteen is the dividing line that society has generally drawn, the point at which it is thought reasonable to assume that persons have an ability to make, and a duty to bear responsibility for their judgments. Insofar as age 18 is a necessarily arbitrary social choice as a point at which to acknowledge a person's maturity and responsibility, given the different developmental rates of individuals, it is in fact a conservative estimate of the dividing line between adolescence and adulthood.[353]
Sentences for offenders who are children-a group society recognizes as uniquely vulnerable and in need of protection in many realms of life-should acknowledge the profound differences between childhood and adulthood. Eighteen should demarcate the age at which offenders may receive the harshest forms of criminal punishment society can impose.
U.S. federal and state governments have the responsibility of protecting public safety, and they use the criminal justice system to do so. Children can and should be held accountable for their crimes. But the government is also responsible for ensuring that justice is in fact served when a person is tried, convicted, and sentenced. Sentences passed on child offenders must reflect the gravity of the crimes they have committed, while acknowledging that they do not possess the maturity and judgment necessary to justify a punishment that brands them permanently irredeemable. Children have a special capacity for transformation. The denial of that possibility should not be part of a juvenile justice system based on human rights principles and standards.
Appendix A: Note on Research Methods
For this report, Human Rights Watch interviewed and corresponded with 335 individuals serving life without parole for crimes they committed as children, and Amnesty International interviewed and corresponded with 40 such individuals. In addition to in-person interviews and correspondence with prisoners, we interviewed parents or other close relatives and spoke with the attorneys for all of the youth offenders we interviewed who had pending appeals.
Prisoners were contacted through an advertisement in the newsletter Prison Legal News or through a direct mailing. We also received suggestions for interviewees from social workers, defense attorneys, and family members. Both organizations sought out and have included here press accounts or court documents that shed additional light on a prisoner's story. However, we have not sought to verify each of the specific allegations made and recognize that some may be embellished or altered in the telling. Nevertheless, the letters and interviews are eloquent testimony to the prisoners' senses of their experiences. Where prisoners' letters are quoted, we have left in place spelling and grammatical errors. As is consistent with our practice when reporting on prison conditions, we use pseudonyms for offenders to protect against the possibility of intimidation or retaliation.
With the much-appreciated assistance of the law firm of O'Melveny and Myers, LLP, Amnesty International conducted detailed research into the laws and standards in the United States applicable to life without parole sentencing, the psychological and neurological differences between youth and adults, and collected and analyzed sentencing records for one of the report's case studies.
Human Rights Watch interviewed judges, defense attorneys, prosecutors, social workers, psychologists, prison authorities, and prison educational specialists in Arkansas, Colorado, California, Florida, Iowa, Illinois, Louisiana, New Jersey, Massachusetts, and Pennsylvania. For an international perspective, Human Rights Watch interviewed criminal defense solicitors in the United Kingdom and visited a juvenile facility there.
Finally, Amnesty International, USA and Human Rights Watch are pleased to announce that the issue of life without parole sentencing for youth in the United States will be a focus of campaigning and advocacy work throughout the country, including by Amnesty International's regional chapters and student groups.
Appendix B: Note on Statistical Methods
When commencing our research for this report, Human Rights Watch discovered that, while the U.S. Department of Justice uses FBI crime statistics to compile data on juvenile crime, and the U.S. Office of Juvenile Justice and Delinquency Prevention compiles data on children in the juvenile justice system, there are no data compiled on child offenders in the adult system. Most states tend to "lose" the fact that an offender was a child at the time of his or her crime once he or she is admitted to adult prison. Consequently, publicly available state reports on incarcerated populations often give the impression that there are no youth offenders in adult prison (or only track individuals by age at admission) and do not offer information about a particular inmate's age at the time of his or her offense.
We find it striking that legislators who passed the laws allowing children to be sentenced to life without parole, governors, state correctional authorities, judges and lawyers, to say nothing of the general public, have had no access to statistical information about the child offenders sentenced to life without parole in their states. Therefore, two primary recommendations of this report are that all state departments of corrections keep accurate statistics about child offenders in adult prisons, including the numbers of individuals sentenced to life without parole for crimes they committed as children, and that the federal government establish and maintain a central depository for this data.
Prior to the collaboration with Amnesty International, Human Rights Watch began conducting statistical research with the hope that the National Corrections Reporting Program (NCRP) would provide the nationwide data we sought on child offenders sentenced to life without parole. The NCRP's objective is to provide a consistent and comprehensive description of prisoners entering and leaving state and federal custody. To accomplish this goal, annual data are gathered from official state prison records on topics such as race, sex, and age of inmates; length of time in jail; length of time in prison; and type of offense committed. The data are collected from the state prison systems of most of the United States, as well as the Federal Prison System, the California Youth Authority, and the District of Columbia.
Unfortunately, the NCRP was not a comprehensive source for the data we sought for at least two reasons. First, the NCRP data revealed youth offenders serving life without parole in only the following states: Alabama, Colorado, Georgia, Kentucky (data from 1980s before eradication of the sentence for juveniles), Maine (data from 1980s before eradication of the sentence), Massachusetts, Michigan, Mississippi, Missouri, Nebraska, Nevada, New Hampshire, New Jersey, North Dakota, Oklahoma, Oregon (data from 1990s before eradication of the sentence for juveniles), Pennsylvania, South Carolina, Tennessee, Virginia, Washington, West Virginia, Wyoming. Whereas we knew that offenders were serving the sentence in additional states, e.g., Florida. Second, the number of youth serving life without parole according to NCRP data differed from the numbers we had gathered directly from some states, e.g., Michigan. Although these two flaws caused us to reject the NCRP data as a source for our national count of youth serving life without parole, we decided to use the available data as a sample, which we analyzed for information we did not request from state departments of corrections, such as the rates of imposition of the life without parole sentence on adult and child murder offenders.We have no basis for believing that the data available in the NCRP is skewed in any particular way that would cause such analyses to be inaccurate.
In late 2003, Human Rights Watch began gathering data directly from the federal government and the departments of corrections in the forty-one states that sentenced children to life without parole at the time of our research. (As noted previously, Texas changed its laws to allow for the sentence in May of 2005.) Our first step was to send letters to all fifty states asking them to send us data on children who committed crimes that resulted in life without parole or very long sentences (i.e., life sentences plus a term of years-"life plus years").[354] In the interest of clarity, we eventually eliminated these long sentence data from our analysis. Therefore, this report only analyzes data relating to children serving the exact sentence of life without parole in the United States (with the exception of Pennsylvania).
Many state departments of corrections do not keep records on an inmate's age at the time he or she committed an offense but only record an individual's age at the time of admission to prison. For those states that claimed they had no data on inmates' ages at offense, we chose to use an age cut-off of nineteen years old at the date of admission as a way to capture all inmates that likely committed their crimes before the age of eighteen. We chose to use nineteen because we assumed that between one and two years could pass between a seventeen-year-old's commission of a crime and his or her arrest, trial, possible subsequent trials (as a result of a hung jury or a mistrial), sentencing, and ultimate admission to prison.[355]
Many states were prompt and very helpful in their responses. Human Rights Watch received data from thirty-five states and the federal government. Although we requested data through the end of 2002, most states simply counted the number of youth offenders serving life without parole in state custody on the date at which they ran the query; therefore, some state datasets include information through mid-2004. From the federal government, Vermont, New Jersey, and Utah, we received responses indicating that, although life without parole is possible in those states, no one is currently serving the sentence for an under-eighteen crime. However, after we received the response from the federal government, we were contacted by one youth offender, who was fifteen at the time of his crime and is serving life without parole in the federal system for his role as a lookout in a conspiracy to commit murder.[356]
Alabama, Idaho, Louisiana, and Virginia informed Human Rights Watch that they were unable to gather statistics for us because of staffing limitations and prohibitive costs. We obtained data for these states through other measures, with the exception of Idaho, for which we have no figures. Human Rights Watch noted that it had received fifteen letters from inmates in Alabama who claimed they were serving life without parole for crimes committed before they turned eighteen. Since Alabama has an on-line inmate locator service, we were able to confirm the sentences and basic biological characteristics of these individuals through cross-checking on-line. Although we therefore cite Alabama as having fifteen child offenders serving life without parole, that figure may well be an undercount. We used a statistical extract from the reports made by the state of Virginia to the National Corrections Reporting Program between the years 1983and 2000 to gather a rough number of individuals serving the sentence in that state. Amnesty International obtained data directly from the Louisiana Department of Corrections with the assistance of Clive Stafford Smith and the Louisiana Crisis Assistance Center.
Finally, Human Rights Watch did not receive replies from the state departments of corrections in Michigan and Illinois. Follow-up phone calls and letters were sent throughout the spring and summer of 2004, to no avail. However, Deborah Labelle, director, and Anna Phillips, research coordinator, of the American Civil Liberties Union Juvenile Life without Parole Initiative in Michigan, had already received data from the Michigan and Illinois departments of corrections in response to requests they had submitted earlier, following criteria very similar to those used by Human Rights Watch. They shared the data they had obtained with us for the purposes of this report.
Appendix C: Sample Letter Soliciting Data from State Correctional Department
December 4, 2003
Mr. / Ms. ___________
Pennsylvania Department of Corrections
Box 598
Camp Hill, PA 17001-0598
Dear __________________:
We are writing to ask your assistance with the development of statistical data on youthful offenders in Pennsylvania who are serving prison sentences of life without parole or life plus years. We are trying to acquire data from each state on the number of such offenders as part of a national study Human Rights Watch is undertaking on the sentencing of juveniles.
We are making this request directly to you because unfortunately, there is no reliable national database containing the information we seek. While the National Corrections Reporting Program (NCRP) contains information on state prison admissions and sentences, our analysis of the NCRP data reveals substantial differences with the figures we have obtained directly from several state correction departments. We are concerned there may be similar problems for other states as well. To ensure the most accurate data possible, we have therefore decided to ask each state to provide us with the information we seek.
We would be very grateful if you could provide us with the following information about offenders who were admitted to the Pennsylvania Department of Corrections for each year between 1983 and 2002:
1. The number of offenders who were under the age of 18 at the time of offense (or arrest) or who were 19 or under at time of admission and who were admitted with sentences of life without parole, and for each such offender:
a. Gender
b. Race
c. Date of birth
d. Age at admission (or age at time of arrest)
e. Offense for which convicted
f. County of offense or residence
g. Current facility in which confined
2. The number of offenders who were under the age of 18 at the time of offense (or arrest) or who were 19 or under at time of admission and who were admitted with sentences of life plus years, and for each such offender:
a. Gender
b. Race
c. Date of birth
d. Age at admission (or age at time of arrest)
e. Offense for which convicted
f. County of offense or residence
g. Current facility in which confined
3. If your privacy rules permit, we would also like to be given the name and department of corrections identification number for each of these offenders.
We hope developing this data will not be burdensome for you. If you can only provide partial statistics, we would be grateful nonetheless. We think it extremely important for the country to have a solid statistical basis for understanding juvenile sentencing and incarceration and we know of no other way to develop an accurate database than to ask each state department of corrections to provide it to us.
If you have any questions about our request, please do not hesitate to contact me, Alison Parker, at [phone/email]. In the meantime, let me thank you in advance for your attention to this request.
Sincerely,
Alison Parker, Esq.
Senior Researcher
Appendix D: State Population Data Table
State |
Youth LWOP Total |
Population 14-17 |
LWOP/Total Population |
Youth LWOP Rate per 100,000 |
Alabama |
15 |
255886 |
0.01% |
5.86 |
Arizona |
30 |
290312 |
0.01% |
10.33 |
Arkansas |
46 |
157466 |
0.03% |
29.21 |
California |
180 |
1960396 |
0.01% |
9.18 |
Colorado |
46 |
245352 |
0.02% |
18.75 |
Connecticut |
10 |
179265 |
0.01% |
5.58 |
Delaware |
7 |
42925 |
0.02% |
16.31 |
Federal |
1 |
Not applicable |
Not applicable |
Not applicable |
Florida |
273 |
819440 |
0.03% |
33.32 |
Georgia |
8 |
468991 |
0.00% |
1.71 |
Hawaii |
4 |
65763 |
0.01% |
6.08 |
Idaho |
data missing |
87361 |
data missing |
data missing |
Illinois |
103 |
712274 |
0.01% |
14.46 |
Indiana |
2 |
352850 |
0.00% |
0.57 |
Iowa |
67 |
175234 |
0.04% |
38.23 |
Louisiana |
317 |
289337 |
0.11% |
109.56 |
Maryland |
13 |
294914 |
0.00% |
4.41 |
Massachusetts |
60 |
324467 |
0.02% |
18.49 |
Michigan |
306 |
578783 |
0.05% |
52.87 |
Minnesota |
2 |
302462 |
0.00% |
0.66 |
Mississippi |
17 |
179246 |
0.01% |
9.48 |
Missouri |
116 |
330235 |
0.04% |
35.13 |
Montana |
1 |
58446 |
0.00% |
1.71 |
Nebraska |
21 |
107285 |
0.02% |
19.57 |
Nevada |
16 |
104267 |
0.02% |
15.35 |
New Hampshire |
3 |
70563 |
0.00% |
4.25 |
New Jersey |
0 |
441687 |
0.00% |
0.00 |
North Carolina |
44 |
416938 |
0.01% |
10.55 |
North Dakota |
1 |
41044 |
0.00% |
2.44 |
Ohio |
1 |
654584 |
0.00% |
0.15 |
Oklahoma |
49 |
211117 |
0.02% |
23.21 |
Pennsylvania |
332 |
673805 |
0.05% |
49.27 |
Rhode Island |
2 |
54268 |
0.00% |
3.69 |
South Carolina |
26 |
226007 |
0.01% |
11.50 |
South Dakota |
9 |
50036 |
0.02% |
17.99 |
Tennessee |
4 |
311047 |
0.00% |
1.29 |
Utah |
0 |
163001 |
0.00% |
0.00 |
Vermont |
0 |
382883 |
0.00% |
0.00 |
Virginia |
48 |
36106 |
0.13% |
132.94 |
Washington |
23 |
346040 |
0.01% |
6.65 |
Wisconsin |
16 |
326079 |
0.00% |
4.91 |
Wyoming |
6 |
33561 |
0.02% |
17.88 |
Nationwide |
2225 |
12821723 |
0.02% |
17.35 |
Source: Data provided to Human Rights Watch from thirty-eight state correctional departments and additional other sources for the states of Alabama and Virginia.
The Hawaii and Virginia data do not include race information. Population data were obtained from the U.S. Census Bureau, State Population Data Sets, available online at: http://www.census.gov/popest/states/asrh/files/SC-EST2003-race6-AL_MO.csv and http://www.census.gov/popest/states/asrh/files/SC-EST2003-race6-MT_WY.csv, accessed on March 4, 2005. Calculations are based on Census 2000 data, using populations between the ages of fourteen and seventeen.
Appendix E: Letters from Five Youth Offenders Serving Life without Parole Sentences in the United States
See the five letters on the following thirty-two pages.
[1]Human Rights Watch telephone interview with Frank C., Colorado, October 22, 2004.
[2] Human Rights Watch interview with Cheryl J., McPherson Unit, Newport, Arkansas, June 24, 2004 (pseudonym). Throughout this report, as indicated, prisoners' names have been concealed through the use of pseudonyms in order to protect their security and privacy. Everyone interviewed for this report was age eighteen or older at the time of the interview.
Human Rights Watch interview with Javier M., Colorado State Penitentiary, Cañon City, Colorado, July 26, 2004 (pseudonym).
[4] Throughout this report, case studies are interspersed to give readers a sense of the actual backgrounds and experiences of youth offenders sentenced to life without parole. The case studies are not intended as illustrations of the issues being addressed in particular chapters.
[5] Circuit Court of Cook County, "Adult Probation Department Pre-Sentencing Investigative Report," July 13, 1994 (on file with Human Rights Watch) ("Pre-Sentencing Investigative Report").
[6] Human Rights Watch interview with Peter A., Stateville Correctional Institution, Joliet, Illinois, April 20, 2005 (pseudonym) (unless otherwise noted, all statements attributed to Peter A. in this case study were obtained during this interview).
[7] "Pre-Sentencing Investigative Report."
[8] Ibid.
[9]Illinois v. Allen, Order Upon Denial of Rehearing, Hon. Thomas Dwyer, May 14, 1997 (on file with Human Rights Watch).
[10] Ibid.
[11] Sentencing order of Judge Dennis Dernback, October 23, 2001 (on file with Human Rights Watch) (The statute requires a life without parole sentence for an individual found guilty of first degree murder of more than one victim irrespective of the defendant's age, including under a theory of accountability. See Illinois Compiled Statute (ILCS) 5/5-8-1).
[12] Human Rights Watch telephone interview with Dennis Doherty, November 22, 2004.
[13] "Pre-Sentencing Investigative Report"; Letter from James W. Fry, President, Blackstone Paralegal Studies, Inc., November 13, 2001 (on file with Human Rights Watch).
[14] Letter from Peter A. to Human Rights Watch, Stateville Correctional Institution, Joliet, Illinois, March 18, 2004 (pseudonym) (on file with Human Rights Watch).
[15]Although the criminal justice system was harsh, compassionate societal attitudes toward child offenders tempered the outcomes-prosecutors frequently decided not to prosecute accused children, and juries often refused to convict them when a draconian sentence would result. See Randall G. Shelden and Michelle Hussong, "Juvenile Crime, Adult Adjudication, and the Death Penalty: Draconian Policies Revisited," Justice Policy Journal, vol. 1, no. 2 (Spring 2003).
[16] Barry C. Feld, "The Juvenile Court Meets the Principle of the Offense: Legislative Changes in Juvenile Waiver Statutes," Criminal Law & Criminology, vol. 78, no. 471 (1987), p. 474.
[17] Anthony M. Platt, The Child Savers: The Invention of Delinquency, 2nd ed. (Chicago: University of Chicago Press, 1977), p. 3-4, 138.
[18] See Howard N. Snyder and Melissa Sickmund, Juvenile Offenders and Victims: 1999 National Report (U.S. Department of Justice, Office of Justice Programs, Office of Juvenile Justice and Delinquency Prevention, September 1999), p. 86, available online at:http://www.ncjrs.org/html/ojjdp/nationalreport99/toc.html, accessed on September 13, 2005 (Juvenile Offenders and Victims: 1999 National Report).
[19]In Kent v. U.S., 383 U.S. 541, 566-67 (1996), the Supreme Court articulated the eight factors juvenile courts were to weigh in transfer hearings: "1) The seriousness of the alleged offense to the community and whether the protection of the community requires waiver; 2) Whether the alleged offense was committed in an aggressive, violent, premeditated or willful manner; 3) Whether the alleged offense was against persons or against property, greater weight being given to offenses against persons especially if personal injury resulted; 4) The prosecutive merit of the complaint, i.e., whether there is evidence upon which a Grand Jury may be expected to return an indictment to be determined by consultation with the United States Attorney; 5) Thedesirability of trial and disposition of the entire offense in one court when the juvenile's associates in the alleged offense are adults who will be charged with a crime in the U.S. District Court for the District of Columbia; 6) The sophistication and maturity of the juvenile as determined by consideration of his home, environmental situation, emotional attitude and pattern of living; 7) The record and previous history of the juvenile, including previous contacts with the Youth Aid Division, other law enforcement agencies, juvenile courts and other jurisdictions, prior periods of probation to this Court, or prior commitments to juvenile institutions; and 8) The prospects for adequate protection of the public and the likelihood of reasonable rehabilitation of the juvenile (if he is found to have committed the alleged offense) by the use of procedures, services and facilities currently available to the Juvenile Court."
The National Center for Juvenile Justice, "Juvenile Arrest Rates by Offense, Sex, and Race (1980-2002)," August 1, 2004, available online at: http://ojjdp.ncjrs.org/ojstatbb/crime/excel/JAR_20040801.xls, accessed on: July 2, 2005.
[21] James Alan Fox, "Homicide Trends in the United States: 2000 Update" (U.S. Department of Justice, Bureau of Justice Statistics, January 2003), available online at: http://www.ojp.usdoj.gov/bjs/pub/pdf/htus00.pdf, accessed on September 13, 2005. See also Franklin E. Zimring, American Youth Violence (New York: Oxford University Press, 1999).
[22] John DiIulio, How to Stop the Coming Crime Wave (New York: Manhattan Institute, 1996), p. 1.
[23] House Committee on Economic and Educational Opportunities, Subcommittee on Early Childhood, Youth and Families, Hearings of the Juvenile Justice and Delinquency Prevention Act, Serial no. 104-68, 104th Congress, 2nd session., 1996, p. 90 ("Statement of Rep. Bill McCollum, chairman, Subcommittee on Crime, House Judiciary Committee").
[24] See Howard N. Snyder, Juvenile Arrests 2003 (Juvenile Justice Bulletin, Office of Juvenile Justice and Delinquency Prevention, August 2005), p. 9, available online at: http://www.ncjrs.gov/html/ojjdp/209735/contents.html, accessed on September 13, 2005.
[25]Juvenile Offenders and Victims: 1999 National Report, p. 89.
[26] The following states have automatic transfer provisions: Alabama, Alaska, Arizona, Delaware, Florida, Georgia, Idaho, Illinois, Indiana, Iowa, Louisiana, Maryland, Massachusetts, Minnesota, Mississippi, Montana, Nevada, New Mexico, New York, Oklahoma, Oregon, Pennsylvania, South Carolina, South Dakota, Utah, Vermont, Washington, and Wisconsin. See Patrick Griffin, et al., Trying Juveniles as Adults in Criminal Court: An Analysis of State Transfer Provisions (U.S. Department of Justice, Office of Justice Programs, Office of Juvenile Justice and Delinquency Prevention, December 1998) p. 1, available online at: http://ojjdp.ncjrs.org/pubs/tryingjuvasadult/toc.html, accessed on September 13, 2005 (Trying Juveniles as Adults in Criminal Court).
[27] The following jurisdictions give prosecutors discretion to file directly in adult court: Arizona, Arkansas, Colorado, District of Columbia, Florida, Georgia, Louisiana, Massachusetts, Michigan, Montana, Nebraska, Oklahoma, Vermont, Virginia, and Wyoming. See Trying Juveniles as Adults in Criminal Court, p. 1.
[28] See Trying Juveniles as Adults in Criminal Court, p. 1. For example, before exercising direct file authority to prosecute juveniles as adults in Nebraska and Wyoming, prosecutors are required to give consideration to the same kinds of enumerated "factors" that are ordinarily weighed by juvenile courts making waiver determinations. Ibid. The federal government requires all cases filed against juveniles to proceed through a hearing to determine whether prosecution should continue in criminal court, in which several factors are weighed and written findings are entered into the record before prosecution may proceed. See 18 U.S.C. 403, Sec. 5032. Florida weighs the scales in favor of trying juveniles in adult court: in specified age or offense categories, prosecutors must either attempt an adult prosecution or provide the juvenile court with written reasons for failing to do so.See Trying Juveniles as Adults in Criminal Court, p.1.
[29] The United States is party to the International Covenant on Civil and Political Rights (ICCPR), which states in article 14 that governments should establish procedures that take "account of [children's] age and the desirability of promoting their rehabilitation." See ICCPR, 999 U.N.T.S. 171, entered into force March 23, 1976, ratified by the United States on September 8, 1992, article 14(3)(g). If more U.S. states insisted upon transfer hearings weighing several factors before a child could be charged in adult court, U.S. obligations under the ICCPR would be better upheld.
[30] In 1996, state prosecutors tried 27,000 child offenders in adult court, of whom 9,760 had been transferred from juvenile court.Bureau of Justice Statistics, Prosecutors in State Courts, available online at: http://www.ojp.usdoj.gov/bjs/pubalp2.htm#P, accessed on July 1, 2005 (Prosecutors in State Courts).In 2000, we estimate 55,000 child offenders were tried in adult court, of whom an estimated 7,100 had been transferred from juvenile court. These estimates are calculated from data contained in the following reports: Trying Juveniles as Adults in Criminal Court; Prosecutors in State Courts; and A. Stahl, H. Snyder, T. Finnegan, Easy Access to Juvenile Court Statistics: 1985-2000 (Pittsburgh: National Center for Juvenile Justice (producer); Washington, D.C.: Office of Juvenile Justice and Delinquency Prevention (distributor), 2002), available online at: http://www.ojjdp.ncjrs.org/ojstatbb/ezajcs, accessed on July 1, 2005.
[31] Convention on the Rights of the Child (CRC), Art. 40(3)(b).
[32] CRC, Art. 40(4).
[33] A competent defendant is one who has a basic understanding of the roles of her own and opposing attorneys; comprehends the functions of the judge and jury; is able to consult with her attorney in a meaningful way; and can weigh the consequences of the decisions she has to make, such as whether or not to accept a plea. See, e.g.,, Dusky v. United States, 362 U.S. 402 (1960).
[34] Phase I of the MacArthur study occurred between 1997 and 2002 and involved an examination of 927 children aged eleven to seventeen who were compared with a group of 466 young adults aged eighteen to twenty-four. Half of the children and half of the young adults were in jail or juvenile detention centers when they were tested, and half were not. The study used two main instruments to measure competency. The first, the MacCAT-CA, measures responses along three subscales: understanding, reasoning, and recognition of the relevance of information. The second instrument, MacJEN, measures responses to vignettes that present legal scenarios and choices. MacJEN also has three subscales: risk appraisal, future orientation, and resistance to peer influence. The study controlled for characteristics of the respondents such as social class and intelligence. SeeThomas Grisso, Laurence Steinberg, Jennifer Woolard, Elizabeth Cauffman, Elizabeth Scott, Sandra Graham, Fran Lexcen, N. Dickon Reppucci, Robert Schwartz, "Juveniles' Competence to Stand Trial," Law and Human Behavior, vol. 27 (2003) ("Juveniles' Competence to Stand Trial").
[36] American Civil Liberties Union (ACLU) Michigan Life without Parole Project interview with Gary C., Tamms Supermax Correctional Facility, Tamms, Illinois, September 21, 2004 (on file with Human Rights Watch).
[37] Human Rights Watch telephone interview with Mr. Tom Carberry, October 25, 2004. Carberry is Thomas' appeals attorney. According to Carberry, Elkins allowed "her faith" to affect her professional judgment. Human Rights Watch also interviewed Thomas M., Colorado State Penitentiary, Cañon City, Colorado, July 27, 2004 (pseudonym) (Human Rights Watch interview with Thomas M.).
[38] Human Rights Watch interview with Clifford S., Maximum Security Unit, Tucker, Arkansas, June 22, 2004 (pseudonym).
[39] Human Rights Watch telephone interview with Dennis Doherty, November 22, 2004. In another apparent example of a youth offender not understanding what was at stake during his trial, Donald Lambert, who was fifteen at the time of his crime, decided to forgo a trial and plead guilty to first degree murder, resulting in a life without parole sentence, after a conference with his attorney that lasted "somewhere between five and twenty minutes." See Lambert v. Blodgett, 393 F.3d 943 (9th Cir. Mar. 2, 2004).
[40] Bishop, Donna M. et al. "The Transfer of Juveniles to Criminal Court: Does it make a difference?" Crime & Delinquency, vol. 42, no. 2 (April 1996).
[41] Vincent Shiraldi and Jason Ziedenberg, "The Florida Experiment: Transferring Power from Judges to Prosecutors," American Bar Association, Criminal Justice Magazine, vol. 15, issue 1 (Spring 2000) ("The Florida Experiment: Transferring Power from Judges to Prosecutors").
[42] Human Rights Watch interview with Samantha L., Iowa Correctional Institute for Women, Mitchellville, Iowa, April 5, 2004 (pseudonym) (unless otherwise noted, all statements attributed to Samantha L. in this case study were obtained during this interview).
[43]State v. Nebinger, 412 N.W.2d 180 (Iowa Ct. App., 1987) (finding no abuse of discretion by trial court in finding defendant guilty of first degree murder and first degree robbery of a seventy-nine-year-old man and showing that Nebinger attempted to argue that Samantha L. was guilty of the crime).
[44] These states are: Alabama, Arizona, Arkansas, Colorado, Connecticut, Delaware, Florida, Georgia, Idaho, Illinois, Iowa, Louisiana, Maryland, Massachusetts, Michigan, Minnesota, Missouri, Nebraska, New Hampshire, North Carolina, Pennsylvania, Rhode Island, South Carolina, South Dakota, Virginia, Washington, and Wisconsin.
[45] All data discussed in this chapter are on file with Human Rights Watch. Please see Appendix B for a detailed description of research and statistical methods.
[46] Each state department of corrections has its own method for coding the type of crime committed by its prisoners. Some states break homicide crimes down into categories (e.g., first degree murder, second degree murder, etc.), and some simply group all homicide crimes into the general category of "murder." Moreover, in many states the category of "first degree murder" or "murder" includes both intentional homicide and the felony crime described in the text as "felony murder." Therefore, a variety of codes or offense terms are used by states to describe the crime for which each incarcerated individual was convicted. This makes it difficult to determine which types or sub-categories of youth crimes tended to result in a life without parole sentence.
[47] This sample was derived from a survey of 281 letters received by Human Rights Watch from youth offenders across the United States, 172 of whom gave detailed explanations of their role in the crime. These prisoners serving life without parole who wrote to Human Rights Watch were a self-selected group, not a random sample. We did not expressly ask for information about the level of culpability of the offender (i.e., whether the individual was or was not the "triggerperson" in a felony murder crime), and therefore prisoners were not aware that this was a question we were interested in, so it is possible that we received more correspondence from those individuals who felt their sentence was disproportionate. In particular, it is possible that individuals serving life without parole for felony murder convictions were more likely to write to Human Rights Watch out of a belief that their sentence was unfair.
[48] "Thrown Away: Children Sentenced to Life without Parole in Colorado," A Human Rights Watch Report, February 2005, p.18-19.
[49]Second Chances: Juveniles Serving Life without Parole in Michigan Prisons (ACLU of Michigan, 2004), p.4, available online at: www.aclumich.org/pubs/juvenilelifers.pdf, accessed on September 13, 2005.
[50] This percentage reflects the gender of child offenders serving life without parole in thirty-nine out of the forty-two states that impose the sentence. We had no data from Idaho and no data on the gender of youth offenders from Virginia.
[51] For example, male youths are about thirteen times more likely to be arrested for murder than females. U.S. Department of Justice, Office of Juvenile Justice and Delinquency Prevention, "Juvenile Offenders and Victims," National Report Series, December 2001, available online at: http://www.ncjrs.org/html/ojjdp/nrs_bulletin/nrs_2001_12_1/contents.html, accessed on September 13, 2005.
[52] Eileen Poe-Yamagata and Jeffrey A. Butts, "Female Offenders in the Juvenile Justice System: Statistics Summary" (Office of Juvenile Justice and Delinquency Prevention, June 1996), p. 13, available online at: http://nicic.org/Library/013515, accessed on September 13, 2005.
[53] The gender and crime of its child offenders serving life without parole in Virginia are not included because the state did not provide us with that data.
[54] This sample was derived from a survey of 281 letters received by Human Rights Watch from youth offenders across the United States, 96 of whom gave detailed explanations of their previous criminal offense history. These prisoners serving life without parole who wrote to Human Rights Watch were a self-selected group, not a random sample. We did not expressly ask for information about offenders' previous criminal histories, and therefore prisoners were not aware that this was a question we were interested in, so it is possible that we received more correspondence from those individuals who felt their sentence was unfair. In particular, it is possible that individuals serving life without parole for their first criminal offense were more likely to write to Human Rights Watch because of this sense of receiving an unfair sentence.
[55] We are aware of only one offender in our sample who was previously convicted as an adult of first degree murder before the first degree murder crime that led to his sentence of life without parole.
[56] Human Rights Watch telephone interview with Mitchell Strutin, October 28, 2004. See also Pennsylvania v. Pelzer, 531 Pa. 235 (May 29, 1992).
[57]Pennsylvania v. Daniels, 531 Pa. 210, 217 (Penn. S. Ct., May 29, 1992).
[58]Pennsylvania v. Pelzer, 531 Pa. 235 (May 29, 1992).
[59] Ibid.
[60] Letter to Human Rights Watch from Stacey T., Chester, Pennsylvania, May 20, 2004 (on file with Human Rights Watch).
[61] The number of known murder offenders is the best proxy for the number of youth convicted of murder, because specific data for murder convictions of youth offenders does not exist. "Known murder offenders" is a term used by criminal justice professionals and includes not only all individuals arrested for murders (including all degrees of murder and felony murder) but also individuals identified by witnesses or reliably identified as perpetrators but not arrested (usually because the offender was killed). For more information on the methods by which known offenders are classified, see "Easy Access to the FBI's Supplementary Homicide Reports: 1980-2000," U.S. Department of Justice, Office of Juvenile Justice and Delinquency Prevention, available online at: http://ojjdp.ncjrs.org/ojstatbb/ezashr/asp/methods.asp, accessed on July 22, 2005.
[62] There are no published data that identify the number of adults receiving life without parole sentences in the United States. We used as a proxy the number of adult offenders entering prison with life without parole sentences for murder convictions. The proxy should be extremely close to the actual number, since only death or some other extraordinary development would prevent someone sentenced to life without parole from actually entering prison.
[63] Letter to Human Rights Watch from Jose A., United States Penitentiary Allenwood, White Deer, Pennsylvania, March 9, 2004 (on file with Human Rights Watch).
[64] Native Americans constitute .8 percent, and Asian Americans are .9 percent of the total number of youth offenders serving life without parole sentences. Note that the 2000 Census used separate categories for race (White, Black, American Indian, Hawaiian, and Asian) and ethnicity (Hispanic or Latino and non-Hispanic or Latino). Therefore, all people who identified themselves as Hispanic, regardless of their race identification are counted in the Hispanic populations. Those people who identified themselves as White-Hispanic are also counted in the White population; those people who identified themselves as Black-Hispanic are also counted in the Black population; and so on.
[65] After combing existing datasets on crime rates, Human Rights Watch spoke with Tom Zelenock, the project leader of the National Archive of Criminal Justice Data project at the University of Michigan's Inter-University Consortium for Political and Social Research. He stated that Uniform Crime Reports (UCR) Data provide state break-downs of overall race of offenders and state break-downs of age of offenders, but UCR data does not provide a state break-down of the race of offenders of (or below) a particular age. This is a widely acknowledged shortcoming in the data. Zelenock said he is sure people have tried to extract juvenile race data and have "done it incorrectly," because it is just not possible from data currently collected in the United States. Human Rights Watch telephone interview with Tom Zelenock, on March 24, 2005.
[66] See., e.g., Eileen Poe-Yamagata and Michael A. Jones, And Justice for Some (Building Blocks for Youth Initiative for the National Council on Crime and Delinquency, 2000), available online at: http://www.buildingblocksforyouth.org/justiceforsome/jfs.html, accessed on September 14, 2005 (finding that youth of color are overrepresented and receive disparate treatment at every stage of the juvenile justice system); Mike Males and Dan Macallair, The Color of Justice: An Analysis of Juvenile Adult Court Transfers in California (Justice Policy Institute, Building Blocks for Youth Initiative, Feb. 2000), available online at: http://www.buildingblocksforyouth.org/colorofjustice/coj.html, accessed on September 14, 2004 (The Color of Justice) (showing that youth of color are 8.3 times more likely than white youth to be sentenced by an adult court to imprisonment in a California Youth Authority facility); Jolanta Juszkiewicz, Youth Crime/Adult Time: Is Justice Served? (Pretrial Services Resource Center, Building Blocks for Youth Initiative, Oct. 2000) available online at: http://www.buildingblocksforyouth.org/ycat/ycat.html, accessed on September 14, 2005 (showing over-representation and disparate treatment of youth of color in the adult system and questioning the fairness of prosecuting youth as adults).
[67] "Betraying the Young: Children in the U.S. Justice System" (Amnesty International, November 20, 1998), available online at: http://web.amnesty.org/library/Index/engAMR510601998, accessed on September 14, 2005.
[68] Donna Bishop and Charles Frazier, A study of race and juvenile processing in Florida, a report submitted to the Florida Supreme Court Racial and Ethnic Bias Study Commission, 1990 (cited in he Color of Justice).
[69] In both Table 7 and Figure 7, we included only those states that had at least one child offender of each race in the rate comparisons.
[70] U.S. National Library of Medicine and U.S. Institutes of Health, "Fluoxetine, brand names Prozac, Sarafem," MedlinePlus Drug Information, available online at: http://www.nlm.nih.gov/medlineplus/druginfo/medmaster/a689006.html, accessed on April 15, 2005.
[71] In October 2004, the U.S. Food and Drug Administration (FDA) asked antidepressant manufacturers to include warnings about possible side effects, specifically suicidal tendencies in children taking these medications. In a press statement, the FDA stated: "Pediatric patients being treated with antidepressants for any indication should be closely observed for clinical worsening, as well as agitation, irritability, suicidality, and unusual changes in behavior, especially during the initial few months of a course of drug therapy, or at times of dose changes, either increases or decreases." See FDA Public Health Advisory, "Suicidality in Children and Adolescents Being Treated With Antidepressant Medications," October 15, 2004, available online at: http://www.fda.gov/cder/drug/antidepressants/SSRIPHA200410.htm, accessed on September 15, 2005.
[72] Letter to Human Rights Watch from Emily F., Iowa Correctional Institute for Women, Mitchellville, Iowa, March 13, 2004 (pseudonym) (on file with Human Rights Watch). Human Rights Watch was also contacted by a young man serving a life without parole sentence in Alabama and his mother, both of whom link his criminal offense to the fact that he was on an antidepressant medication at the time.
[73]Iowa v. Fetters, 562 N.W.2d 770 (Iowa Ct. App. Feb. 26 1997).
[74] Ibid.
[75]Ibid.
[76] Ibid.
[77] See, e.g., Elizabeth Cauffman and Laurence Steinberg, "(Im)maturity of Judgment in Adolescence: Why Adolescents May Be Less Culpable Than Adults," Behavioral Science and Law, vol. 18, (2000), p. 742-43.
[78] See, e.g., William Gardner and Janna Herman, "Adolescent's AIDS Risk Taking: A Rational Choice Perspective," Adolescents in the AIDS Epidemic, William Gardner, et al., eds., (San Francisco: Jossey Bass, 1990), p. 17, 25-26 ("Adolescent's AIDS Risk Taking"); Marty Beyer, "Recognizing the Child in the Delinquent," Kentucky Child Rights Journal, vol. 7 (Summer 1999), p. 16-17.
[79]See Meghan M. Deerin, "The Teen Brain Theory," Chicago Tribune, August 12, 2001, p. C1 (citing Russell Barkley, professor of psychiatry and neurology at the University of Massachusetts Medical School).
[80] Catherine C. Lewis, "How Adolescents Approach Decisions: Changes over Grades Seven to Twelve and Policy Implications," Child Development, vol. 52 (1981) p. 538, 541-42 (noting that subjects in grades seven and eight considered future consequences only 11 percent of the time) ("How Adolescents Approach Decisions").
[81] See "Adolescent's AIDS Risk Taking" (concluding that adolescents often focus only on short-term implications of their actions, while ignoring long-term negative consequences); Barbara Kaban and Ann E. Tobey, "When Police Question Children: Are Protections Adequate?" Juvenile Center Child and Courts, vol. 1 (1999), p. 151, 155 (concluding that "research supports the notion that adolescents' failure to consider long-term consequences may compromise youthful decision making. A failure to consider consequences may be due to a lack of understanding of the consequences as well as a failure to consider them."); Marty Beyer, "Immaturity, Culpability & Competency in Juveniles: A Study of 17 Cases," Summary of Criminal Justice, vol.15, no. 27 (2000) ("Immaturity, Culpability & Competency in Juveniles"); "How Adolescents Approach Decisions," p. 541 (reporting results of an empirical study of juvenile decision-making which found that only 11 percent of seventh-eighth graders, 25 percent of tenth graders, and 48 percent of twelfth graders considered long-term consequences when making significant medical decisions).
[82] See Thomas Grisso, "What We Know About Youth's Capacities," Youth on Trial: A Developmental Perspective on Juvenile Justice, Thomas Grisso and Robert G. Schwartz, eds. (Chicago: University of Chicago Press, 2000), p. 267-69 (reviewing literature on effects of emotion on children's cognitive capacities).
[83] See e.g., Kim Taylor-Thompson, "States of Mind/States of Development," Stanford Law and Policy Review, vol. 14 (2003), p. 155, fn. 107-108 (reviewing research on effects of stress on juvenile decision-making) ("States of Mind/States of Development").
[84] "Immaturity, Culpability & Competency in Juveniles," p. 27. See also "States of Mind/States of Development," p. 153.
Human Rights Watch interview with Gregory C., Colorado State Penitentiary, Cañon City, Colorado, July 2, 2004 (pseudonym).
See, e.g., Jeffrey Arnett, "Reckless Behavior in Adolescence: A Developmental Perspective," Developmental Review, vol. 12 (1992), p. 339; Charles E. Irwin, Jr., "Adolescence and Risk Taking: How are They Related?" Adolescent Risk Taking , Nancy J. Bell and Robert J. Bell, eds. (Thousand Oaks: SAGE Publications, January 1993), p. 7.
See, e.g., Jay N. Giedd, et al., "Brain Development During Childhood and Adolescence: A Longitudinal MRI Study," Nature Neuroscience, vol. 2 (1999), p. 861 (discussing an MRI study of the brains of 145 children, images taken up to five times per child over ten years); Kenneth K. Kwong, et al., "Dynamic Magnetic Resonance Imaging of Human Brain Activity During Primary Sensory Stimulation," Proceedings of the National Academy of Science, vol. 89 (1992), p. 5675.
Bruce Bower, "Teen Brains On Trial: The Science Of Neural Development Tangles With The Juvenile Death Penalty," Science News Online, vol. 165, no. 19 (May 8, 2004), available online at: http://www.sciencenews.org/articles/20040508/bob9.asp, accessed on September 14, 2005.
Ibid. See also Elkhonon Goldberg, The Executive Brain: Frontal Lobes and the Civilized Mind (New York: Oxford University Press, 2001), p. 434; Allan L. Reiss, et al., "Brain Development, Gender and IQ in Children: A Volumetric Imaging Study," Brain, vol. 119 (1996), p. 1768; Elizabeth R. Sowell, et al., "Mapping Continued Brain Growth and Gray Matter Density Reduction in Dorsal Frontal Cortex: Inverse Relationships During Postadolescent Brain Maturation," Journal of Neuroscience, vol. 21 (2001), p. 8821.
[90]See Daniel R. Weinberger, "A Brain Too Young For Good Judgment," The New York Times, March 10, 2001, p. A13.
[91] Ibid.
See, e.g., Jan Glascher and Ralph Adolphs, "Processing of the Arousal of Subliminal and Supraliminal Emotional Stimuli by the Human Amygdala," Journal of Neuroscience, vol. 23 (2003), p. 10274.
National Juvenile Defender Center, Adolescent Brain Development and Legal Culpability, April 2003 (quoting Dr. Deborah Yurgelun-Todd of Harvard Medical School).
Gargi Talukder, "Decision-Making is Still a Work in Progress for Teenagers," July 2000, available online at: www.brainconnection.com, accessed on July 22, 2005.
[95] Ibid.
[96] Human Rights Watch interview with Alexis V., Iowa Correctional Facility for Women, Mitchellville, Iowa, April 5, 2004 (pseudonym) (unless otherwise noted, all statements attributed to Alexis V. in this case study were obtained during this interview).
[97]Human Rights Watch telephone interview with Lee Ann Veal, April 29, 2005 (Interview with Lee Ann Veal).
[98] Human Rights Watch telephone interview with Mike Dryden, former residential youth counselor at Forest Ridge home, Iowa, March 4, 2005.
[99] Human Rights Watch telephone interview with Thomas Ferguson, November 22, 2004.
[100] Interview with Lee Ann Veal.
[101]Letter to Human rights Watch from Alexis V., Iowa correctional Institution for Women, Mitchellville, Iowa, March 29, 2004 (on file with Human Rights Watch).
[102]SeeIowa v. Veal, 564 N.W.2d 797 (Iowa S. Ct. May 21 1997).
[103] Interview with Lee Ann Veal.
[104] Ibid.
[105] The states of Alabama, Illinois, and Louisiana were unable or unwilling to provide us with data on youth offenders' ages at admission to prison.
[106] Craig Haney, "Psychology and the Limits to Prison Pain: Confronting the Coming Crisis in Eighth Amendment Law," Psychology, Public Policy and Law, vol. 3 (December 1997), p. 499 ("Psychology and the Limits to Prison Pain")
[107] Letter to Human Rights Watch from male prisoner in Lapeer, Michigan, July 23, 2004 (on file with Human Rights Watch).
[108] For documentation of increased effects, see, e.g., Stanton Wheeler, "Socialization in Correctional Communities," American Sociological Review, vol. 26 (1961), p. 697; Peter Garabedian, "Social Role and Processes of Socialization in the Prison Community," Social Problems, vol. 11 (1963), p. 140. For documentation of decreased effects, see, e.g., Robert Johnson and Hans Toch, "The First Cut is the Deepest: Psychological Breakdown and Survival in the Detention Setting," The Pains of Imprisonment (Thousand Oaks: SAGE Publications, 1982); "Psychology and the Limits to Prison Pain," p. 499.
[109] Letter to Human Rights Watch from Jacob O., Washington State Penitentiary, Walla Walla, Washington, March 26, 2004 (pseudonym) (on file with Human Rights Watch).
[110] Human Rights Watch interview with Thomas M.
[111] Human Rights Watch interview with Matthew C., Colorado State Penitentiary, Cañon City, Colorado, July 27, 2004 (pseudonym).
[112]Iowa v. Smith, Smith, Privitt, and Speaks, 546 N.W.2d 916, 923 (Iowa S.Ct. Apr. 17, 1996).
[113] Human Rights Watch interview with Dean F., Anamosa State Penitentiary, Anamosa, Iowa, April 6, 2004 (pseudonym) (unless otherwise noted, all statements attributed to Dean F. in this case study were obtained during this interview).
[114] "Teen's Defense to Take the Stage in Hauser Murder Trial," Telegraph Herald, September 23, 1996.
[115] "Prosecution Begins Smith Case," Telegraph Herald, June 13, 1996.
[116]Iowa v. Speaks, 576 N.W.2d 629 (Iowa Ct. Appeals Jan. 28, 1998).
[117]Iowa v. Speaks, 576 N.W.2d 629 (Iowa Ct. Appeals Jan. 28, 1998).
[118] "Prosecution Begins Smith Case," Telegraph Herald, June 13, 1996 (quoting prosecutor Tom Miller, who said Dean went up to the victim's car, then walked back to the Blazer before the attack began). See also Iowa v. Privitt, 571 N.W.2d 484 (Iowa S. Ct., Nov. 26, 1997) (One of Dean's co-defendant's trials in which the court establishes that only two of the boys were involved in the fatal confrontation at the victim's car).
[119] Human Rights Watch telephone interview with Tom Miller, November 22, 2004.
[120] Human Rights Watch telephone interview with Heather Taylor, Iowa, October 27, 2004. However, Taylor told Human Rights Watch that she believed that her friend (Alexis V., who is featured elsewhere in this report) had "really grown up in prison . . . she's such a strong lady, such a strong girl. And she really carries herself well. She's doing real good in there now." Ibid.
[121] Institute on Crime, Justice and Corrections and the National Council on Crime and Delinquency, Juveniles in Adult Prisons and Jails: A National Assessment (U.S. Department of Justice, Office of Justice Programs, Bureau of Justice Assistance, October 2000), p. 63, available online at: http://www.ncjrs.org/pdffiles1/bja/182503-1.pdf, accessed on September 14, 2005 (Juveniles in Adult Prisons and Jails).
[122] Human Rights Watch interview with Trent H., Cummins Unit, Grady, Arkansas, June 23, 2004 (pseudonym).
[123] Human Rights Watch interview with Treatment Director at Iowa Correctional Institute for Women, Mitchellville, Iowa, April 5, 2004.
[124] Ibid.
[125] Human Rights Watch telephone interview with Dennis Burbank, Administrative Officer III, Colorado State Penitentiary, December 1, 2004.
[126] Human Rights Watch interview with Jackson W., East Arkansas Regional Unit, Brickeys, Arkansas, June 21, 2004 (pseudonym).
[127] See, e.g., Colorado Department of Corrections, Administrative Regulation 600-02 (stating at ¶ IV(A)(4) that membership in a "security threat group" is one of five factors that "may be considered in initiating placement in administrative segregation").
[128] Human Rights Watch interview with Ethan W., Colorado State Penitentiary, Cañon City, Colorado, July 28, 2004 (pseudonym).
[129] See, e.g., "Out of Sight: Supermaximum Security Confinement in the United States," A Human Rights Watch Report, vol. 12, no. 1(G), February 2000; "Red Onion State Prison: Supermaximum Security Confinement in Virginia," A Human Rights Watch Report, vol. 11, no. 1(g), May 1999; Human Rights Watch, Cold Storage: Supermaximum Security Confinement in Indiana, 1997; Amnesty International "Conditions in H-Unit, Oklahoma State Penitentiary", May 1994; Amnesty International, "Rights For All", October 1998, chapter 4, p 73-78; Amnesty International, "Cruel and inhuman treatment in Virginia supermaximum security prisons," May 2001; Amnesty International, "Amnesty International condemns housing minors in Wisconsin supermax prison", July 2001.
[130] For adults, U.S. courts have questioned arbitrary placement into isolation, the length of isolation time imposed, and conditions in the isolation cell. See Juveniles in Adult Prisons and Jails, p. 25 (citing Harris v. Maloughney, 827 F. Supp. 1488 (D. Mont. 1993); McCray v. Burrell, 516 F.2d 357 (4th Cir. 1975); Lareau v. MacDougal, 473 F.2d 974 (2d Cir. 1972)).
[131] Human Rights Committee, General Comment 20, Article 7 (Forty-fourth session, 1992), Compilation of General Comments and General Recommendations Adopted by Human Rights Treaty Bodies, U.N. Doc. HRI\GEN\1\Rev.1 at 30 (1994), para. 6.
[132] European Committee for the Prevention of Torture and Inhuman or Degrading Treatment or Punishment (CPT), "Second General Report on the CPT's Activities," Strasbourg, France, April 1992, p. 15.
[133]Human Rights Watch interview with Troy L., Cummins Unit, Grady, Arkansas, June 23, 2004 (pseudonym).
[134] Ibid.
[135] Letter to Human Rights Watch from Warren P., Marion Correctional Institute, Lowell, Florida, March 2, 2004 (pseudonym) (on file with Human Rights Watch).
[136] "Psychology and the Limits to Prison Pain," p. 499 (citing Creasie Hairston, "Family Ties during Imprisonment: Important to Whom and for What?" Journal of Sociology and Social Welfare, vol. 18, (1991), p. 87).
[137] "Psychology and the Limits to Prison Pain," p. 499 (citing Judith Herman, "Complex PTSD: A Syndrome in Survivors of Prolonged and Repeated Trauma," Journal of Traumatic Stress, vol. 5 (1992), p. 377).
[138] Letter to Human Rights Watch from Addison R., Oaks Correctional Facility, Eastlake, Michigan, March 20, 2004 (pseudonym) (on file with Human Rights Watch).
[139] Letter to Human Rights Watch from Jeffrey B., Somerset Prison, Somerset, Pennsylvania, March 10, 2004 (pseudonym) (on file with Human Rights Watch).
[140] Letter to Human Rights Watch from John E., State Correctional Institution, Dallas, Pennsylvania, March 15, 2004 (pseudonym).
[141] Colorado Department of Corrections, "Offender Visiting Program," available online at: www.doc.state.co.us/visitors/visitors.htm, accessed on October 24, 2004.
[142] Human Rights Watch interview with Ethan W., Colorado State Penitentiary, Cañon City, Colorado, July 28, 2004 (pseudonym) (on file with Human Rights Watch).
[143] See, e.g., elsewhere in this report, Human Rights Watch interview with Luke J., Colorado State Penitentiary, Cañon City, Colorado, July 27, 2004 (pseudonym); and with Alexis V., Iowa Correctional Institute for Women, Mitchellville, Iowa, April 2004 (pseudonym).
[144] "Psychology and the Limits to Prison Pain," p. 499 (citing R.J. Sapsford, "Life Sentence Prisoners: Psychological Changes During Sentence," British Journal of Criminology vol. 18, no. 128 (1978)).
[145] Letter to Human Rights Watch from Brandon S, Ionia Maximum Facility, Ionia, Michigan, March 22, 2004 (pseudonym) (on file with Human Rights Watch).
[146] Lindsay M. Hayes, Prison Suicide: An Overview and Guide to Prevention (National Center on Institutions and Alternatives, June 1995) available online at: http://www.nicic.org/pubs/1995/012475.pdf, accessed on September 14, 2005.
[147] Human Rights Watch interview with Luke J., Colorado State Penitentiary, Cañon City, Colorado, July 27, 2004 (pseudonym).
[148] Human Rights Watch interview with Richard I., East Arkansas Regional Unit, Brickeys, Arkansas, June 21, 2004 (pseudonym).
[149] Human Rights Watch interview with Ethan W., Colorado State Penitentiary, Cañon City, Colorado, July 28, 2004 (pseudonym).
[150]Juveniles in Adult Prisons and Jails, p. 43.
[151] Ibid., p. 36 (emphasis in original).
[152] Human Rights Watch interview with Richard I., East Arkansas Regional Unit, Brickeys, Arkansas, June 21, 2004 (pseudonym).
[153] Ibid.
[154] Human Rights Watch interview with Clifford S., Maximum Security Unit, Tucker, Arkansas, June 24, 2004 (pseudonym).
[155] Human Rights Watch interview with Scott J., Centennial Correctional Facility, Cañon City, Colorado, June 27, 2004 (pseudonym). Scott explained that he was jailed with adults for three or four days, after which he was transferred to a juvenile detention center in Colorado's Jefferson County.
[156] American Correctional Association (ACA), Public Correctional Policy on Youthful Offenders Transferred to Adult Criminal Jurisdiction, Delegate Assembly, Congress of Correction, Nashville, Tennessee, August 21, 1996 (unanimously ratified), available online at: http://www.aca.org/pastpresentfuture/winter_2004_policiespage1.asp, accessed on September 14, 2005.
[157] See Juvenile Justice and Delinquency Prevention Act (JJDPA), 1974. While the ACA references the JJDPA's requirements in its standards, the JJDPA does not apply to youth in adult facilities who are being prosecuted as adults in state court.
[158] See Convention on the Rights of the Child, G.A. Res. 44/25, U.N. Doc. A/RES/44/25, (entered into force September 2, 1990), Article 37b, (stating "every child deprived of liberty shall be separated from adults unless it is considered in the child's best interest not to do so."). Article 13.4 of the United Nations Standard Minimum Rules for the Administration of Juvenile Justice (the "Beijing Rules"), G.A. Res. 40/33, Annex, 40 U.N. GAOR Supp. (No 53) at 207, U.N. Doc. A/40/53 (1985) and Article 26 of the United Nations Rules for the Protection of Juveniles Deprived of their Liberty (the "UN Rules"), G.A. Res. 45/113, Annex, 45 U.N. GAOR Supp. (no. 49A) at 205, U.N. Doc. A/45/49 (1990) (requiring separation of children from adults in distinct institutions or in separate parts of a single institution).
[159] Human Rights Watch interview with Clifford S., Maximum Security Unit, Tucker, Arkansas, June 22, 2004 (pseudonym).
[160] Letter to Human Rights Watch from Stacey T., Chester, Pennsylvania, September 8, 2004 (pseudonym) (on file with Human Rights Watch).
[161] Letter to Human Rights Watch from Warren P., Marion Correctional Institute, Lowell, Florida, March 2, 2004 (pseudonym) (on file with Human Rights Watch).
[162] Letter to Human Rights Watch from Gerard C., Tucker, Arkansas, March 15, 2004 (pseudonym) (on file with Human Rights Watch).
[163] Human Rights Watch telephone interview with Linda Shephard, Programs Officer, Arkansas Department of Corrections, July 18, 2005.
[164] See The Higher Education Act, Title VIII, Sec. D, "Grants to States for Workforce and Community Transition Training for Incarcerated Youth".
[165] Letter to Human Rights Watch from Cleveland B., Springville, Alabama, March 29, 2004 (pseudonym) (on file with Human Rights Watch).
[166] Human Rights Watch interview with Joe L., Limon Correctional Facility, Limon, Colorado, May 28, 2004 (pseudonym).
[167] Letter to Human Rights Watch from Darby B., Ionia Maximum Facility, Ionia, Michigan, March 1, 2004 (pseudonym) (on file with Human Rights Watch).
[168] Letter to Human Rights Watch from Holman C., Springville, Alabama, March 3, 2004 (pseudonym) (on file with Human Rights Watch).
[169] Letter to Human Rights Watch from Cindy J., Wetumpka, Alabama, March 17, 2004 (pseudonym) (on file with Human Rights Watch).
[170] Letter to Human Rights Watch from Angela B., McCloud, Oklahoma, August 13, 2004 (pseudonym) (on file with Human Rights Watch).
[171] Human Rights Watch telephone interview with Dinah Tyler, spokeswoman, Arkansas Department of Corrections, October 2004; Human Rights Watch interview with treatment director at Iowa Correctional Institute for Women, Mitchellville, Iowa, April 5, 2004; Human Rights Watch telephone interview with Susan McNaughton, press secretary, Pennsylvania Department of Corrections, October 2004; Human Rights Watch telephone interview with Margot Bach, public information officer, California Department of Corrections, November 3, 2004.
[172] Human Rights Watch telephone interview with Dinah Tyler, Arkansas Department of Corrections Public Information, October 2004.
[173] Human Rights Watch interview with treatment director at Iowa Correctional Institute for Women, Mitchellville, Iowa, April 2004.
[174] Human Rights Watch telephone interview with Susan McNaughton, Pennsylvania Department of Corrections Press Secretary, October 2004.
[175] Ibid.
[176] Pennsylvania Department of Corrections, "Teaching Inmates to Work," March 2005, available online at: http://www.cor.state.pa.us/stats/lib/stats/ci.pdf, accessed on April 1, 2005.
[177] "Amenability Determination," Southern Reception Center and Clinic, December 17, 1991 (on file with Human Rights Watch).
[178] Letter to Human Rights Watch from Darryl T., California Correctional Institution, Tehachapi, California, March 20, 2004 (pseudonym) (on file with Human Rights Watch).
[179] Human Rights Watch telephone interview with Margot Bach, Public Information Officer, California Department of Corrections, November 3, 2004.
[180] U.N. Rules for the Protection of Juveniles Deprived of their Liberty, G.A. Res. 45/113, annex, 45 U.N. GAPR Supp. (no. 49A) at 205, U.N. Doc. A/45/49, (1990), para. 12 (stating "children should be guaranteed the benefit of meaningful activities and programs which would serve to promote and sustain their health and self-respect, to foster their sense of responsibility and encourage those attitudes and skills that will assist them in developing their potential as members of society").
[181] U.N. Standard Minimum Rules for the Treatment of Prisoners, Adopted August 30, 1955, by the First United Nations Congress on the Prevention of Crime and the Treatment of Offenders, U.N. Doc. A/CONF/611, annex I, E.S.C. res. 663C, 24 U.N. ESCOR Supp. (no. 1) at 11, U.N. Doc. E/3048 (1957), amended E.S.C. res. 2076, 62 U.N. ESCOR Supp. (no. 1) at 35, U.N. Doc. E/5988 (1977), art. 77(1) and 78.
[182] Letter to Human Rights Watch from Trey J., Limon Correctional Facility, Limon, Colorado, March 1, 2004 (pseudonym) (on file with Human Rights Watch). Human Rights Watch also interviewed Trey in person on May 28, 2004 at Limon Correctional Facility, Limon, Colorado.
[183] Ibid.
[184] Statistics on sexual violence in U.S. prisons reveal a serious problem with all kinds of violence, especially since sexual violence is so severely underreported. The U.S. Bureau of Justice Statistics reported that there were 3.15 allegations of sexual violence per every 1,000 inmates in 2004. See Allen J. Beck and Timothy A. Hughes, Sexual Violence Reported by Correctional Authorities, Bureau of Justice Statistics, Office of Justice Programs, July 2005, available online at: http://www.ojp.usdoj.gov, accessed on August 1, 2005.
[185] Martin Forst et al., "Youth in Prisons and Training Schools: Perceptions and Consequences of the Treatment-Custody Dichotomy," Juvenile & Family Court, vol. 4 (1989), p. 9. See also Jason Ziedenberg & Vincent Schiraldi, "The Risks Juveniles Face When They Are Incarcerated with Adults" (Justice Policy Institute, July 1997), available online at: http://www.cjcj.org/jpi/risks.html, accessed on April 15, 2005.
[186] See ICCPR, art. 7; Convention on the Rights of the Child, art. 37.
[187] Letter to Human Rights Watch from Michael S., Kinross Correctional Facility, Kincheloe, Michigan, March 22, 2004 (pseudonym) (on file with Human Rights Watch).
[188] Human Rights Watch interview with Joe L., Limon Correctional Facility, Limon, Colorado, May 28, 2004 (pseudonym).
[189] Letter to Human Rights Watch from Javier M., Colorado State Penitentiary, Cañon City, Colorado, March 8, 2004 (pseudonym) (on file with Human Rights Watch).
[190] Letter to Human Rights Watch from Gregory C., Colorado State Penitentiary, Cañon City, Colorado, March 13, 2004 (pseudonym) (on file with Human Rights Watch).
[191] Human Rights Watch interview with Jackson W., East Arkansas Regional Unit, Brickeys, Arkansas, June 21, 2004 (pseudonym).
[192] Letter to Human Rights Watch from Andrew H., Frackville, Pennsylvania, February 17, 2004 (pseudonym) (on file with Human Rights Watch).
[193] Letter to Human Rights Watch from Patricia L., Central California Women's Facility State Prison, Chowchilla, California, July 14, 2004 (pseudonym) (on file with Human Rights Watch).
[194] Human Rights Watch interview with Richard I., East Arkansas Regional Unit, Brickeys, Arkansas, June 21, 2004 (pseudonym).
[195] Ibid.
[196] See Amnesty International, "Not Part of My Sentence, Violations of the Human Rights of Women in Custody," March 1999; "Nowhere to Hide: Retaliation Against Women in Michigan State Prisons," A Human Rights Watch Report, vol. 10 no. 2(G), September 1998; and Human Rights Watch, All Too Familiar: Sexual Abuse of Women in U.S. State Prisons (New York: Human Rights Watch, 1996).
[197] See Standard Minimum Rules for the Treatment of Prisoners, Rule 53 (female prisoners should be attended and supervised only by female officers; male staff such as doctors and teachers may provide professional services in female facilities, but should always be accompanied by female officers); Principles for the Protection of All Persons Under Any Form of Detention, Principle 5(2) (special measures which are designed solely to protect the rights and special status of women are not considered discriminatory).
[198] Letter to Human Rights Watch from Carolyn K., Central California Women's Facility State Prison, Chowchilla, California, April 18, 2004 (pseudonym) (on file with Human Rights Watch).
[199] Human Rights Watch interview with Cheryl J., McPherson Unit, Newport, Arkansas, June 24, 2004 (pseudonym).
[200] Ibid.
[201] Ibid.
[202] Human Rights Watch interview with Charles L., Varner Unit, Arkansas, June 22, 2004 (pseudonym).
[203]Human Rights Watch, No Escape: Male Rape in U.S. Prisons, (New York: Human Rights Watch, April 2001), p. 70.
[204] Letter to Human Rights Watch from Brian B., Albion, Pennsylvania, August 28, 2004 (pseudonym) (on file with Human Rights Watch).
[205] Letter to Human Rights Watch from Warren P., Marion Correction Institute, Lowell, Florida, March 2, 2004 (pseudonym) (on file with Human Rights Watch).
[206] Letter to Human Rights Watch from Tyler Y., Sterling, Colorado, March 16, 2004 (pseudonym) (on file with Human Rights Watch).
[207] Letter to Human Rights Watch from Eric R., Saginaw Correctional Facility, Freeland, Michigan, March 18, 2004 (pseudonym) (on file with Human Rights Watch).
[208] Human Rights Watch interview with Luke J., Colorado State Penitentiary, Cañon City, Colorado, July 27, 2004 (pseudonym).
[209] Human Rights Watch interview with Trent H., Cummins Unit, Grady, Arkansas, June 22, 2004 (pseudonym).
[210] Letter to Human Rights Watch from Addison R., Oaks Correctional Facility, East Lake, Michigan, March 20, 2004 (pseudonym) (on file with Human Rights Watch).
[211] Letter to Human Rights Watch from Jeffrey W., David Wade Correctional Center, Homer, Louisiana, April 26, 2004 (pseudonym) (on file with Human Rights Watch).
[212] See, e.g., ACA, Protective Custody (1982); Lockwood, Prison Sexual Violence (1980); Human Rights Watch, No Escape (2001), p. 136 (cataloging a number of empirical studies documenting the incidence and nature of sexual violence in prison).
[213] Human Rights Watch, No Escape (2001), p. 143.
[214] Ibid., p. 144-6.
[215] See, e.g., Michele D. Buisch, "Budget Cuts Present Challenge to Many State Correctional Agencies," Corrections Today, December 2003; Erin M. Samolis, "Divergent Clockwork Oranges: The Juvenile Justice Systems of the United States and Great Britain," University of Chicago Law School Roundtable, vol. 8 (2001), p. 189; Barry C. Feld, "Juvenile and Criminal Justice Systems' Responses to Youth Violence," Crime and Justice, vol. 24, (1998), p. 189; "Psychology and the Limits to Prison Pain," p.499.
[216] Letter to Human Rights Watch from Cindy J., Wetumpka, Alabama, March 18, 2004 (pseudonym) (on file with Human Rights Watch).
[217] Human Rights Watch interview with Samantha L, Iowa Correctional Institute for Women, Mitchellville, Iowa, April 2004 (pseudonym).
[218] Human Rights Watch interview with Charles L, Varner Unit, Arkansas, June 22, 2004 (pseudonym).
[219] Human Rights Watch interview with Nelson H., Buena Vista Correctional Facility, Buena Vista, Colorado, July 28, 2004 (pseudonym).
[220] Letter to Human Rights Watch from Troy L., Grady, Arkansas, undated, received July 2004 (pseudonym) (on file with Human Rights Watch).
[221] Human Rights Watch interview with Thomas M.
[222] Letter to Human Rights Watch from Bradley W., Norfolk, Massachusetts, September 12, 2004 (pseudonym) (on file with Human Rights Watch).
[223]All details of Timothy's childhood abuse were obtained in a May 2005 Human Rights Watch telephone interview with Marty Marsh, Timothy's psychologist in the Iowa Department of Corrections. Human Rights Watch also interviewed Timothy at Anamosa State Penitentiary, Anamosa, Iowa, on April 6, 2004 (pseudonym). In addition, we obtained Timothy's permission to publish his story, per a letter dated August 29, 2005.
[224] Ibid.
[225] Ibid.
[226] Ibid.
[227] U.S. Constitution, Eighth Amendment.
[228] See, e.g. Solem v. Helm, 463 U.S. 277 (1983). But see Ewing v. California, 538 U.S. 11 (2003) (rejecting Ewing's claim that his sentence was grossly disproportionate under the Eighth Amendment and reasoning that California's practice of enhancing sentences under its "three strikes" law served the state's legitimate goal of deterring and incapacitating repeat offenders).
[229]Roper v. Simmons, 125 S.Ct. 1183, 1195 (2005).
[230] Ibid.
[231] Ibid.
[232]Roper v. Simmons, 125 S.Ct. 1183, 1196 (2005).
[234] See, e.g., Lorillard Tobacco Co. v. Reilly, 533 U.S. 525, 587 (2001) (concluding that children "lack the judgment to make an intelligent decision about whether to smoke") (Kennedy, J., concurring, Souter, J., concurring in part, Stevens, J., concurring in part); Parham v. J.R., 442 U.S. 584 (1979) (concluding that children have no due process rights to notice and a judicial hearing before being committed by their parents to a mental institution, and explaining that "parents possess what a child lacks in maturity, experience, and capacity for judgment required for making life's difficult decisions . . . Most children, even in adolescence, simply are not able to make sound judgments concerning many decisions, including their need for medical care or treatment." A plurality of the Court cited this language approvingly in Troxel v. Granville, 530 U.S. 57, 68 (2000) (plurality opinion), a case involving visitation rights of grandparents); Belotti v. Baird 443 U.S. 622, 634 (1979) (plurality opinion) (holding that judges may authorize abortions for minors without parental consent,since constitutional rights of children and adults are unequal due to the "peculiar vulnerability of children," and "their inability to make critical decisions in an informed, mature manner..."); Planned Parenthood of Central Missouri v. Danforth, 428 U.S. 52, 95 (1976) (Stevens, J., partially concurring and partially dissenting) (recognizing that "[b]ecause he may not foresee the consequences of his decision, a minor may not make an enforceable bargain. He may not lawfully work or travel where he pleases, or even attend exhibitions of constitutionally protected adult motion pictures. Persons below a certain age may not marry without parental consent."); Ginsberg v. New York, 390 U.S. 29 (1968) (refusing to strike down a New York statute prohibiting the sale of obscene publications to those under age seventeen, because "at least in some precisely delineated areas, a child ... is not possessed of that full capacity for individual choice which is the presupposition of First Amendment guarantees") (Stewart, J., concurring).
[236]Ibid.
[238] The Indiana Supreme Court opinion included a footnote stating: "Indiana law provides that a child under the age of sixteen who commits a murder cannot be sentenced to death or life imprisonment without parole." Ind. Code § 35-50-2-3(b) (1998).
[239]Trowbrigde v. State, 717 N.E.2d 138, 150 (Ind. 1999) (finding consideration of age consistent with an Indiana statute prohibiting life in prison without parole sentences for youth under sixteen. See Ind. Code § 35-50-2-3(b) (2004)).
[240] See Ind. Code § 2-13-3 (2004).
[241]People v. Miller, 781 N.E.2d 300, 303 (Ill. 2002).
[242] Ibid.
[243] See 730 ILCS § 5/3-6-3 (1998).
[244] John L. Patterson, "Alternative Penalty," Kansas City Star, February 19, 2004, at B1.
[245] Jim Hughes, "Parole Fight For Juveniles Changes Course," Denver Post, March 4, 2005.
[246] See Florida Senate Bill 446 and House Resolution 689. See generally Beth Reinhard, "Parole Denied for Kids Who Get Life," Miami Herald, April 1, 2004, p. 1A; Mark Hollis, "Panel Opposes Sentencing Revisions," South Florida Sun-Sentinel,April 1, 2004, p. 5B.
[247]Harris v. Wright, 93 F.3d 581, 585 (9th Cir. 1996).
[248]Harris v. Wright, 93 F.3d 581, 584-5 (9th Cir. 1996).
[249]Rice v. Cooper, 148 F.3d 747, 752 (7th Cir. 1998).
See e.g., State v. Pilcher, 655 So. 2d 636, 644 (La. Ct. App. 1995) (holding life sentence without possibility of parole for fifteen-year-old murderer was not unconstitutional under the Eighth Amendment); Swinford v. State, 653 So. 2d 912, 918 (Miss. 1995) (upholding trial court's sentence of life imprisonment for fourteen-year-old who aided and abetted murder); State v. Garcia, 1997 N.D. 60, 561 (ND 1997) (holding a life sentence without possibility of parole for a sixteen-year-old did not violate Eighth Amendment) cert. denied, 118 S. Ct. 193 (1997); State v. Massey, 60 Wash. App. 131 (Wash Ct App 1990) (finding no cause to create a distinction between a thirteen-year-old juvenile and an adult who are sentenced to life imprisonment without parole for first degree aggravated murder) cert. denied by Massey v. Washington, 499 U.S. 960 (1991); State v. Foley, 456 So. 2d 979, 984 (La. 1984) (affirming life sentence without parole of fifteen-year-old convicted of rape against assertion it was cruel and unusual punishment); White v. State, 374 So. 2d 843, 847 (Miss. 1979) (upholding a sixteen-year-old's sentence of life imprisonment without parole for armed robbery against assertion that it was cruel and unusual punishment); People v. Fernandez, 883 P.2d 491, 495 (Colo. Ct. App., 1994).
[251] The sentence is mandated under N.C. Gen. Stat. § 15A-2002.
[252]State v. Green, 502 S.E.2d 819. 832 (N.C. 1998) (internal quotations omitted).
[253]State v. Green, 502 S.E.2d 819. 832 (N.C. 1998).
[254] S.C. Code Ann. § 17-25-45(C)(1) (2004).
[255]State v. Standard, 569 S.E.2d 325, 329 (2002), cert. denied, 537 U.S. 1195 (2003).
[256] Sentencing order of Judge Dennis Dernback, October 23, 2001 (on file with Human Rights Watch) (the statute referenced requires a life without parole sentence for an individual found guilty of first degree murder of more than one victim irrespective of the defendant's age at the time of the offense, including under a theory of accountability, ILCS 5/5-8-1).
[257] Honorable David Scott DeWitt (deceased), excerpt from sentencing transcript in People v. Lashuay, 75th Circuit Court, Midland County, Michigan, June 25, 1984 (on file with Human Rights Watch).
[258]Naovarath v. State, 779 P.2d 944, 947 (Nev. 1989).
[259] Michigan state court judge Eugene Arthur Moore, quoted in Marc Mauer, Ryan S. King, and Malcolm C. Young, The Meaning of 'Life:' Long Prison Sentences in Context, (The Sentencing Project, 2004), p. 18, available online at: www.sentencingproject.org, accessed on July 22, 2005.
[260] Paul Pinkham, "Court upholds life in prison for teenager," Florida Times-Union, February 7, 2002, p. B-1.
[261] Ibid.
[262] Human Rights Watch telephone interview with Paul Rinaldo, New York, July 15, 2005.
[263] Letter to Human Rights Watch from Jose A., United States Penitentiary Allenwood, White Deer, Pennsylvania, March 9, 2004 (pseudonym) (on file with Human Rights Watch).
[264] See U.S. v. Rivera, Case No. 00-1831(L) / 00-1832, 2d Circuit Ct. of Appeals, March 12, 2003; "Four gang members get life in Yonkers killing," Associated Press, December 14, 2000; Brief for Defendant-Appellant, 2002 WL 32145164 (2d Cir 2003).
[265] Brief for Defendant-Appellant, 2002 WL 32145164 (2d Cir 2003) (citing to trial record, A-435, p. 1166-1171).
[266] See "Man sentenced to 50 years in prison in compliance with plea deal," Associated Press, April 26, 2000.
[267] Brief for Defendant-Appellant, 2002 WL 32145164 (2d Cir 2003) (citing to trial record, A-742, quoting Southern District of New York Judge Colleen McMahon).
[268] Human Rights Watch telephone interview with Paul Rinaldo, New York, July 15, 2005.
[269] Margaret K. Rosenheim, Franklin E. Zimring, David S. Tanenhaus, and Bernardine Dohrn, Eds., A Century of Juvenile Justice, (Chicago: University of Chicago, 2001).
[270] General Assembly resolution 1386 (XIV), November 20, 1959. Similarly, the American Convention on Human Rights, Series no. 36, p. 1, Organization of American States, Official Record, OEA/Ser.L/V/II.23, signed by the OAS on November 22, 1969, entered into force July 18, 1978, states in Article 19 "Every minor child has the right to the measures of protection required by his condition as a minor on the part of his family, society, and the state."
[271] The Human Rights Committee has interpreted the ICCPR's provisions on child offenders to apply to all persons under the age of eighteen. Human Rights Committee, General Comment no. 1, Forty-fourth Session (1992), para. 13, in Compilation of General Comments and General Recommendations Adopted by Human Rights Treaty Bodies, HRI/GEN/1/Rev.7, p. 155.
[272] The United States co-sponsored this provision together with Great Britain and India, and it was adopted unanimously. See Marc Bossuyt, Guide to the "Travaux Préparatoires"of the International Covenant on Civil and Political Rights (1987), p. 307.
[273] The ICCPR contains three additional provisions related to juvenile justice. Article 6(5) prohibits imposing the death penalty on persons who committed crimes while under the age of eighteen. Article 10(2), subparagraph b, mandates the separation of accused children from adults and the swift adjudication of their cases. Article 14(1) provides an exception for cases involving children to the general requirement that judgments be made public.
[274] Manfred Nowak, U.N. Covenant on Civil and Political Rights: CCPR Commentary, (1993), p. 266.
[275] Ibid., p. 265.
[276] ICCPR, art. 7, Convention against Torture, art. 16.
[277] In article 37 of the CRC, the prohibition of both capital punishment and life imprisonment without possibility of release are included in the sub-section banning cruel, inhuman or degrading punishments.
[278] See Human Rights Committee, General Comment 9, Article 10 (Sixteenth session, 1982).
[279]Naovarath v. State, 105 Nev. 525, 530-531 (Nev. S. Ct. 1989).
[280] ICCPR, art. 10(1).
[281] "Report on the 1960 Seminar on the Role of Substantive Criminal Law in the Protection of Human Rights and the Purpose and Legitimate Limits of Penal Sanctions," organized by the United Nations in Tokyo, Japan, 1960.
[282] United Nations Treaty Collection, International Covenant on Civil and Political Rights, United States of America: Reservations, para. 5 (emphasis added).
[283] United States, Senate Committee on Foreign Relations Report on the International Covenant on Civil and Political Rights, 31 I.L.M. 645, 651 (1992) ("Although current domestic practice is generally in compliance with these provisions, there are instances in which juveniles are not separated from adults, for example because of the juvenile's criminal history or the nature of the offense. In addition, the military justice system in the United States does not guarantee special treatment for those under 18.").
[284] CRC, art. 37(a), G.A. Res. 44/25, U.N. GAOR, 44th Sess., Supp. no. 49, at 167, U.N. Doc. A/44/736 (1989) (entered into force Sept. 2, 1990), reprinted in 28 I.L.M. 1448, 1470 (emphasis added).
[285] The juvenile death penalty is now prohibited in the United States. Roper v. Simmons, 125 S.Ct. 1183, 1199 (2005) (finding the juvenile death penalty unconstitutional and citing to international standards).
[286] CRC, art. 37(a) (emphasis added).
[287] CRC, art. 37(b).
[288] CRC, art. 40.1.
[289] CRC, art. 40.4.
[290] CRC, art. 37(d).
[291] United Nations Treaty Collection Database, available online at: http://untreaty.un.org/, accessed on July 16, 2004. Malaysia registered a reservation to art. 37(a) as follows: "The Government of Malaysia . . . declares that the said provisions shall be applicable only if they are in conformity with the Constitution, national laws and national policies of the Government of Malaysia." Ibid. The government of Myanmar made a broad objection to Article 37, which it later withdrew after other states protested. Ibid. The government of Singapore has maintained a declaration regarding Article 37. However, the declaration does not address the prohibition on life imprisonment without parole. Singapore's declaration reads: "The Republic of Singapore considers that articles 19 and 37 of the Convention do not prohibit-(a) the application of any prevailing measures prescribed by law for maintaining law and order in the Republic of Singapore; (b) measures and restrictions which are prescribed by law and which are necessary in the interests of national security, public safety, public order, the protection of public health or the protection of the rights and freedom of others; or (c) the judicious application of corporal punishment in the best interest of the child." A number of states have interpreted the declaration as a reservation and objected to it as contrary to the object and purpose of the Convention. See UN Treaty Collection Database (Germany: Sept. 4, 1996: Belgium: Sept. 26, 1996; Italy: Oct. 4, 1996; The Netherlands: Nov. 6, 1996; Norway: Nov. 29, 1996; Finland: Nov. 25, 1996; Portugal: Dec. 3, 1996; Sweden: Aug. 1997). In the Roper decision, the United States Supreme Court took special note of the fact that no state party to the CRC made a reservation to the prohibition against the juvenile death penalty contained in Article 37. Roper v. Simmons, 125 S.Ct. 1183, 1199 (2005).
[292] According to the United Nations' agency for children, UNICEF, Somalia is currently unable to ratify the CRC because it lacks a recognized government. See UNICEF, "Frequently Asked Questions," available online at: http://www.unicef.org/crc/faq.htm#009, accessed on July 19, 2004.
[293] The United States signed the CRC on February 16, 1995, and Somalia signed on May 2, 2002.
[294] See Vienna Convention on the Law of Treaties, art. 18, concluded May 23, 1969, 1155 U.N.T.S. 331 (entered into force Jan. 27, 1980). Although the United States has signed but not ratified the Vienna Convention on the Law of Treaties, it regards this convention as "the authoritative guide to current treaty law and practice." S. Exec. Doc. L., 92d Cong., 1st sess. (1971), p. 1; Theodor Meron, "The Meaning and Reach of the International Convention on the Elimination of All Forms of Racial Discrimination," American Journal of International Law, vol. 79 (1985), p.283. The U.S. government has also accepted that it is bound by customary international law not to defeat a treaty's object and purpose. See e.g., "Albright Says U.S. Bound by Nuke Pact; Sends Letters to Nations Despite Senate Vote," Washington Times, (November 2, 1999), p. A1 (describing the Clinton administration's acceptance of obligations under the Comprehensive Test Ban Treaty despite the Senate's failure to ratify).
[295] U.S. Supreme Court Justice Antonin Scalia, in his dissent in the Roper case, implied that adherence to the CRC's prohibition on sentencing youth to life without parole would be necessary if the United States is "truly going to get in line with the international community." See Roper v. Simmons, 125 S.Ct. 1183, 1226 (2005) (Scalia, J. dissenting).
[296] "Remarks by Ambassador Madeline K. Albright, United States Permanent Representative to the United Nations on the Occasion of the Signing of the U.N. Convention on the Rights of the Child," U.S. Press Release, (February 16, 1995).
[297] "Statement by Ambassador Betty King, United States Representative on the Economic and Social Council, to the Plenary of the 54th Session of the General Assembly on the Tenth Anniversary of the Convention on the Rights of the Child," November 11, 1999, available online at: http://www.un.int/usa/99_112.htm, accessed on July 22, 2005.
[298] Human Rights Watch interview with Troy L., Cummins Unit, Grady, Arkansas, June 23, 2004 (pseudonym) (unless otherwise noted, all statements attributed to Troy L. in this case study were obtained during this interview).
[299]McClure v. Arkansas, 942 S.W.2d 243, (Arkansas, April 7, 1997).
[300] Letter to Human Rights Watch from Troy L., undated, received July 2004 (pseudonym) (on file with Human Rights Watch).
[301] Ibid.
[302] Elizabeth Mcfarland, "High Court Affirms; Murder Thought-Out," Arkansas Democrat-Gazette, February 27, 1998.
[303] Ibid.
[304] Letter to Human Rights Watch from Troy L., undated, received July 2004 (pseudonym) (on file with Human Rights Watch).
[305] U.S. House Bill, H.R. 1279, which increased the number of crimes subject to mandatory minimum sentences, including life without parole, and criminalized several non-violent drug offenses, was passed on May 11, 2005. As of this writing, the U.S. Senate was considering its own, less punitive version of this bill, S. 155.
[306] U.S. Constitution, Article VI, clause 2.
[307]The Paquete-Habana, 175 U.S. 677, 700 (1900). See also Murray v. The Charming Betsy, 6 U.S. (2 Cranch) 64, 118 (1804) (statutes "can never be construed to violate . . . rights . . . further than is warranted by the law of nations"); Harold Honju Koh, "Is International Law Really State Law?," Harvard Law Review, vol. 111(1998), p. 1824 (noting that customary international law is federal common law and preempts inconsistent state practices).
[308] See Asakura v. City of Seattle, 265 U.S. 332 (1924) (holding that a treaty made under the authority of the United States stands on the same footing of supremacy as do the provisions of the Constitution and laws of the United States and "operate[s] of itself without the aid of any legislation, state or national; and it will be applied and given authoritative effect by the courts"). See also Maiorano v. Baltimore & Ohio R. R. Co., 213 U. S. 268, 272, (1888); Baldwin v. Franks, 120 U.S. 678, (1887); Head Money Cases, 112 U. S. 580, 598 (1884); Chew Heong v. United States, 112 U. S. 536, 540 (1884); Foster v. Neilson, 2 Pet. 253, 314 (1829).
[309] Jordan J. Paust, "Self-Executing Treaties," American Journal of International Law, vol. 82 (1988), p. 760 (explaining that when John Jay was Secretary of Foreign Affairs of the Confederation in 1787, he reported to Congress that a treaty "made, ratified and published by Congress, ... immediately [became] binding on the whole nation, and superadded to the laws of the land"). See also Asakura v. City of Seattle 265 U.S. 332, 341 (1924) ("The rule of equality established by [the treaty] cannot be rendered nugatory in any part of the United States by municipal ordinances or state laws. It stands on the same footing of supremacy as do the provisions of the Constitution and laws of the United States. It operates of itself without the aid of any legislation, state or national; and it will be applied and given authoritative effect by the courts."). Article 50 of the ICCPR provides that the provisions of the Covenant "shall exten[d] to all parts of federal States without any limitations or exceptions." The Human Rights Committee, in its General Comment 31 on the Nature of the General Legal Obligation on States Parties to the Covenant, states:
The obligations of the Covenant in general and article 2 in particular are binding on every State Party as a whole. All branches of government (executive, legislative and judicial), and other public or governmental authorities, at whatever level-national, regional or local-are in a position to engage the responsibility of the State Party. The executive branch that usually represents the State Party internationally, including before the Committee, may not point to the fact that an action incompatible with the provisions of the Covenant was carried out by another branch of government as a means of seeking to relieve the State Party from responsibility for the action and consequent incompatibility. This understanding flows directly from the principle contained in article 27 of the Vienna Convention on the Law of Treaties, according to which a State Party "may not invoke the provisions of its internal law as justification for its failure to perform a treaty." . . . In this respect, the Committee reminds States Parties with a federal structure of the terms of article 50, according to which the Covenant's provisions "shall extend to all parts of federal states without any limitations or exceptions." Human Rights Committee, General Comment 31, Nature of the General Legal Obligation on States Parties to the Covenant, U.N. Doc. CCPR/C/21/Rev.1/Add.13 (2004), para. 4 (emphasis added).
[310] See Roper v. Simmons, 125 S.Ct. 1183, 1215 (2005) ("Yet at least from the time of the Court's decision in Trop [1958], the Court has referred to the laws of other countries and to international authorities as instructive for its interpretation of the Eighth Amendment's prohibition of "cruel and unusual punishments."); Atkins v. Virginia, 536 U.S. 304, 317 (2002); Trop v. Dulles, 356 U.S. 86, 102-103 (1958) (plurality opinion) (stating "the civilized nations of the world are in virtual unanimity" with the court's assessment that the punishment of statelessness is contrary to evolving standards of decency).
[311] For example, Egypt's 1996 Children's Code, which was intended to bring national legislation in line with the CRC, includes a prohibition on life imprisonment for juveniles. See Government of Egypt, Children's Code, Art. 111, 112 (1996). Egypt ratified the CRC on Feb. 5, 1990. Mali's 2002 Child Protection Ordinance does not allow sentences above eighteen years to be imposed on persons who commit crimes while under the age of eighteen. See Ordonnance N°02-062/P-RM Du 05 Juin 2002 portant code de protection del'enfant,available online at: http://www.justicemali.org/doc107.htm, accessed on July 22, 2005. Mali ratified the CRC on Sep. 20, 1990. Cape Verde's new Constitution of 1992 prohibits life imprisonment or imprisonment of an indefinite duration for anyone. See Constitution of Cape Verde, Art. 31 (1992) ("There shall not be, in any circumstances, a penalty depriving of liberty, or security measure of a permanent character or with an unlimited or indefinite duration."), available online at: http://confinder.richmond.edu/CapeVerde.htm, accessed on July 22, 2005. The Constitution was revised again in 1999, but this language was maintained. Constitution of Cape Verde, Art. 32 (1992), available online at: http://www.parlamento.cv/ constituicao/const00.htm, accessed on July 22, 2005. Cape Verde acceded to the CRC on June 4, 1992. Sao Tome and Principe's 1990 Constitution prohibits life imprisonment of minors. See U.N. Committee on the Rights of the Child, Consideration of Reports Submitted by States Parties Under Article 44 of the Convention: Sao Tome and Principe, CRC/C/8/Add.43, para. 63, 369 (March 4, 2003). Sao Tome and Principe acceded to the CRC on May 14, 1991. Eritrea's Transitional Penal Code prohibits life imprisonment of juveniles. See U.N. Committee on the Rights of the Child, Consideration of Reports Submitted by States Parties Under Article 44 of the Convention: Eritrea, CRC/C/41/Add.12, para. 74 (December 23, 2002). Eritrea ratified the CRC on Aug. 3, 1994. In 2003, Morocco increased the age of majority from sixteen to eighteen in the Penal Code and Criminal Procedure Code, which ensured that the pre-existing prohibition on life sentences for minors covered all persons who committed crimes while under the age of eighteen. See U.N. Committee on the Rights of the Child, Consideration of Reports Submitted by States Parties Under Article 44 of the Convention: Morocco, CRC/C/93/Add.3, para. 234-35 (February 12, 2003) (indicating that such revisions were currently pending); U.N. Committee on the Rights of the Child, Summary Record of the 882nd Meeting, CRC/C/SR.882, para. 58 (July 16, 2003); U.N. Committee on the Rights of the Child, Concluding Observations: Morocco, CRC/C/15/Add.211, para 3, 72 (July 10, 2003) (confirming that the revisions referred in the text had been passed into law). Morocco ratified the CRC on June 21, 1993. Tunisia adopted act no. 95-93 of November 9, 1995, which amended the Criminal Code to automatically reduce life sentences to ten years for persons under the age of eighteen. See U.N. Committee on the Rights of the Child, Consideration of Reports Submitted by States Parties Under Article 44 of the Convention: Tunisia, CRC/C/83/Add.1, para. 25 (Oct. 30, 2001). This became Article 43 of the Criminal Code. Ibid.
[312] Human Rights Watch researched this question using the following methodology: We examined the reports of 166 countries to the U.N. Committee on the Rights of the Child under Article 37 of that treaty (Article 37 prohibits sentencing child offenders to life without parole). Unfortunately, 53 countries failed to report to the Committee on their laws or practices under Article 37. Therefore, we used a variety of additional methods to obtain a definitive answer. These included inquiries with: the UNICEF Child Protection Officer in the country concerned, criminal defense attorneys, judges, criminal justice non-governmental organizations, and the press, as well as a review of articles covering recent sentencing decisions.
[313] These countries and the number of youth offenders executed are: Iran (8), Saudi Arabia (1), Nigeria (1), the Democratic Republic of Congo ("DRC") (1), Yemen (1), Pakistan (3), China (1), and the United States (19). See Amnesty International, Children and the Death Penalty, Executions Worldwide Since 1990, AI Index: ACT 50/007/2002, 25 Sept. 2002, p.14; updated to June 6, 2004 by International Justice Project, US JuvenileExecutions Since 1976, March 2004, available online at: http://www.internationaljusticeproject.org/juvStats.cfm, accessed on August 1, 2005.
[314] The original fifteen members of the EU are: Austria, Belgium, Denmark, Finland, France, Germany, Greece, Ireland, Italy, Luxembourg, Netherlands, Portugal, Spain, Sweden, United Kingdom.
[315] These countries are Algeria, Angola, Benin, Botswana, Burundi, Cameroon, Cape Verde, Chad, Cote d'Ivoire, Democratic Republic of the Congo, Djibouti, Egypt, Eritrea, Guinea, Guinea-Bissau, Lesotho, Liberia, Libya, Madagascar, Mali, Mauritius, Morocco, Mozambique, Namibia, Niger, Rwanda, Sao Tome and Principe, Togo, Tunisia, Uganda, and Zimbabwe.
[316] These countries are Comoros, Congo (Brazzaville), Ethiopia, Ghana, Madagascar, and Senegal. In all of these countries, life imprisonment without possibility of release is prohibited for persons under the age of sixteen. In each of these countries, we were unable to determine whether the sentence exists for individuals above the age of sixteen.
[317] These countries are: Malawi, Nigeria, and Sierra Leone.
[318] E-mail correspondence to Human Rights Watch from Erasmina Masawe, Volunteer Attorney, Legal and Human Rights Centre, Dar es Salaam, Tanzania, July 21, 2004 and July 30, 2004 (on file with Human Rights Watch).
[319] For the remaining nine countries out of the 154 researched, we were unable to obtain the necessary sources to determine whether or not the sentence exists in law, and if it does, whether or not it is imposed.
[320]South Africa State Party report to the CRC, CRC/C/51/Add.2, May, 22, 1999 at 514 (reporting four child offenders serving the sentence). In April 2005, the governmental delegation from South Africa to the Commission on Human Rights confirmed in informal meetings with members of the organization Human Rights Advocates that these four youth offenders were in fact serving life without parole sentences. See e-mail correspondence to Human Rights Watch from Human Rights Advocates, Berkeley, California, September 7, 2005 (one file with Human Rights Watch). However, as part of the post-apartheid overhaul of the judicial system, juvenile justice procedures are under review, and a Child Justice Bill is currently under discussion in parliament. In line with the CRC, the Bill would outlaw life imprisonment for child offenders (see Article 72, available online at: http://www.pmg.org.za/bills/020808childjusticebill.htm, accessed on September 15, 2005.). Moreover, in November 2004, in Brandt v S (case 513/03, Supreme Court of Appeal) the South African Supreme Court held that minimum sentencing legislation should not apply to juveniles convicted of serious crimes.
[321] See e-mail correspondence to Human Rights Watch from Erasmina Masawe, Volunteer Attorney, Legal and Human Rights Centre, Dar es Salaam, Tanzania (July 21, 2004 and July 30, 2004).
[322] See Israel State Party report to the CRC, CRC/C/8/Add.44, 27 February 2002, para. 1372 (stating that life imprisonment "has been imposed on three 17-year-olds who stabbed a bus passenger to death as part of the 'initiation rite' of a terrorist organization; and on a youth age 17 and 10 months who strangled his employer to death after she commented on his work and delayed payment of his salary for two days"). Since February 2002, Human Rights Watch has learned of three additional youth offenders who were all below age eighteen at the time of their offenses and have been sentenced to life: Shadi Ghawadreh, Youssef Qandil, and Anas Mussallmeh. See email to Human Rights Watch from Research Coordinator, Palestinian Section, Defense for Children International, September 10, 2005 (on file with Human Rights Watch) (E-mail from Research Coordinator, Defense for Children International). According to Israeli law, normally individuals sentenced to life would be eligible for a sentence commutation to thirty years upon a recommendation from the Ministry of Justice. See Huk Shihror Al Tnai Mimasar, Hatashsa 2001, Article 29. However, youth offenders sentenced by military courts under the Israeli 1945 Emergency Regulations to life sentences for political and security crimes do not enjoy this privilege. See Huk Shihror Al Tnai Mimasar, Hatashsa 2001, Article 31. We have been unable to ascertain how many of the seven youth offenders sentenced to life in Israel are political or security prisoners-that is, those who would not be eligible for the thirty year sentence commutation. E-mail from Research Coordinator, Defense for Children International. See also Israel State Party report to the CRC, CRC/C/8/Add.44 para. 1372 (noting that no absolute prohibition on life sentences for youth exists in Israel, and the Supreme Court has the discretion to review each case on the merits and may impose a life sentence on a youth offender, which, in the views of one Israeli Supreme Court Justice, raises questions on the prohibition on life without parole sentences contained in the Convention on the Rights of the Child).
[323] See Burkina Faso State Party report to the CRC, CRC/C/65/Add.18, February 13, 2002 at 406, 445. Under Cuban law, an individual above age sixteen may be sentenced to "privacion perpetua" (a life without parole sentence); however, under the Cuban Codigo Penal, children age seventeen may have their sentences reduced by one-half. Because this provision is discretionary, it appears to be technically possible for a youth above sixteen to receive the sentence. See Codigo Penal de Cuba, Art. 17.1 ("En el caso de personas de más de 16 años de edad y menos de 18, los límites mínimos y máximos de las sanciones pueden ser reducidos hasta la mitad, y con respecto a los de 18 a 20, hasta en un tercio.") ("In the case of persons older than sixteen years of age and younger than eighteen, the minimum and maximum punishments may be reduced by half, and with respect to those between eighteen and twenty, by one third.") (translated by Human Rights Watch).
[324] See Hussain and Prem Singh v. United Kingdom, 22 EHRR 1 (1996) (holding that "for the duration of Her Majesty's Pleasure" did not authorize wholly punitive life-long detention, because it invoked the protection of Articles 3 and 5(4) of the European Convention of Human Rights, which required changes in the character, personality and mental state of the young offender to be considered after a term of years during mandatory and repeated parole reviews.).
[325] Commission on Human Rights, Human Rights in the Administration of Justice, in particular juvenile justice, E.CN.4/2004/L.66 April 15, 2004, para. 11.
[326] In the face of this global concurrence, the U.S. government cannot claim that it is free of its customary law obligations by virtue of being a persistent objector. A persistent objector is a state that has consistently and expressly protested the rule during the rule's inception and development and, consequently, can claim the right not to be bound by the rule. John Currie, Public International Law, (2001), p.176; Hugh Thirlway, "The Sources of International Law", in International Law, Malcolm Evans, ed. (2003), p.117. One commentator notes: "The state must, from the rule's inception, consistently maintain its objection without exception. Even a single lapse will be fatal to the state's claim of persistent objector status." John Currie, Public International Law (2001) p.164. Once a rule has become established as customary international law, a persistent objector might not be able to maintain the ability to opt out. Mark Villiger, Customary International Law and Treaties (1997), p. 35.
[327]The Paquete Habana, 175 U.S. 677, 699 (1900).
[328] The International Court of Justice (ICJ) has described the opinio juris requirement as follows: "Not only must the acts concerned amount to a settled practice, but they must also be such, or be carried out in such a way, as to be evidence of a belief that this practice is rendered obligatory by the existence of a rule of law requiring it." International Court of Justice, Judgment, North Sea Continental Shelf, para. 77 (Feb. 20, 1969).
[329] International Court of Justice, Judgment, North Sea Continental Shelf, paras. 73-4 (Feb. 20, 1969) (finding that "although the passage of only a short period of time is not necessarily, or of itself, a bar to the formation of a new rule of customary international law on the basis of what was originally a purely conventional rule, an indispensable requirement would be that within the period in question, short though it might be, State practice, including that of States whose interests are specially affected, should have been both extensive and virtually uniform in the sense of the provision invoked; and should moreover have occurred in such a way as to show a general recognition that a rule of law or legal obligation is involved.").
[330] Others have concluded that the prohibition on juvenile life without parole sentences is a rule of customary international law. See Human Rights Advocates, Submission to the Sixty-First Session of the Commission on Human Rights, The Death Penalty and Life Imprisonment without the Possibility of Release for Youth Offenders who were Under the Age of 18 at the time of the Offense, Spring 2005, available online at: http://www.humanrightsadvocates.org/images/Juvenile%20Sentences.doc, accessed on August 3, 2005. Several international treaty bodies reiterate the prohibition in their general comments and annual resolutions on a regular basis. See, e.g., Commission on Human Rights, Human Rights in the Administration of Justice, in particular juvenile justice, 2004/43; Report on the Twenty-Fifth session of the Committee on the rights of the Child, September / October 2000, CRC/C/100, p. 130; European Union, Memorandum on the Death Penalty, available online at: http://www.eurunion.org/legislat/DeathPenalty/eumemorandum.htm, accessed on August 1, 2005) (stating that "The United Nations Convention on the Rights of the Child prohibits sentencing minors both to death and also to imprisonment for life without the possibility of release. These are juvenile justice standards of paramount relevance and the EU urges the USA to ratify the Convention.").
[331] The three countries out of the twenty-nine with higher or equal percentages of youth among their homicide offenders were England and Wales, with 10 percent; Slovenia with 10.2 percent; and Slovakia with 16.3 percent. Among countries with lower percentages than the United States, Poland ranked sixth highest with 8.6 percent, France ranked seventh highest with 8.4 percent; Germany ranked thirteenth highest with 5.8 percent, Scotland ranked twenty-fifth with 1.5 percent and Cyprus, Ireland, Italy, Switzerland, and Northern Ireland all had zero homicide offenders below the age of eighteen.See Council of Europe, European Sourcebook of Crime and Criminal Justice Statistics, 2003, 2nd ed., Chapter 3, Tables 3.2.1.3, 3.2.1.4, 3.2.2.2, and 3.3.1.2, http://www.minjust.nl:8080/b_organ/wodc/publications/ob212_all.pdf, (retrieved March 23, 2005); and Snyder, H., Finnegan, T., Wan, T., and Kang, W., Easy Access to the FBI's Supplementary Homicide Reports: 1989-2000, available online at: http://www.ojjdp.ncjrs.org/ojstatbb/ezashr/asp/Off_Display.asp, accessed on August 3, 2005. The European and U.S. data are slightly different in the following ways: (1) the European data may include juveniles convicted for intentional homicide (defined as both attempted and completed homicide), whereas the U.S. data only includes completed homicides; and (2) the U.S. data are for children between the ages of one to seventeen; whereas the European data may be more variable based on each country's youngest possible age that could be included in the dataset (for example, Cyprus, France, Greece and Switzerland could include individuals as young as seven years old). In addition, individuals aged eighteen and nineteen could be included in the data from Austria. Nevertheless, it is reasonable to assume that the age-spread of juvenile homicide offenders in Europe tended toward the fourteen to seventeen range, making the data fairly comparable to those from the United States.
[332] Human Rights Watch interview with Kevin C., Centennial Correctional Facility, Cañon City, Colorado, July 27, 2004 (pseudonym) (unless otherwise noted, all statements attributed to Kevin C. in this case study were obtained during this interview).
[333] Email correspondence with Human Rights Watch from Judith C., Colorado, May 17, 2005.
[334] Human Rights Watch telephone interview with Frank C., Colorado, October 22, 2004.
[335] Human Rights Watch telephone interview with Judy C., Colorado, October 22, 2004.
[336] "Youth on Trial," The Denver Post, November 28, 1995.
[337] Ibid.
[338] Email correspondence with Human Rights Watch from Judith C., Colorado, May 17, 2005.
[339] "Youth on Trial," The Denver Post, November 28, 1995.
[340] ICCPR, art. 10.3.
[341] See footnote 348, below, and surrounding text (citing Lisa Feldman, Michael Males, and Vincent Schiraldi, A Tale Of Two Jurisdictions: Youth Crime and Detention Rates in Maryland & the District of Columbia, Building Blocks for Youth, April 2001).
[342] Dana Canedy, "As Florida Boy Serves Life Term, Even Prosecutor Wonders Why," The New York Times, January 5, 2003, p. 1. On appeal, Tate won his release from prison and completed one year of house arrest in 2004. A few months later he was charged for allegedly attempting to rob a pizza delivery man. See "Tate Held Without Bond in Robbery," Associated Press, May 25, 2005.
[343] Erika Bolstad, "Governor: Allow Parole for Kids Tried As Adults," Miami Herald, March 19, 2004.
[344] Senator Edward Lucio, "Life Without Parole Bill Approved by Senate Criminal Justice Committee," Press Release, Austin, Texas, March 15, 2005, available online at: http://www.senate.state.tx.us/75r/senate/members/dist27/pr05/p031505b.htm, accessed on September 15, 2005.
See Shepard v. Taylor, 556 F.2d 648, 653 (2d Cir., 1977) (citing United States v. Kaylor, 491 F.2d 1133 (2d Cir. 1974) (en banc), vacated for reconsideration on other grounds, 418 U.S. 909 (1974); United States v. Waters, 141 U.S. App. D.C. 289 (1970)).
[347]Roper v. Simmons, 125 S.Ct. 1183, 1195 (2005).
See Simon Singer and David McDowall, "Criminalizing Delinquency: The Deterrent Effects of the New York Juvenile Offender Law," Law and Society Review, vol. 22 (1988) p. 529.
[349]Lisa Feldman, Michael Males, and Vincent Schiraldi, A Tale Of Two Jurisdictions: Youth Crime and Detention Rates in Maryland & the District of Columbia, Building Blocks for Youth, April 2001, available online at: http://www.buildingblocksforyouth.org/dcmd/dcmd.html, accessed on September 15, 2005.
[350]Roper v. Simmons, 125 S.Ct. 1183, 1197 (2005).
[351] Ibid.
[352] "The Florida Experiment: Transferring Power from Judges to Prosecutors," p. 3.
[353]In re Stanford, 537 U.S. 968, 970-71 (2002) (Justices Stevens, Souter, Ginsberg, and Breyer, dissenting) (quoting Stanford v. Kentucky,492 U.S. 361, 394-96 (1989) (Brennan, J., dissenting).
[354] See Appendix C for an example of the letters sent to state departments of corrections.
[355] For example, an individual who was 17.9 at the time of his or her crime could spend as little as 13 months in the arrest to sentencing stage before entering prison. An individual who was 17.0 at the time of his or her crime could spend as much as two years in the arrest to sentencing stage before entering prison. The problem with using age nineteen at admission as the cut-off for our analysis, however, are those cases of eighteen or nineteen-year-old offenders sentenced to life without parole who may be included in the dataset. It is also possible that someone who committed their crime at 17.0 entered prison after he or she turned twenty, in which case he or she would not have been included in the dataset. After conducting sampling analyses in a few key states however, we determined that nineteen was the most accurate age cut-off we could choose.
[356] See Letter to Human Rights Watch from Jose A., United States Penitentiary Allenwood, White Deer, Pennsylvania; February 11, 2003 (pseudonym) (on file with Human Rights Watch); "Man sentenced to 50 years in prison in compliance with plea deal," Associated Press, April 26, 2000; "Four gang members get life in Yonkers killing," Associated Press, December 14, 2000.